BLOG




















Target competitor analysis for brands helps retailers, CPG companies, manufacturers, and marketplace sellers understand how products perform against competing brands across pricing, assortment, availability, promotions, and digital visibility. The core challenge is simple: brands may know their own performance but lack a consistent view of what competitors are offering, how products are priced, and where assortment or visibility gaps exist.
Target Corporation operates a large omnichannel retail ecosystem spanning physical stores and digital channels. Target reported $104.78 billion in net sales for 2025, with digitally originated merchandise sales reaching $21.1 billion, compared with $20.5 billion in 2024. (Target Corporation)
This scale creates a substantial competitive intelligence requirement. A brand competing within Target needs to monitor more than its listed price. It needs to understand assortment depth, product availability, search and digital shelf positioning, promotions, competing SKUs, pack sizes, and changes over time.
Target analytics can turn this marketplace information into structured intelligence that helps e-commerce managers, category managers, brand teams, pricing teams, and sales leaders make faster decisions.
The business problem becomes particularly important because Target's digital channel continues to evolve. In 2025, digitally originated merchandise sales represented 20.6% of merchandise sales, up from 19.6% in 2024 and 18.3% in 2023. Digitally originated comparable sales increased 3.1% in 2025. (Target Corporation)
| Competitive Area | What Brands Need to Understand |
|---|---|
| Pricing | How competitor prices compare with their own |
| Assortment | Which products, variants, and pack sizes competitors offer |
| Availability | Where products are available or unavailable |
| Promotions | Which discounts and offers competitors are running |
| Digital shelf | How products are presented and discovered |
| Share of shelf | How much visible assortment competitors occupy |
| Product data | How competitor catalogs are structured |
| Historical trends | How competitive conditions change over time |
The result is a more complete view of the competitive environment instead of isolated price checks or manual product searches.
Target competitor pricing analysis helps brands monitor competitor prices, discounts, promotions, pack sizes, and price movements across comparable products. When combined with Target competitor analysis for brands, pricing teams can distinguish between an isolated price change and a broader competitive pricing pattern.
Pricing intelligence is particularly important for retailers and consumer brands operating in categories where several products compete for the same customer demand. A competitor may appear cheaper because of a temporary promotion, a different pack size, a loyalty offer, or a permanent price adjustment. Without structured product-level data, these differences can be difficult to interpret.
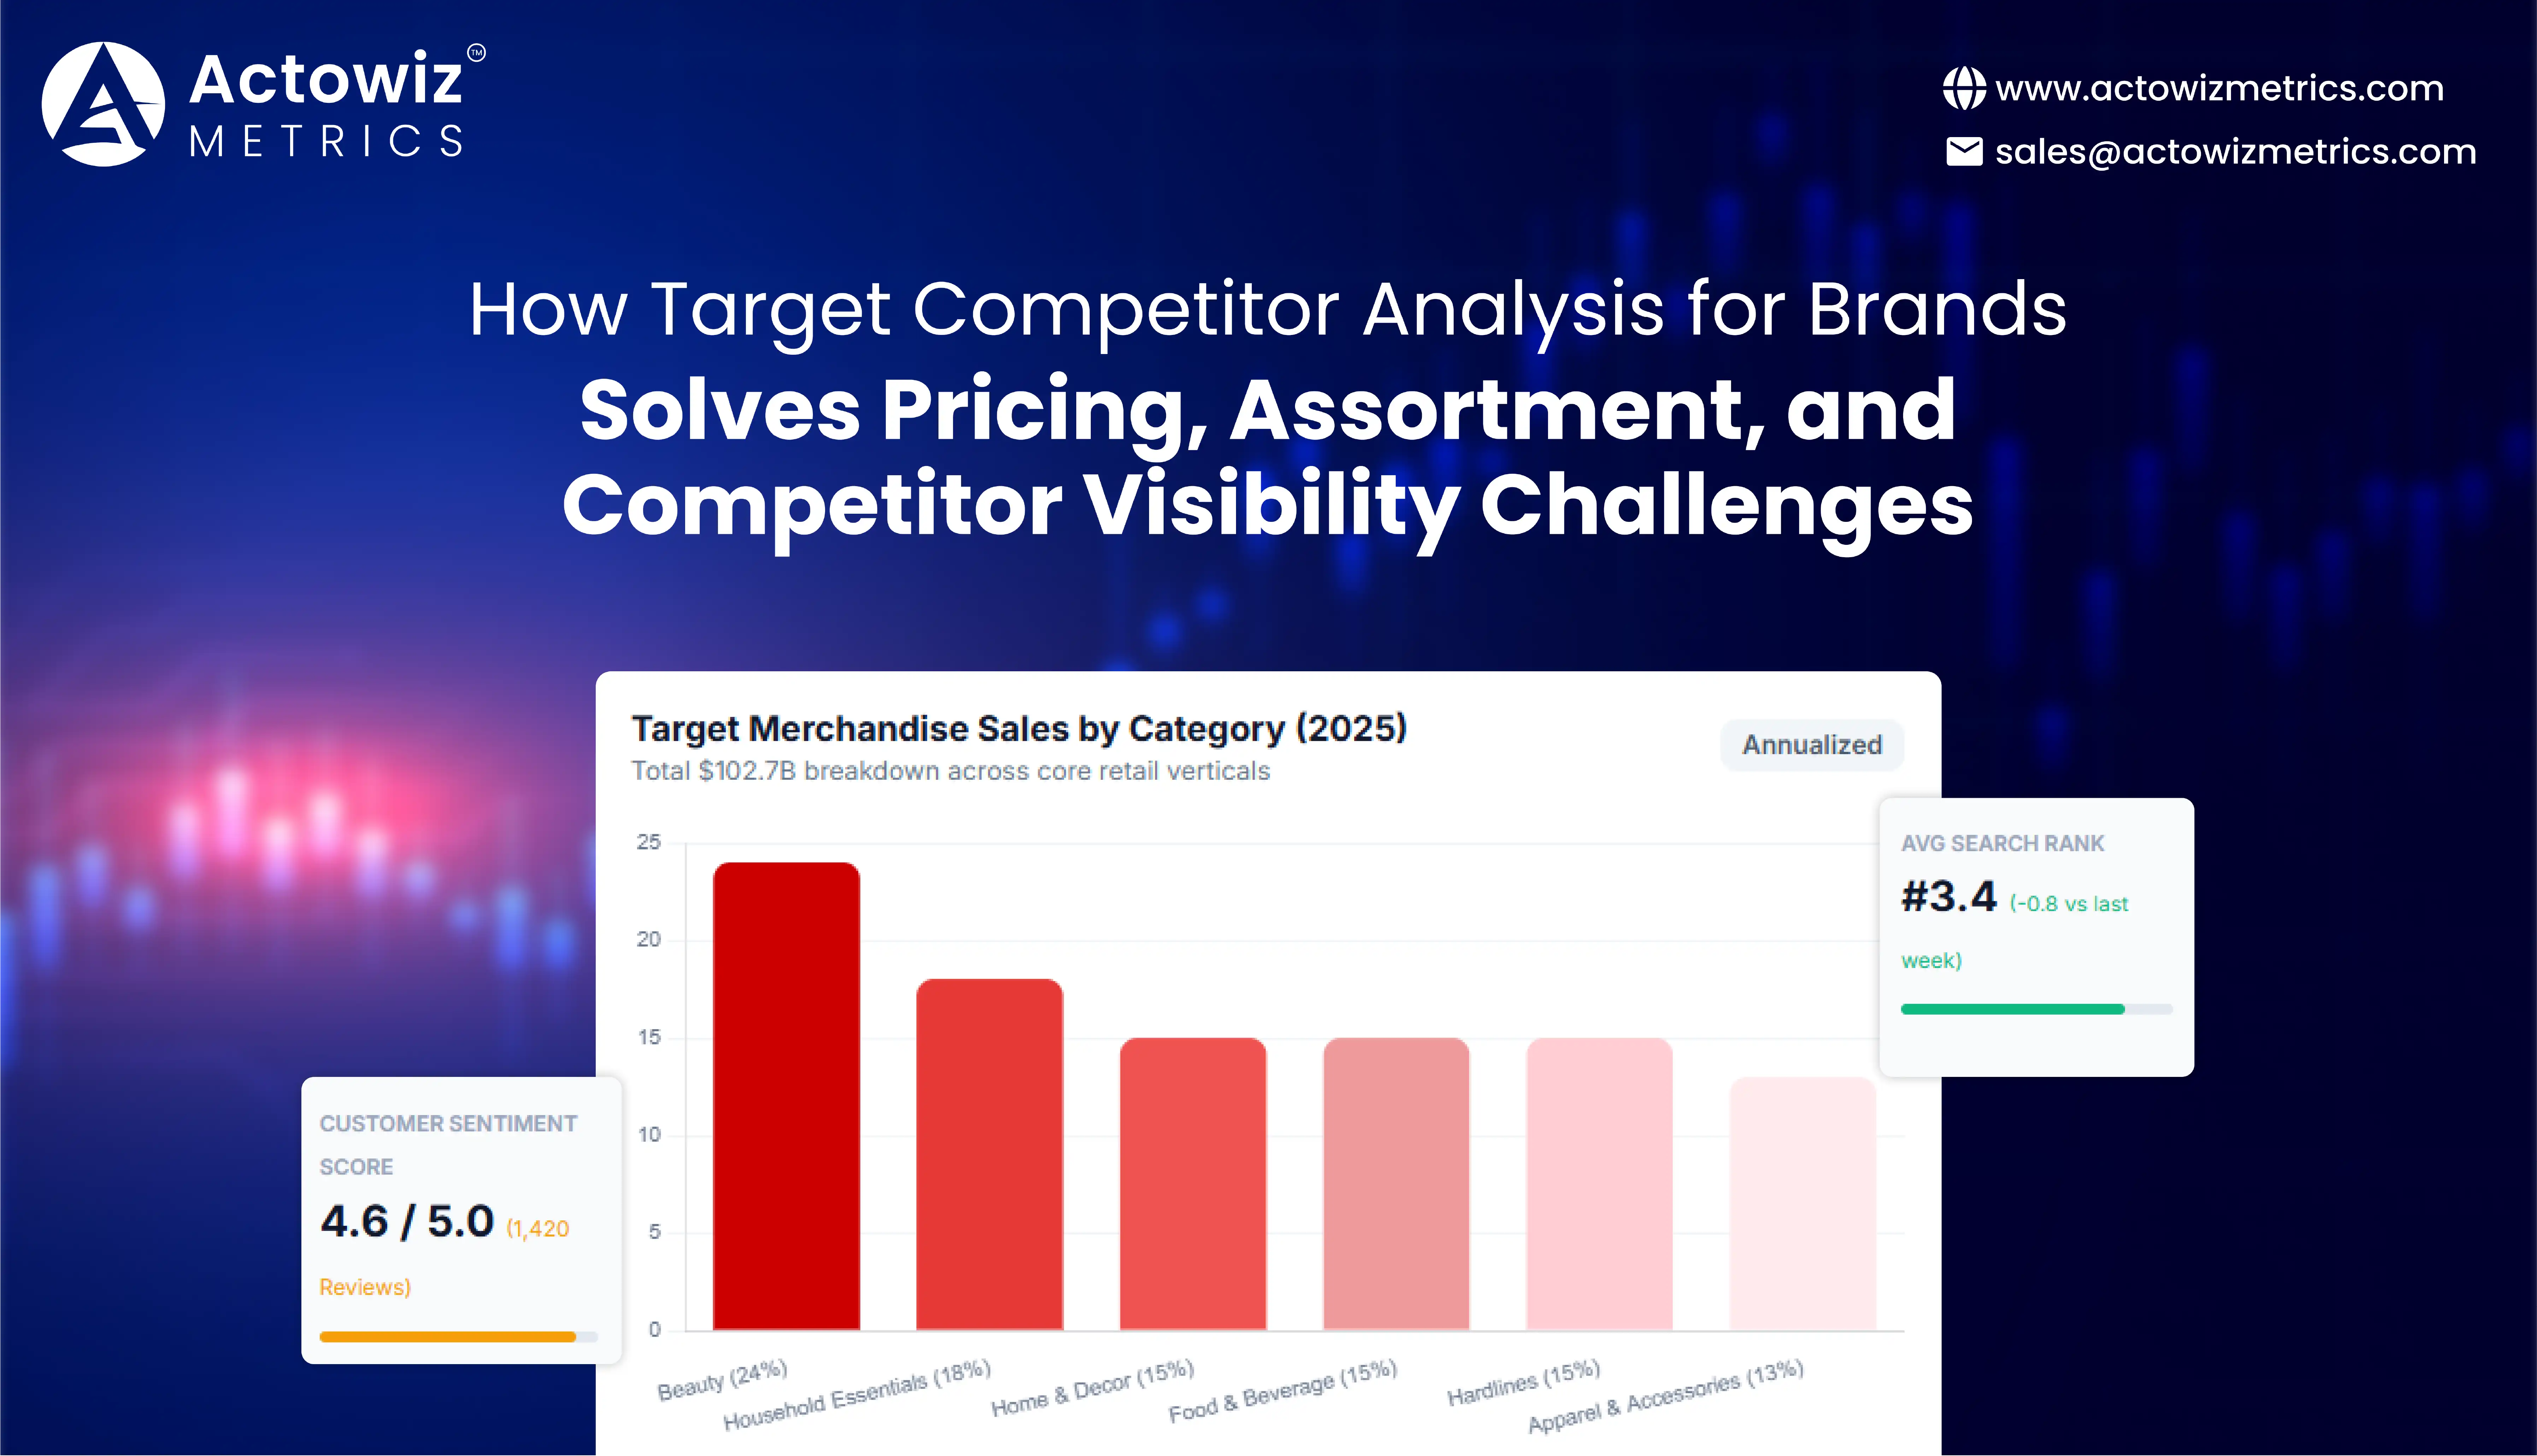
Target's 2025 financial results show the importance of balancing value and assortment. The company reported $102.7 billion in merchandise sales across categories including beauty, food and beverage, household essentials, hardlines, apparel and accessories, and home furnishings and décor. (Target Corporation)
| Pricing Signal | Competitive Question |
|---|---|
| Listed price | What price does the shopper see? |
| Discount | Is the competitor using a temporary discount? |
| Promotional price | How aggressive is the current offer? |
| Pack size | Is the comparison between equivalent products? |
| Unit price | Which product provides the lower effective price? |
| Price history | Is the change temporary or recurring? |
| Category average | Where does the product sit within its competitive set? |
From 2020 to 2026, retail pricing intelligence became increasingly dependent on digital data. The pandemic accelerated online shopping and forced retailers to manage price and inventory changes more dynamically. Target's digitally originated sales grew from $20.0 billion in 2022 to $20.5 billion in 2024 and $21.1 billion in 2025. (Target Corporation)
During this period, price monitoring also became more contextual. A lower competitor price cannot automatically be treated as a pricing threat if the product has a smaller pack size or if the discount is short-lived. Effective analysis therefore compares equivalent SKUs, unit economics, promotion depth, and price history.
For pricing managers, the actionable insight is to monitor price movement alongside product equivalence and promotional context. This creates a more reliable basis for pricing decisions than simply comparing displayed prices.
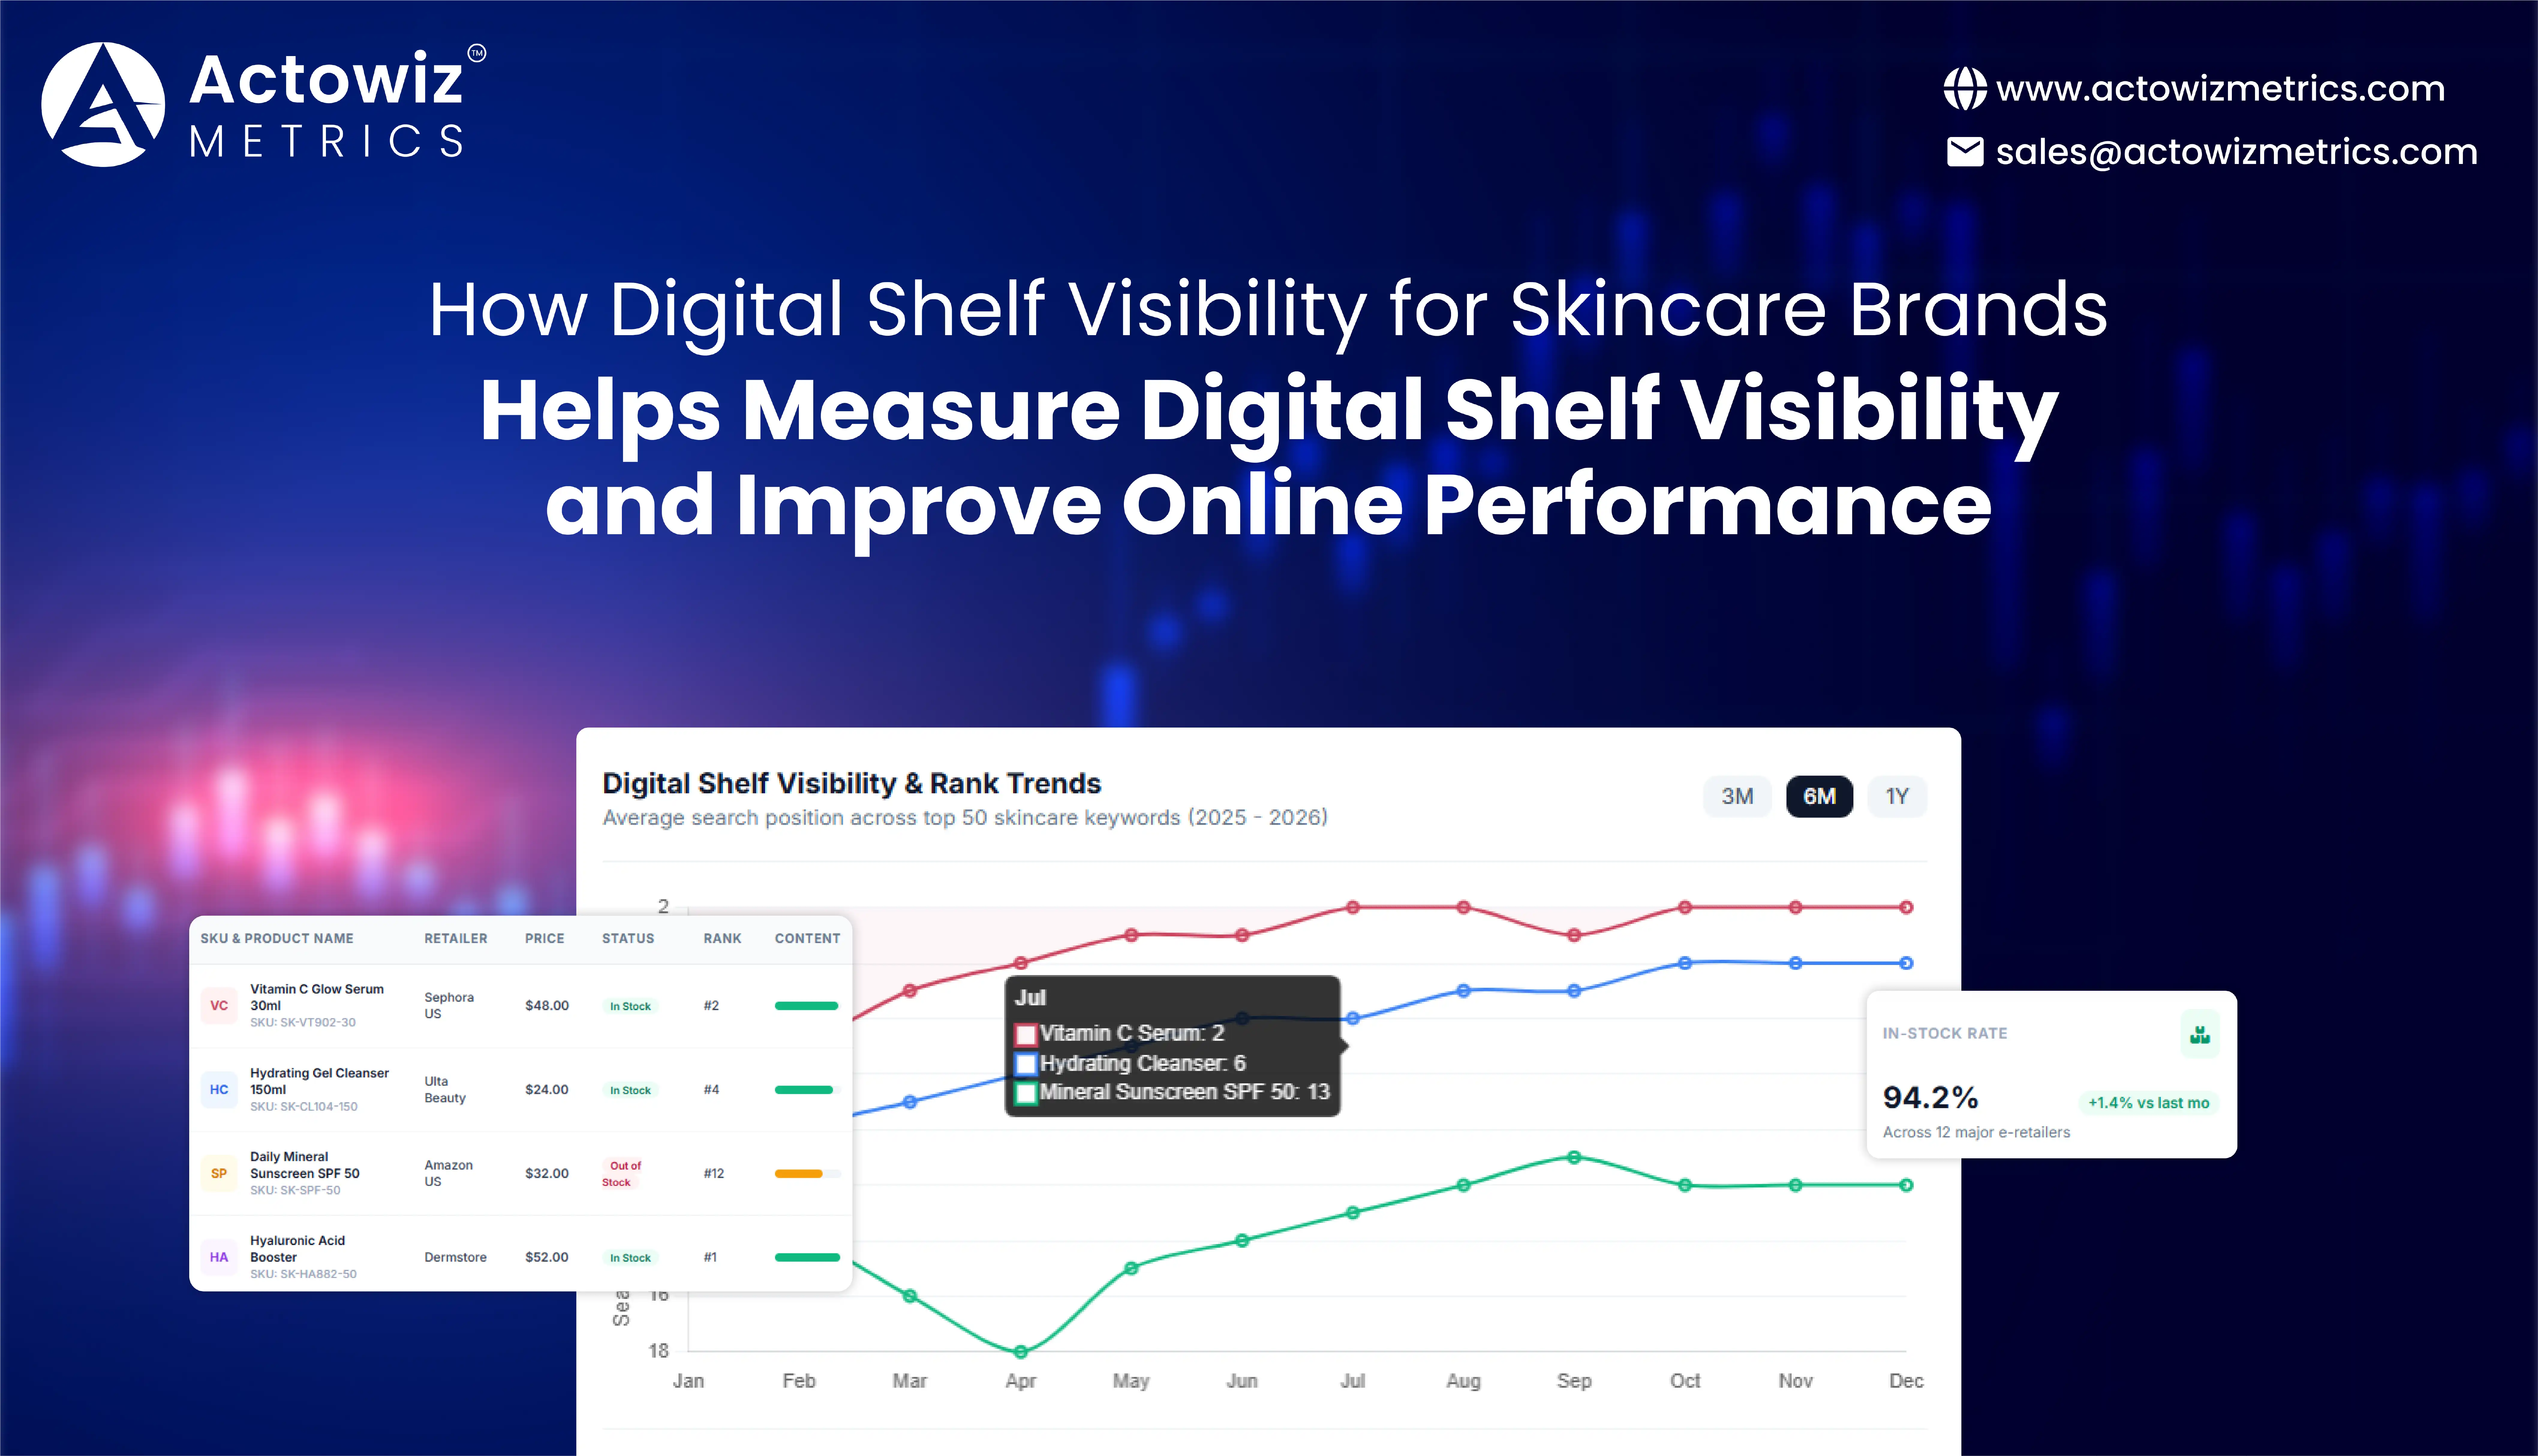
Target digital shelf competitor monitoring gives brands visibility into how competing products appear to shoppers across digital retail environments. It can track product titles, images, descriptions, ratings, reviews, prices, promotions, availability, search placement, and assortment.
Target's digital business has become an increasingly important part of its omnichannel model. In 2025, digitally originated merchandise sales reached $21.1 billion, while digitally originated comparable sales increased 3.1%. Target also stated that its stores fulfilled 97.6% of merchandise sales in 2025, demonstrating how closely its physical and digital operations are connected. (Target Corporation)
This means digital shelf performance cannot be viewed independently from store-level availability.
| Digital Shelf Element | What It Reveals |
|---|---|
| Product title | How clearly the product is identified |
| Images | Quality of visual merchandising |
| Description | Depth and clarity of product information |
| Ratings | Customer perception signals |
| Reviews | Consumer feedback and product issues |
| Search placement | Potential discoverability |
| Availability | Whether the shopper can purchase |
| Promotions | Current merchandising activity |
Between 2020 and 2026, digital shelf management shifted from maintaining basic product listings toward continuously optimizing the complete online shopping experience. Target's 2025 strategy specifically emphasized improving its "digital front door," enhancing search and personalization, and using technology and AI to support the shopping experience. (Target Corporation)
For brands, this evolution means competitor monitoring should not stop at price. A competitor with a stronger product image, more complete content, higher review volume, better availability, or more visible promotional messaging may capture shopper attention even when the products are similarly priced.
A useful monitoring system should therefore create a consistent comparison between the brand's own digital shelf and competing products.
The key insight is that digital shelf visibility is a combination of discoverability, content quality, availability, and commercial positioning.
Target competitor product data collection allows brands to build structured datasets covering competing products, categories, brands, pack sizes, prices, ratings, reviews, and availability. When combined with Target competitor analysis for brands, this information can reveal assortment gaps and opportunities that are difficult to identify through manual research.
Assortment is one of the most important dimensions of retail competition because shoppers often compare several alternatives before purchasing. A competitor that expands into a new subcategory, introduces additional pack sizes, or adds premium and value variants can change the competitive structure of a category.
Target's 2025 merchandise mix illustrates the breadth of categories involved. Its merchandise sales included 24% from beauty, 18% from household essentials, 15% from food and beverage, 15% from hardlines, 15% from home furnishings and décor, and 13% from apparel and accessories. (Target Corporation)
| Product Data Point | Assortment Insight |
|---|---|
| Brand | Which competitors are active? |
| Category | Where is competition concentrated? |
| Product name | What products are being offered? |
| Variant | Which versions are available? |
| Pack size | How broad is the size range? |
| Price | How is each product positioned? |
| Rating | Which products show stronger customer signals? |
| Availability | Which products are consistently purchasable? |
From 2020 to 2026, assortment intelligence became more important as retailers expanded their digital catalogs and marketplace ecosystems. Target's third-party Target Plus marketplace added further assortment breadth, and the company reported that the marketplace was growing at a double-digit pace in its 2024 annual report. (Target Corporation)
For brands, this means competitor analysis must identify both direct competitors and adjacent products. A skincare brand, for example, should not only monitor competing moisturizers. It may also need to track serums, cleansers, bundles, travel sizes, premium alternatives, and value alternatives.
Historical product data makes these changes easier to identify. Brands can detect new product launches, discontinued products, assortment expansion, and changes in pack architecture.
The actionable opportunity is to use product data to answer a practical question: What is missing from our assortment that competitors are already using to attract shoppers?
Target product availability tracking helps brands identify whether products remain consistently available across digital channels and relevant locations. Availability is a fundamental competitive signal because a product cannot convert a shopper if it cannot be purchased.
Target's operating model makes availability particularly significant. The company states that stores function as fulfillment hubs and that more than 97% of merchandise sales were fulfilled through stores in each of the last three years. Target also connects store fulfillment with Order Pickup, Drive Up, shipping, and same-day delivery. (Target Corporation)
This creates a need to monitor availability at a granular level.
| Availability Metric | Business Use |
|---|---|
| In-stock status | Identify immediate purchase availability |
| Out-of-stock frequency | Detect recurring availability problems |
| Product-level availability | Identify affected SKUs |
| Location-level availability | Find geographic gaps |
| Competitor availability | Compare access to alternatives |
| Variant availability | Identify missing sizes or versions |
| Historical availability | Detect recurring patterns |
Between 2020 and 2026, retailers increasingly connected physical inventory with digital shopping journeys. Target's stores-as-hubs model demonstrates how inventory availability can influence both store and digital experiences. In 2025, 97.6% of Target's merchandise sales were fulfilled through stores. (Target Corporation)
For brands, availability monitoring should therefore be connected to assortment and pricing data. A competitor may have a lower advertised price, but if its product is unavailable, the commercial implication differs. Similarly, a brand may appear to have weak demand when the underlying issue is recurring stock availability.
Historical availability data can also help distinguish between isolated operational events and systematic problems.
The most useful approach is to identify which products are unavailable, where they are unavailable, how frequently the problem occurs, and how competitor availability compares.
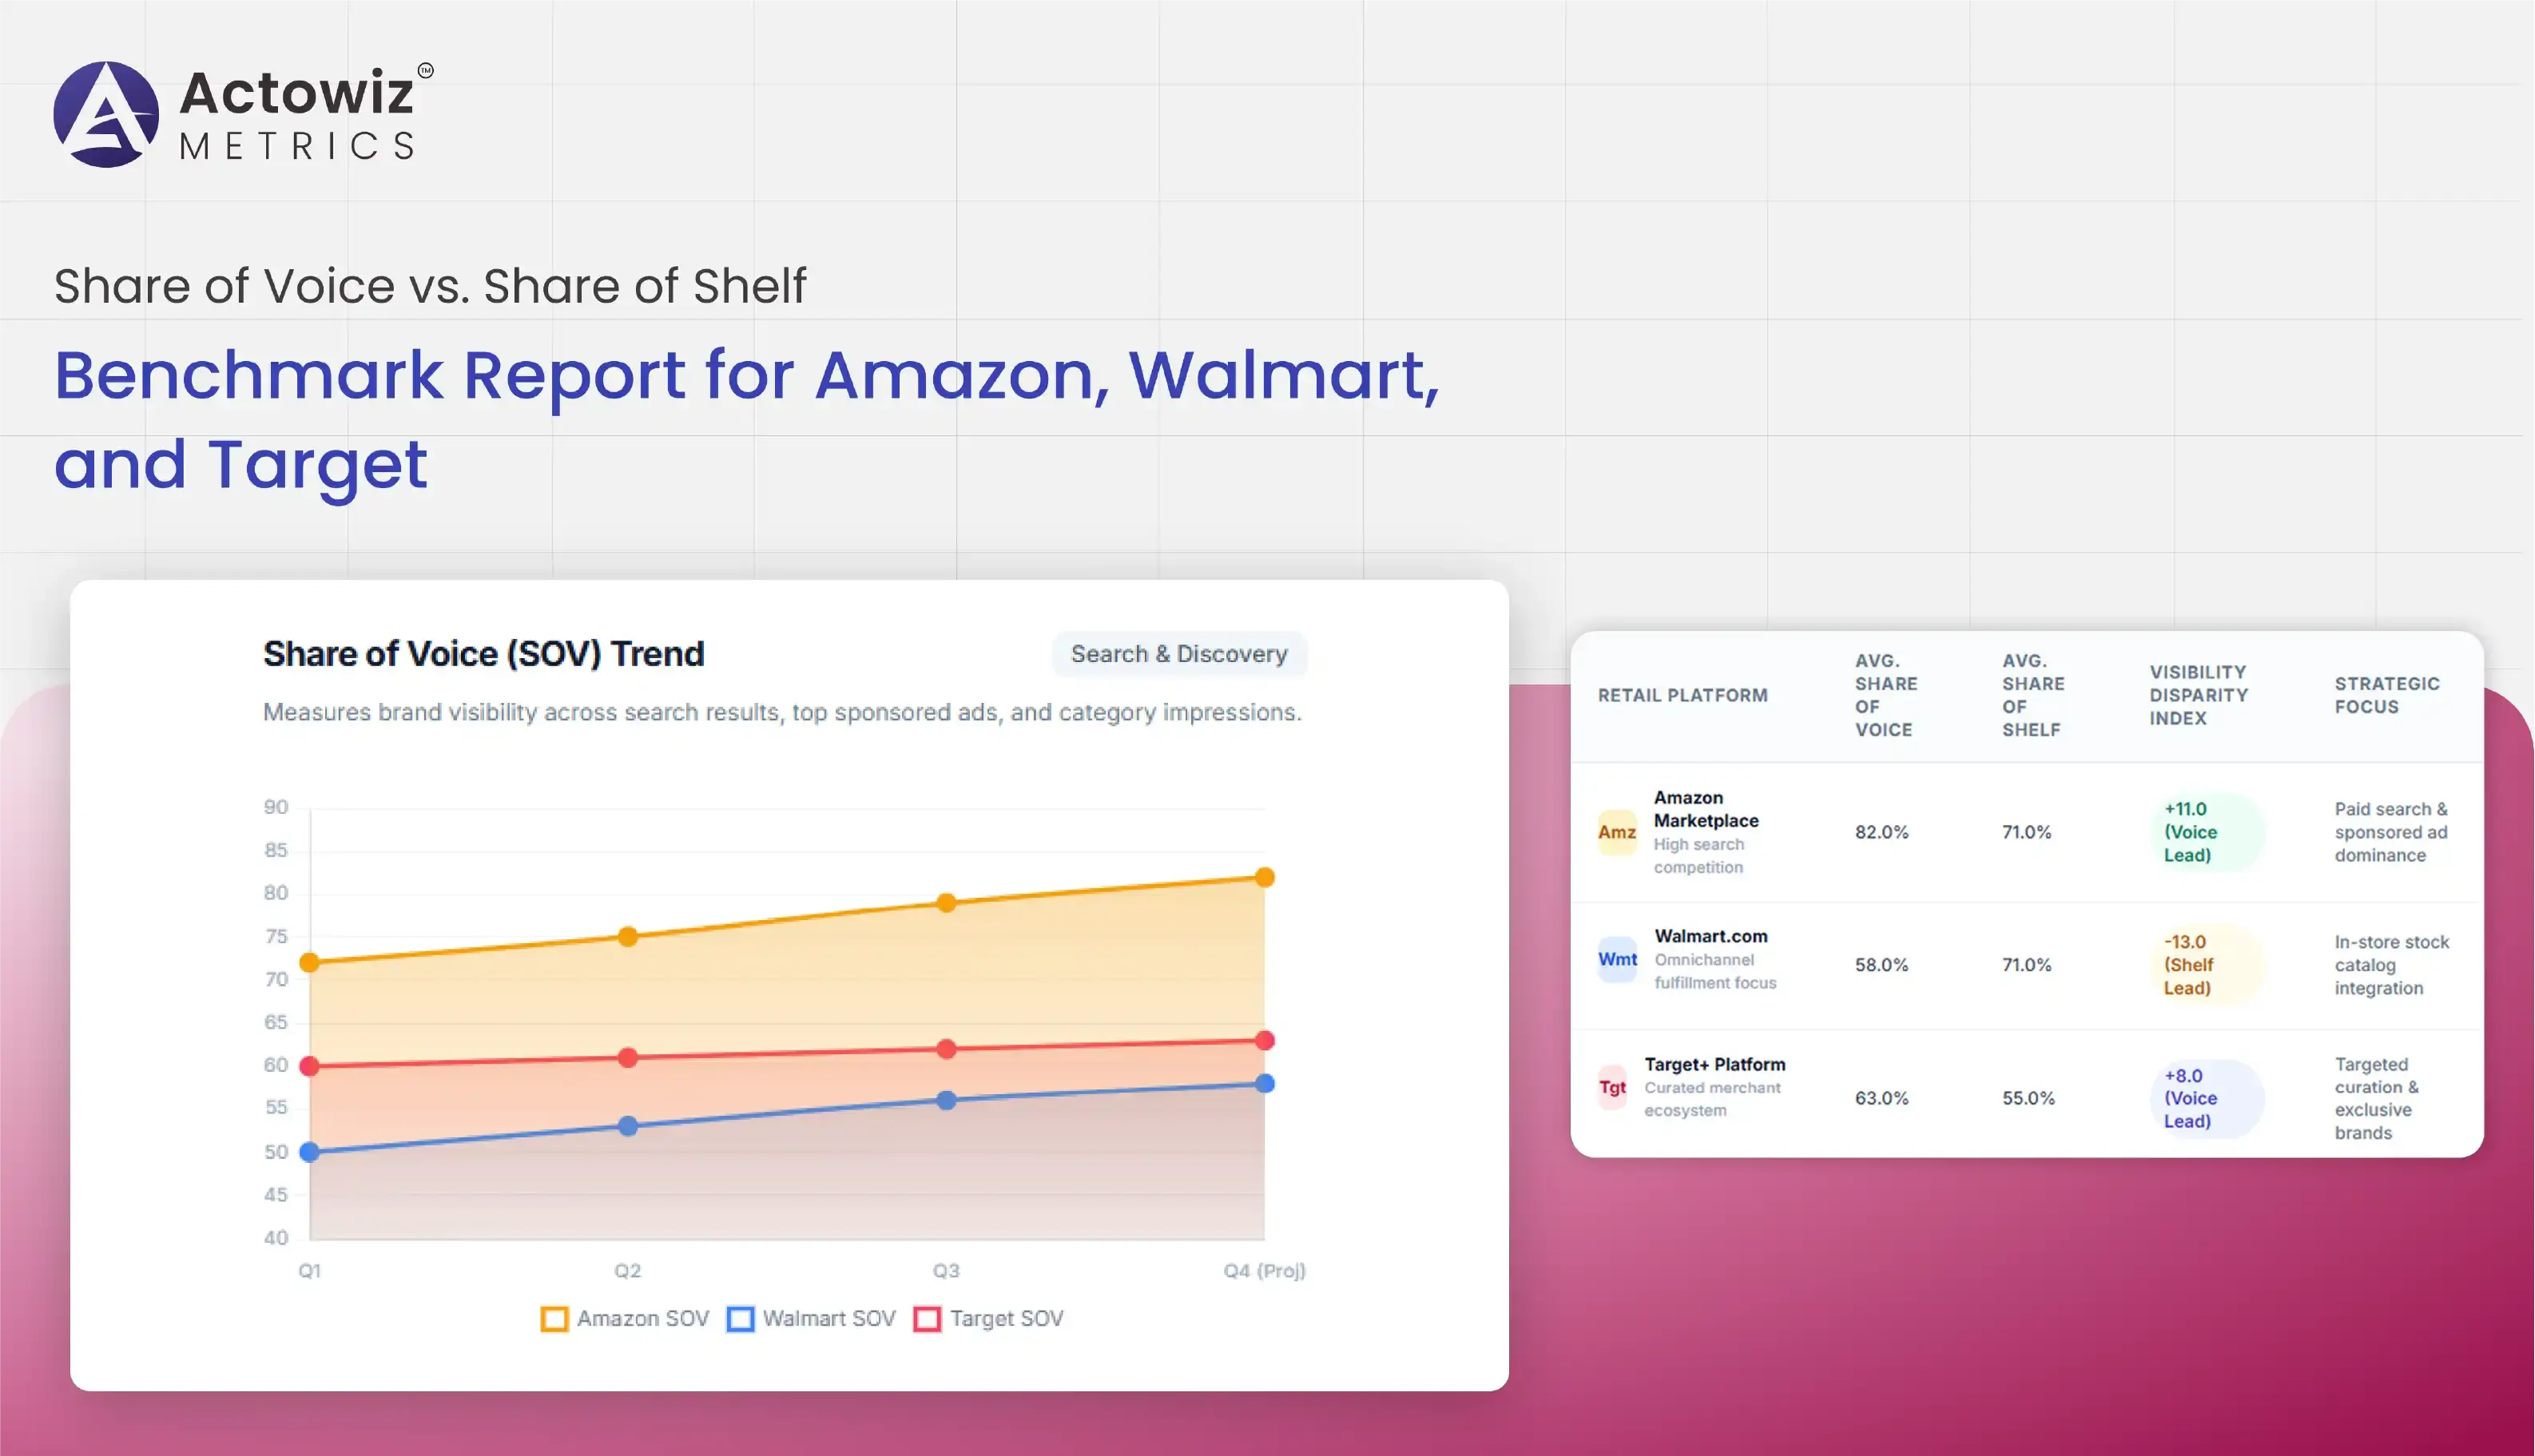
Target share of shelf analysis for brands helps businesses measure their visible presence within a category relative to competing products. Instead of looking at one product in isolation, share-of-shelf analysis examines the broader competitive environment.
This can include the number of competing SKUs, brand representation, product placement, promotional presence, category coverage, search visibility, and assortment depth.
Target's 2025 merchandise sales were distributed across six major merchandise groups, with beauty accounting for 24%, household essentials 18%, home furnishings and décor 15%, food and beverage 15%, hardlines 15%, and apparel and accessories 13%. (Target Corporation) The breadth of these categories means that brands can face very different competitive conditions depending on where they operate.
| Share-of-Shelf Metric | What It Measures |
|---|---|
| SKU count | Number of visible products by brand |
| Category presence | Brand representation within a category |
| Variant depth | Number of sizes, colors, or formats |
| Search visibility | Presence across relevant searches |
| Promotional presence | Visibility of active offers |
| Availability share | Share of products currently purchasable |
| Content presence | Completeness of digital merchandising |
From 2020 to 2026, share-of-shelf analysis became increasingly digital. Physical shelf space remains important, but digital shelves introduce additional dimensions such as search ranking, product recommendations, filters, sponsored placements, and online assortment.
Target's 2025 annual report also states that the company is using technology, data, and AI to improve personalization, search, and digital experiences. (Target Corporation) That makes digital visibility increasingly relevant to competitive analysis.
For a brand manager, share of shelf can answer questions that price monitoring cannot. Is the competitor launching more variants? Is its category presence expanding? Are its products more consistently available? Is the brand losing digital visibility even when its own assortment remains stable?
The original insight is that share of shelf should be treated as a dynamic competitive metric rather than a static product-count measure.
Competitor intelligence helps brands connect pricing, assortment, availability, digital shelf, and promotional signals into a single decision framework. Combined with Target competitor analysis for brands, it gives category managers a broader explanation of why competitive conditions are changing.
Target's own strategy highlights the importance of assortment, value, technology, personalization, and digital experience. Its 2025 annual report states that the company is using data and technology to improve personalization and execution while strengthening its digital shopping experience. (Target Corporation)
| Intelligence Layer | Strategic Question |
|---|---|
| Pricing | Are competitors becoming more aggressive? |
| Assortment | Are competitors expanding their product range? |
| Availability | Are competitors more consistently in stock? |
| Promotions | Which offers are gaining visibility? |
| Digital shelf | Which products are easier to discover? |
| Reviews | Which products are gaining customer validation? |
| Share of shelf | Is competitive presence expanding or declining? |
| Historical trends | Are changes temporary or structural? |
The 2020–2026 period demonstrates why historical competitive intelligence is valuable. Target's net sales increased from $93.56 billion in 2020 to $104.78 billion in 2025, while the company's digital business continued to develop alongside its physical store network. (Target Corporation)
The competitive environment therefore cannot be understood through one-time snapshots. Brands need longitudinal datasets that show how products, prices, availability, and assortment change.
For example, a category manager could detect that a competitor introduced several new SKUs, increased promotional frequency, and gained availability across more locations. Individually, each signal may appear minor. Together, they indicate a meaningful shift in competitive strategy.
This is where competitive intelligence becomes actionable. It transforms scattered marketplace observations into structured evidence that can support pricing, assortment, merchandising, and sales decisions.
Actowiz Metrics helps brands convert marketplace information into structured, recurring datasets for competitive intelligence. Instead of relying on manual searches and disconnected spreadsheets, brands can build monitoring workflows around products, categories, prices, promotions, availability, and competitor activity.
Price & promotion intelligence can help businesses monitor changing competitive conditions across relevant products. Data can be organized by SKU, brand, category, price, discount, promotion, pack size, availability, ratings, and other accessible attributes.
| Data Category | Example Monitoring Scope |
|---|---|
| Product data | Product name, brand, category, SKU, variant |
| Pricing | Current price, previous price, discount |
| Promotions | Offers, promotional messaging |
| Availability | In-stock/out-of-stock status |
| Competitors | Comparable brands and products |
| Reviews | Rating and review volume |
| Digital shelf | Product content and visibility signals |
| Assortment | New, existing, and discontinued products |
| Historical data | Changes across monitoring periods |
Actowiz Metrics can help transform these observations into analytics-ready datasets. Brands can use recurring data collection to compare competitors over time and identify changes that manual monitoring may miss.
For e-commerce managers, the benefit is greater visibility into category conditions. For pricing teams, it provides a structured basis for evaluating price movements. For brand managers, it can reveal assortment and visibility gaps. For sales teams, it can support retailer conversations with evidence from marketplace conditions.
The objective is not simply to collect Target product data. It is to create a repeatable competitive intelligence process that helps answer business questions faster.
Retail competition is increasingly shaped by the combination of price, assortment, availability, promotions, digital discovery, and customer experience. Target's 2025 results demonstrate the scale of this omnichannel environment, with $104.78 billion in total net sales and $21.1 billion in digitally originated merchandise sales. (Target Corporation)
For brands, isolated competitor checks are no longer enough. Historical and recurring monitoring provides a clearer view of how products and competitors are changing.
Target competitor analysis for brands gives businesses a structured way to identify pricing gaps, assortment opportunities, availability issues, digital shelf changes, and shifts in competitive presence.
Want to turn Target marketplace data into actionable competitive intelligence? Partner with Actowiz Metrics to build scalable product, pricing, availability, promotion, and competitor monitoring datasets tailored to your brand's retail strategy!
Expert blogs, research reports and infographics — practical, data-driven reading across e-commerce and quick-commerce.
Most fields are optional — the more you share, the better your sample.

.webp "infographics")
.webp "infographics")