BLOG




















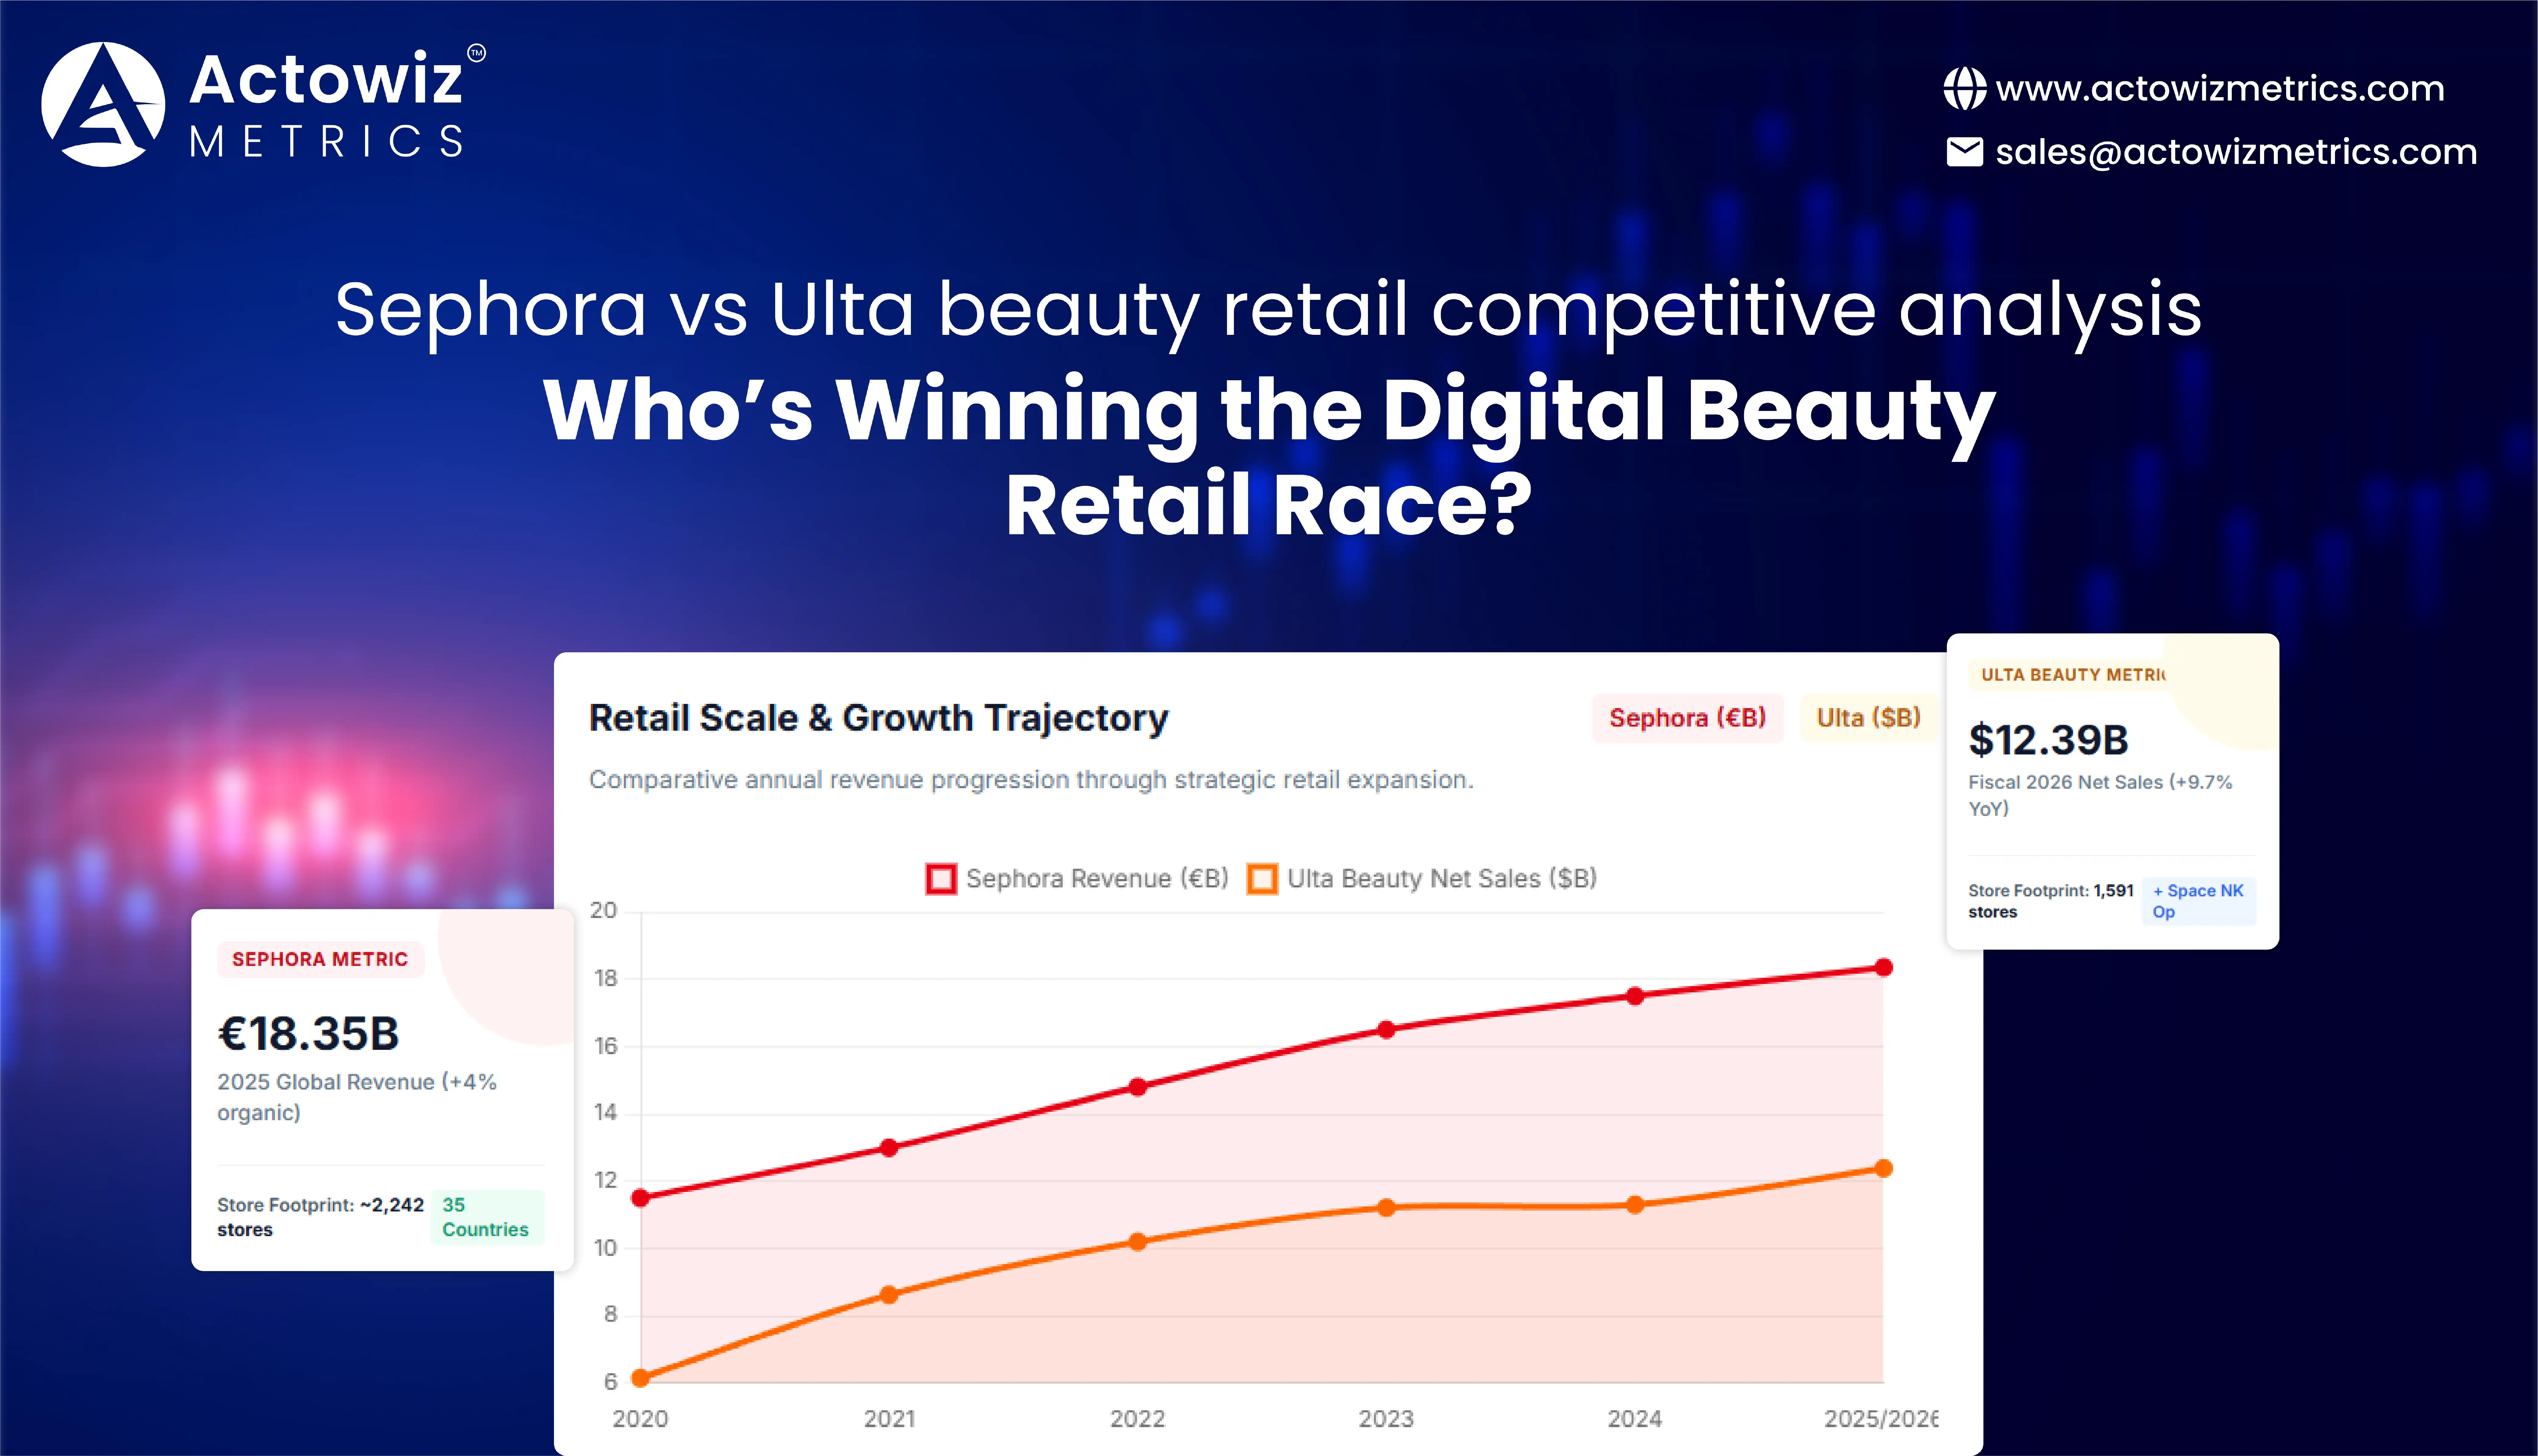
Sephora vs Ulta beauty retail competitive analysis shows that the competition is not defined by one metric. Both retailers have built substantial beauty ecosystems, but their strategies differ across store networks, product assortment, digital experiences, loyalty, omnichannel capabilities, and international reach. For brands selling through beauty retailers, understanding these differences is essential for pricing, assortment, merchandising, and digital shelf decisions.
Sephora operates as part of LVMH's Selective Retailing business, while Ulta Beauty operates as a publicly listed specialty beauty retailer. Sephora reported €18.35 billion in 2025 revenue for its business, with approximately 2,242 stores across 35 countries at year-end. LVMH said Sephora opened around 100 stores during 2025 and continued investing in its omnichannel strategy. (LVMH)
Ulta Beauty reported $12.39 billion in fiscal 2025 net sales, up 9.7% from fiscal 2024, and operated 1,591 stores as of January 31, 2026. Its business includes retail stores, salon services, and e-commerce. (Ulta Beauty)
For brands, the important question is not simply which retailer is larger. The useful question is where each retailer creates stronger competitive conditions across categories, products, prices, promotions, availability, and digital visibility.
Sephora Beauty Products Data Analytics Across Categories can help brands understand these differences at a product and category level instead of relying only on top-line retail figures.
| Competitive Dimension | Sephora | Ulta Beauty |
|---|---|---|
| Physical retail | Global store network | Large U.S.-focused network plus Space NK |
| Digital commerce | Websites, apps and omnichannel services | E-commerce integrated with stores |
| Category breadth | Prestige-focused beauty assortment | Broad beauty, wellness and services mix |
| Store services | Beauty experiences and consultations | Beauty retail plus salon services |
| International reach | 35 countries reported for 2025 | U.S. core with international expansion through Space NK |
| Data opportunity | Brand, SKU, price and digital visibility | Brand, SKU, price and digital visibility |
The result is a competitive environment where brands need granular data to understand how their products perform within each ecosystem.
Sephora vs Ulta beauty retail data analytics can help brands compare retail scale, category structure, product assortment, pricing, promotions, and customer-facing digital signals.
Sephora's 2024 annual report stated that the retailer operated 2,175 stores in 34 countries at the end of 2024, while online sales represented nearly one-quarter of its revenue. By 2025, its network had expanded to approximately 2,242 stores across 35 countries. (LVMH)
Ulta Beauty had 1,445 stores at February 1, 2025 and 1,591 stores by January 31, 2026. Its fiscal 2025 comparable sales increased 5.4%, driven by a 3.3% increase in average ticket and a 2.0% increase in transactions. (Ulta Beauty)
These numbers demonstrate different forms of scale. Sephora's network is significantly international, while Ulta's store footprint is concentrated in the United States, with Space NK adding operations in the United Kingdom and Ireland after its acquisition.
| Metric | Sephora | Ulta Beauty |
|---|---|---|
| 2025 revenue | €18.35B | $12.39B |
| Latest reported store count | ~2,242 | 1,591 |
| Geographic footprint | 35 countries | U.S. + Space NK operations |
| Digital model | E-commerce, apps, social and stores | E-commerce + stores + services |
| Key disclosed 2025 trend | Continued revenue and profit growth | 9.7% net-sales growth |
2020–2026: The competitive landscape changed substantially during this period. The pandemic accelerated digital beauty shopping, while physical stores later returned as important discovery and experience channels. Sephora emphasized omnichannel retail, personalization, technology-enabled services, and international expansion. In 2024, LVMH reported that Sephora had more than 70 million loyal customers worldwide and that online sales represented nearly one-quarter of revenue. (LVMH)
Ulta, meanwhile, continued expanding its store network and integrating retail, e-commerce, salon services, loyalty, and brand partnerships. Its fiscal 2026 annual filing shows that net sales reached $12.39 billion, compared with $11.30 billion in fiscal 2025 and $11.21 billion in fiscal 2024. (Ulta Beauty)
For brands, this six-year evolution means that competitive analysis cannot rely on store count alone. A meaningful comparison needs to connect retail footprint with product availability, digital merchandising, category depth, customer engagement, and price positioning.
Sephora Product Data Analysis enables brands to examine how products are distributed across categories such as cosmetics, skincare, fragrance, haircare, tools, and wellness. Product-level monitoring can reveal differences in assortment depth, price architecture, pack sizes, ratings, reviews, and promotional activity.
Ulta provides unusually clear public category data. In fiscal 2026, cosmetics represented approximately 38% of its net sales, skincare and wellness 24%, haircare 19%, fragrance 13%, services 4%, and other categories 2%. (Ulta Beauty)
Sephora's 2024 reporting stated that makeup remained its leading revenue category, while fragrance, haircare, and skincare also recorded strong growth. (LVMH)
| Category | Ulta FY2026 Share of Net Sales | Sephora Publicly Reported Trend |
|---|---|---|
| Cosmetics / Makeup | 38% | Leading category in 2024 |
| Skincare & wellness | 24% | Strong growth |
| Haircare | 19% | Strong growth |
| Fragrance | 13% | Strong growth |
| Services | 4% | Beauty services integrated into retail |
| Other | 2% | Remaining categories |
This difference in category mix matters to brands because the same SKU can face different competitive dynamics depending on the retailer.
2020–2026: Beauty shoppers increasingly moved between categories and channels. Skincare benefited from broader wellness and ingredient-led conversations, fragrance gained momentum through innovation and premiumization, while makeup remained central to specialty beauty retail. Sephora reported strong fragrance growth in 2024 and continued investment in exclusive and differentiated brands. (LVMH) Ulta's reported category mix shows a diversified business in which cosmetics, skincare, haircare, and fragrance collectively account for almost all merchandise and service revenue. (Ulta Beauty)
For brands, historical product data makes category changes easier to identify. A company can monitor whether competitors are introducing more products within a category, changing pack sizes, entering adjacent categories, or increasing promotional frequency.
A useful product dataset should therefore capture SKU identifiers, product names, brands, categories, variants, sizes, prices, discounts, ratings, reviews, availability, and product URLs where accessible.
The actionable insight is to compare category structure and SKU depth, not just the number of brands carried.
Ulta Beauty Competitor Analysis allows brands to compare assortment, pricing, promotions, product availability, ratings, reviews, and digital merchandising against competing beauty retailers and brands. In a broader Sephora vs Ulta beauty retail competitive analysis, these signals help explain how each retailer creates different opportunities for beauty brands.
Ulta's fiscal 2026 results provide a useful benchmark. Net sales increased 9.7% to $12.39 billion, while comparable sales increased 5.4%. The company ended the year with 1,591 stores. (Ulta Beauty)
Sephora also reported strong 2025 performance. LVMH said Sephora generated €18.35 billion in revenue, up 4% on an organic basis, while profit from recurring operations increased 28%. LVMH also reported approximately 100 new Sephora store openings during 2025. (LVMH)
| Competitive Signal | What Brands Can Compare |
|---|---|
| SKU count | Assortment depth |
| Price | Retailer positioning |
| Discount | Promotional intensity |
| Product launches | Innovation activity |
| Availability | Inventory execution |
| Reviews | Customer feedback |
| Ratings | Product perception |
| Search visibility | Digital discoverability |
| Exclusive products | Differentiation |
2020–2026: Both retailers strengthened their positions through different combinations of physical retail and digital engagement. Sephora expanded its international footprint, including its UK operation launched in 2021, while continuing its Kohl's partnership in the United States. (LVMH) Ulta expanded its store network and completed its acquisition of Space NK, giving it a larger international presence. Ulta's fiscal 2026 filing states that 1,505 Ulta Beauty stores operated across all 50 U.S. states, alongside 84 Space NK stores in the U.K. and two in Ireland. (Ulta Beauty)
For brand teams, the implication is that competitive positioning should be measured across multiple channels. A product may have strong visibility at one retailer but weaker availability or pricing elsewhere.
The most useful competitive dataset therefore connects product, retailer, category, price, promotion, availability, and historical observations.
Sephora vs Ulta e-commerce data scraping can provide structured information about digital catalogs, product prices, availability, promotions, ratings, reviews, search results, and assortment changes. For beauty brands, this data can help identify digital shelf gaps that are difficult to detect through occasional manual checks.
Sephora's digital scale is substantial. LVMH reported in 2024 that online sales represented nearly one-quarter of Sephora's revenue and that the company operated websites and mobile apps alongside its physical stores. (LVMH)
Ulta also treats e-commerce as part of its single operating segment alongside stores and salon services. Its fiscal 2026 annual report states that net sales include retail-store and e-commerce merchandise sales. (Ulta Beauty)
| E-Commerce Data Point | Business Use |
|---|---|
| Product name | Catalog identification |
| SKU | Product-level matching |
| Brand | Competitive grouping |
| Category | Market segmentation |
| Price | Pricing comparison |
| Discount | Promotion monitoring |
| Availability | Stock visibility |
| Ratings | Customer sentiment signal |
| Reviews | Product feedback |
| Images/content | Digital merchandising |
| Product URL | Page-level monitoring |
2020–2026: Digital beauty retail evolved from basic online catalogs into highly interactive shopping experiences. Sephora's Store of the Future in Shanghai, launched in 2023, incorporated AI recommendations, skin-tone analysis, interactive terminals, RFID-enabled product information, reviews, mobile checkout, and other digital touchpoints. (LVMH)
At the same time, Ulta's operating model increasingly integrated e-commerce with its store network. Its filings explicitly include e-commerce within the company's comparable-sales framework. (Ulta Beauty)
This creates a strong need for historical digital data. Brands can use recurring collection to identify newly launched SKUs, discontinued products, price changes, availability shifts, promotion changes, and content updates.
For data teams, the objective should be structured, repeatable collection rather than isolated scraping exercises. The resulting dataset can feed dashboards, competitive alerts, pricing models, assortment analysis, and category intelligence.
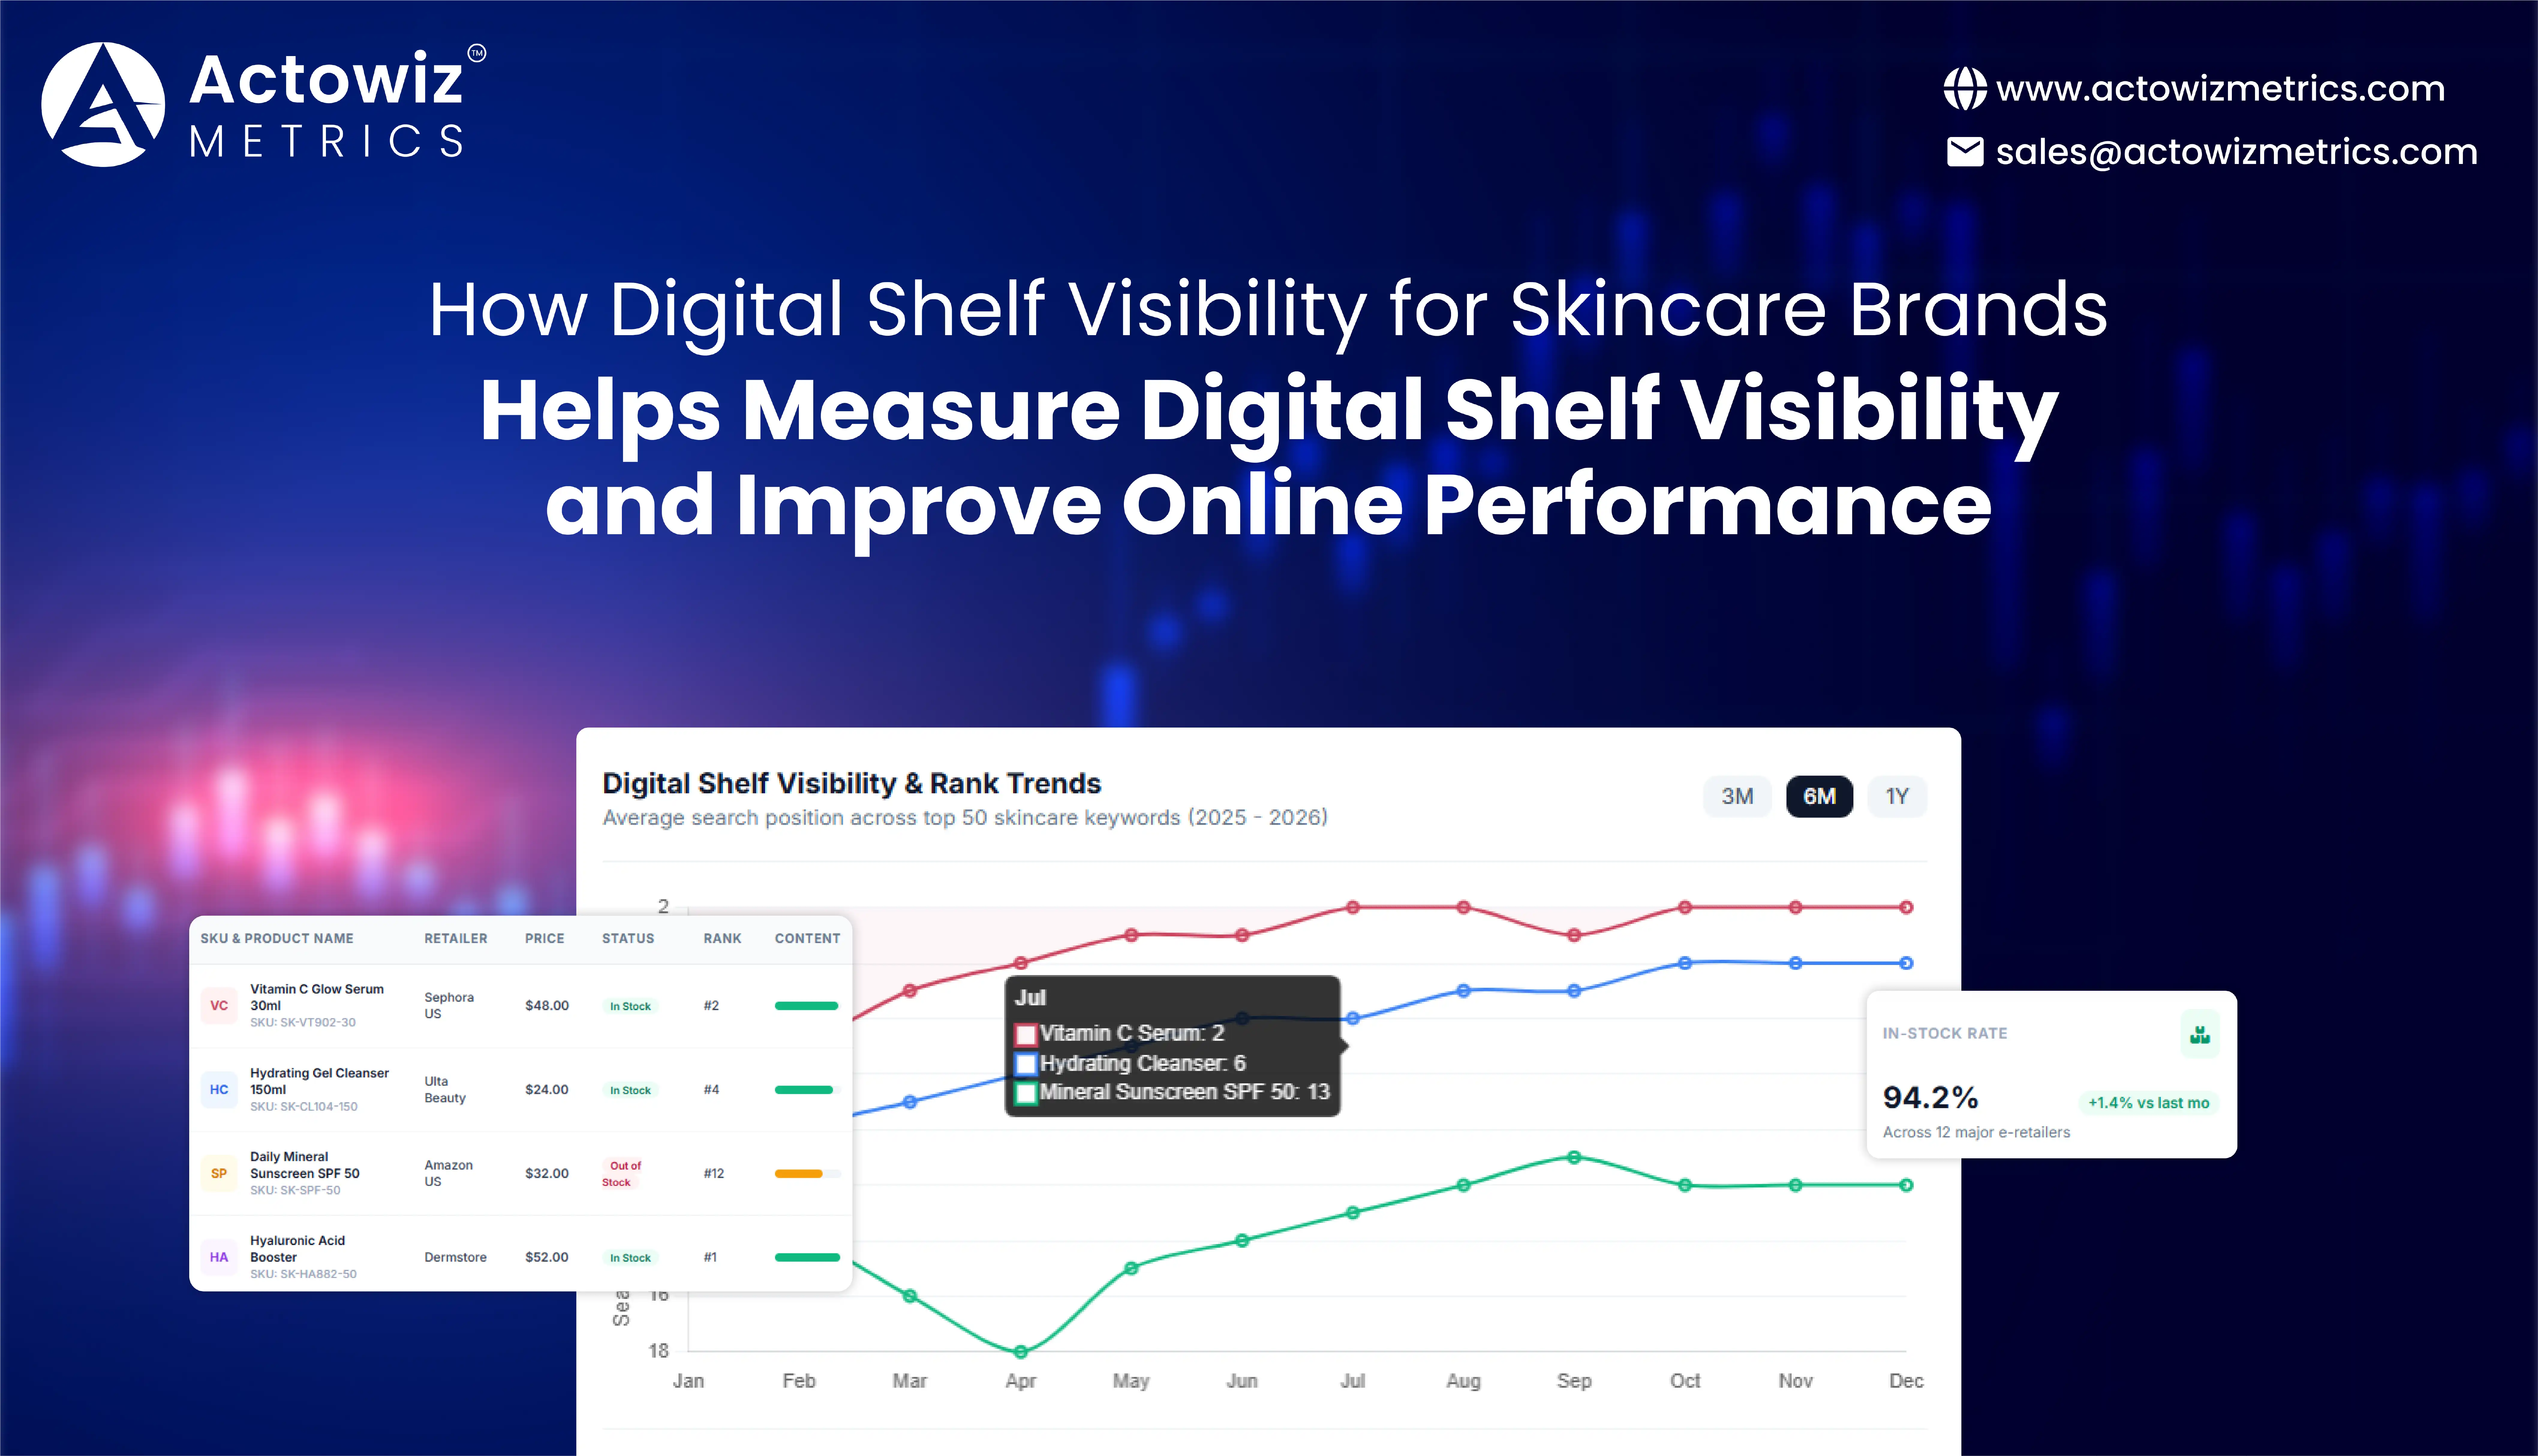
Sephora vs Ulta digital shelf analysis helps brands examine how their products are represented and discovered online. The analysis can include search placement, product titles, images, descriptions, ratings, reviews, availability, pricing, promotional badges, and competing products.
The importance of digital merchandising has increased as both retailers invest in omnichannel experiences. Sephora reported that online sales represented nearly one-quarter of revenue in 2024 and continued investing in its web and app experience. (LVMH)
Ulta's fiscal 2026 filing confirms that e-commerce is integrated into its core operating model alongside stores and salons. (Ulta Beauty)
| Digital Shelf Metric | Why Brands Should Track It |
|---|---|
| Search visibility | Measures product discoverability |
| Product content | Supports shopper understanding |
| Images | Influences visual merchandising |
| Ratings | Provides customer validation |
| Reviews | Identifies consumer feedback |
| Availability | Determines purchase accessibility |
| Price | Establishes competitive positioning |
| Promotions | Highlights current offers |
| Assortment | Shows category presence |
2020–2026: Digital shelf management became increasingly sophisticated. Sephora's technology investments demonstrate how beauty retail has moved toward personalization and interactive discovery. Its Shanghai Store of the Future incorporated AI-powered recommendations, skin analysis, product information, reviews, and mobile checkout. (LVMH)
Ulta's expansion also reflects the growing importance of an integrated physical and digital experience. The company operated 1,591 stores by January 2026 while maintaining e-commerce as part of its single reportable segment. (Ulta Beauty)
For brands, the digital shelf is therefore not merely a product listing. It is a competitive environment where content quality, discoverability, availability, price, reviews, and promotions interact.
A practical monitoring framework should compare the same products across both retailers. This makes it possible to identify where product content differs, where prices diverge, where competitors receive stronger visibility, and where availability creates an advantage.
The actionable insight is to treat digital shelf execution as a measurable component of brand performance rather than a static catalog responsibility.
Beauty analytics combines product, pricing, assortment, availability, promotion, review, and digital shelf data to create a broader view of competitive performance. When connected with Sephora vs Ulta beauty retail competitive analysis, these datasets can help brands understand where opportunities and risks are emerging.
The two retailers have demonstrated continued growth and investment. Sephora's 2025 revenue reached €18.35 billion, while Ulta Beauty's fiscal 2026 net sales reached $12.39 billion. These figures use different currencies, fiscal calendars, corporate structures, and reporting scopes, so they should not be treated as a direct like-for-like performance ranking. (LVMH)
| Analytics Area | Question It Answers |
|---|---|
| Product analytics | Which SKUs are gaining or losing visibility? |
| Pricing analytics | Where are price differences emerging? |
| Promotion analytics | Which offers are changing competitive conditions? |
| Availability analytics | Which products are consistently purchasable? |
| Assortment analytics | Which categories are expanding? |
| Review analytics | What are customers saying? |
| Digital analytics | Which products are easiest to discover? |
| Historical analytics | Which changes are temporary or persistent? |
2020–2026: The beauty retail market became increasingly omnichannel, data-driven, and experience-focused. Sephora expanded from approximately 2,175 stores in 34 countries at the end of 2024 to approximately 2,242 stores in 35 countries at the end of 2025. (LVMH) Ulta increased its store count from 1,385 at the end of fiscal 2024 to 1,445 in fiscal 2025 and 1,591 in fiscal 2026, including its Space NK operations. (Ulta Beauty)
These developments show why historical competitive datasets matter. Retail footprint, assortment, digital capabilities, and international reach can all change over time.
For beauty brands, the key is to connect these changes to SKU-level observations. A retailer may expand its network while a specific product loses availability. A competitor may launch a new product while reducing promotional activity on older SKUs. A price difference may appear significant until pack size and promotion timing are considered.
The most valuable intelligence is therefore contextual. Brands should combine multiple signals before making decisions about pricing, assortment, distribution, or digital merchandising.
Actowiz Metrics can help beauty brands convert retailer and competitor information into structured, recurring datasets. The goal is to make product, price, assortment, availability, promotion, and digital shelf information easier to monitor and analyze at scale.
E-commerce & D2C analytics can connect marketplace and retailer observations with broader brand performance requirements. For beauty companies, this can include tracking products across categories, comparing competitor prices, monitoring promotions, identifying assortment changes, and analyzing digital shelf conditions.
A scalable monitoring framework can include:
| Data Layer | Example Fields |
|---|---|
| Product | SKU, product name, brand, category |
| Variant | Shade, size, format, pack |
| Pricing | Current price, previous price, discount |
| Availability | In-stock/out-of-stock |
| Promotions | Offers, coupons, promotional messaging |
| Reviews | Rating, review count, review text where accessible |
| Digital shelf | Images, descriptions, search visibility |
| Competitors | Comparable products and brands |
| Historical data | Changes across monitoring periods |
Actowiz Metrics can normalize and organize collected information into analytics-ready datasets. This makes it easier for category managers to compare products consistently across retailers.
For example, a beauty brand could monitor a foundation category across both retailers and identify differences in shade availability, product pricing, promotions, ratings, reviews, and content. A skincare company could track new launches and determine whether competing brands are expanding into adjacent subcategories.
The value is not simply data volume. The objective is to create a reliable evidence base for decisions involving pricing, product strategy, assortment, promotions, and digital merchandising.
The digital beauty retail landscape is not defined by a single metric. Sephora combines a large international footprint, prestige-focused positioning, omnichannel investment, and technology-enabled experiences. Ulta combines a substantial U.S. store network with e-commerce, salon services, loyalty, broad beauty categories, and its expanding Space NK presence. (LVMH)
The latest reported figures also show continued momentum at both companies. Sephora generated €18.35 billion in 2025 revenue and expanded to approximately 2,242 stores across 35 countries. Ulta generated $12.39 billion in fiscal 2026 net sales and operated 1,591 stores worldwide, including Space NK locations. (LVMH)
For brands, the practical question is less about declaring a universal winner and more about understanding where each retailer creates specific opportunities or competitive pressures.
Digital shelf analytics can help brands monitor these differences at the SKU, category, retailer, and time-series levels. With structured data, teams can compare pricing, assortment, availability, promotions, reviews, search visibility, and product content rather than relying on isolated observations.
Want to turn Sephora and Ulta marketplace data into actionable beauty intelligence? Partner with Actowiz Metrics to build scalable product, pricing, assortment, competitor, and digital shelf monitoring solutions tailored to your brand!
Expert blogs, research reports and infographics — practical, data-driven reading across e-commerce and quick-commerce.
Most fields are optional — the more you share, the better your sample.

.webp "infographics")
.webp "infographics")