BLOG




















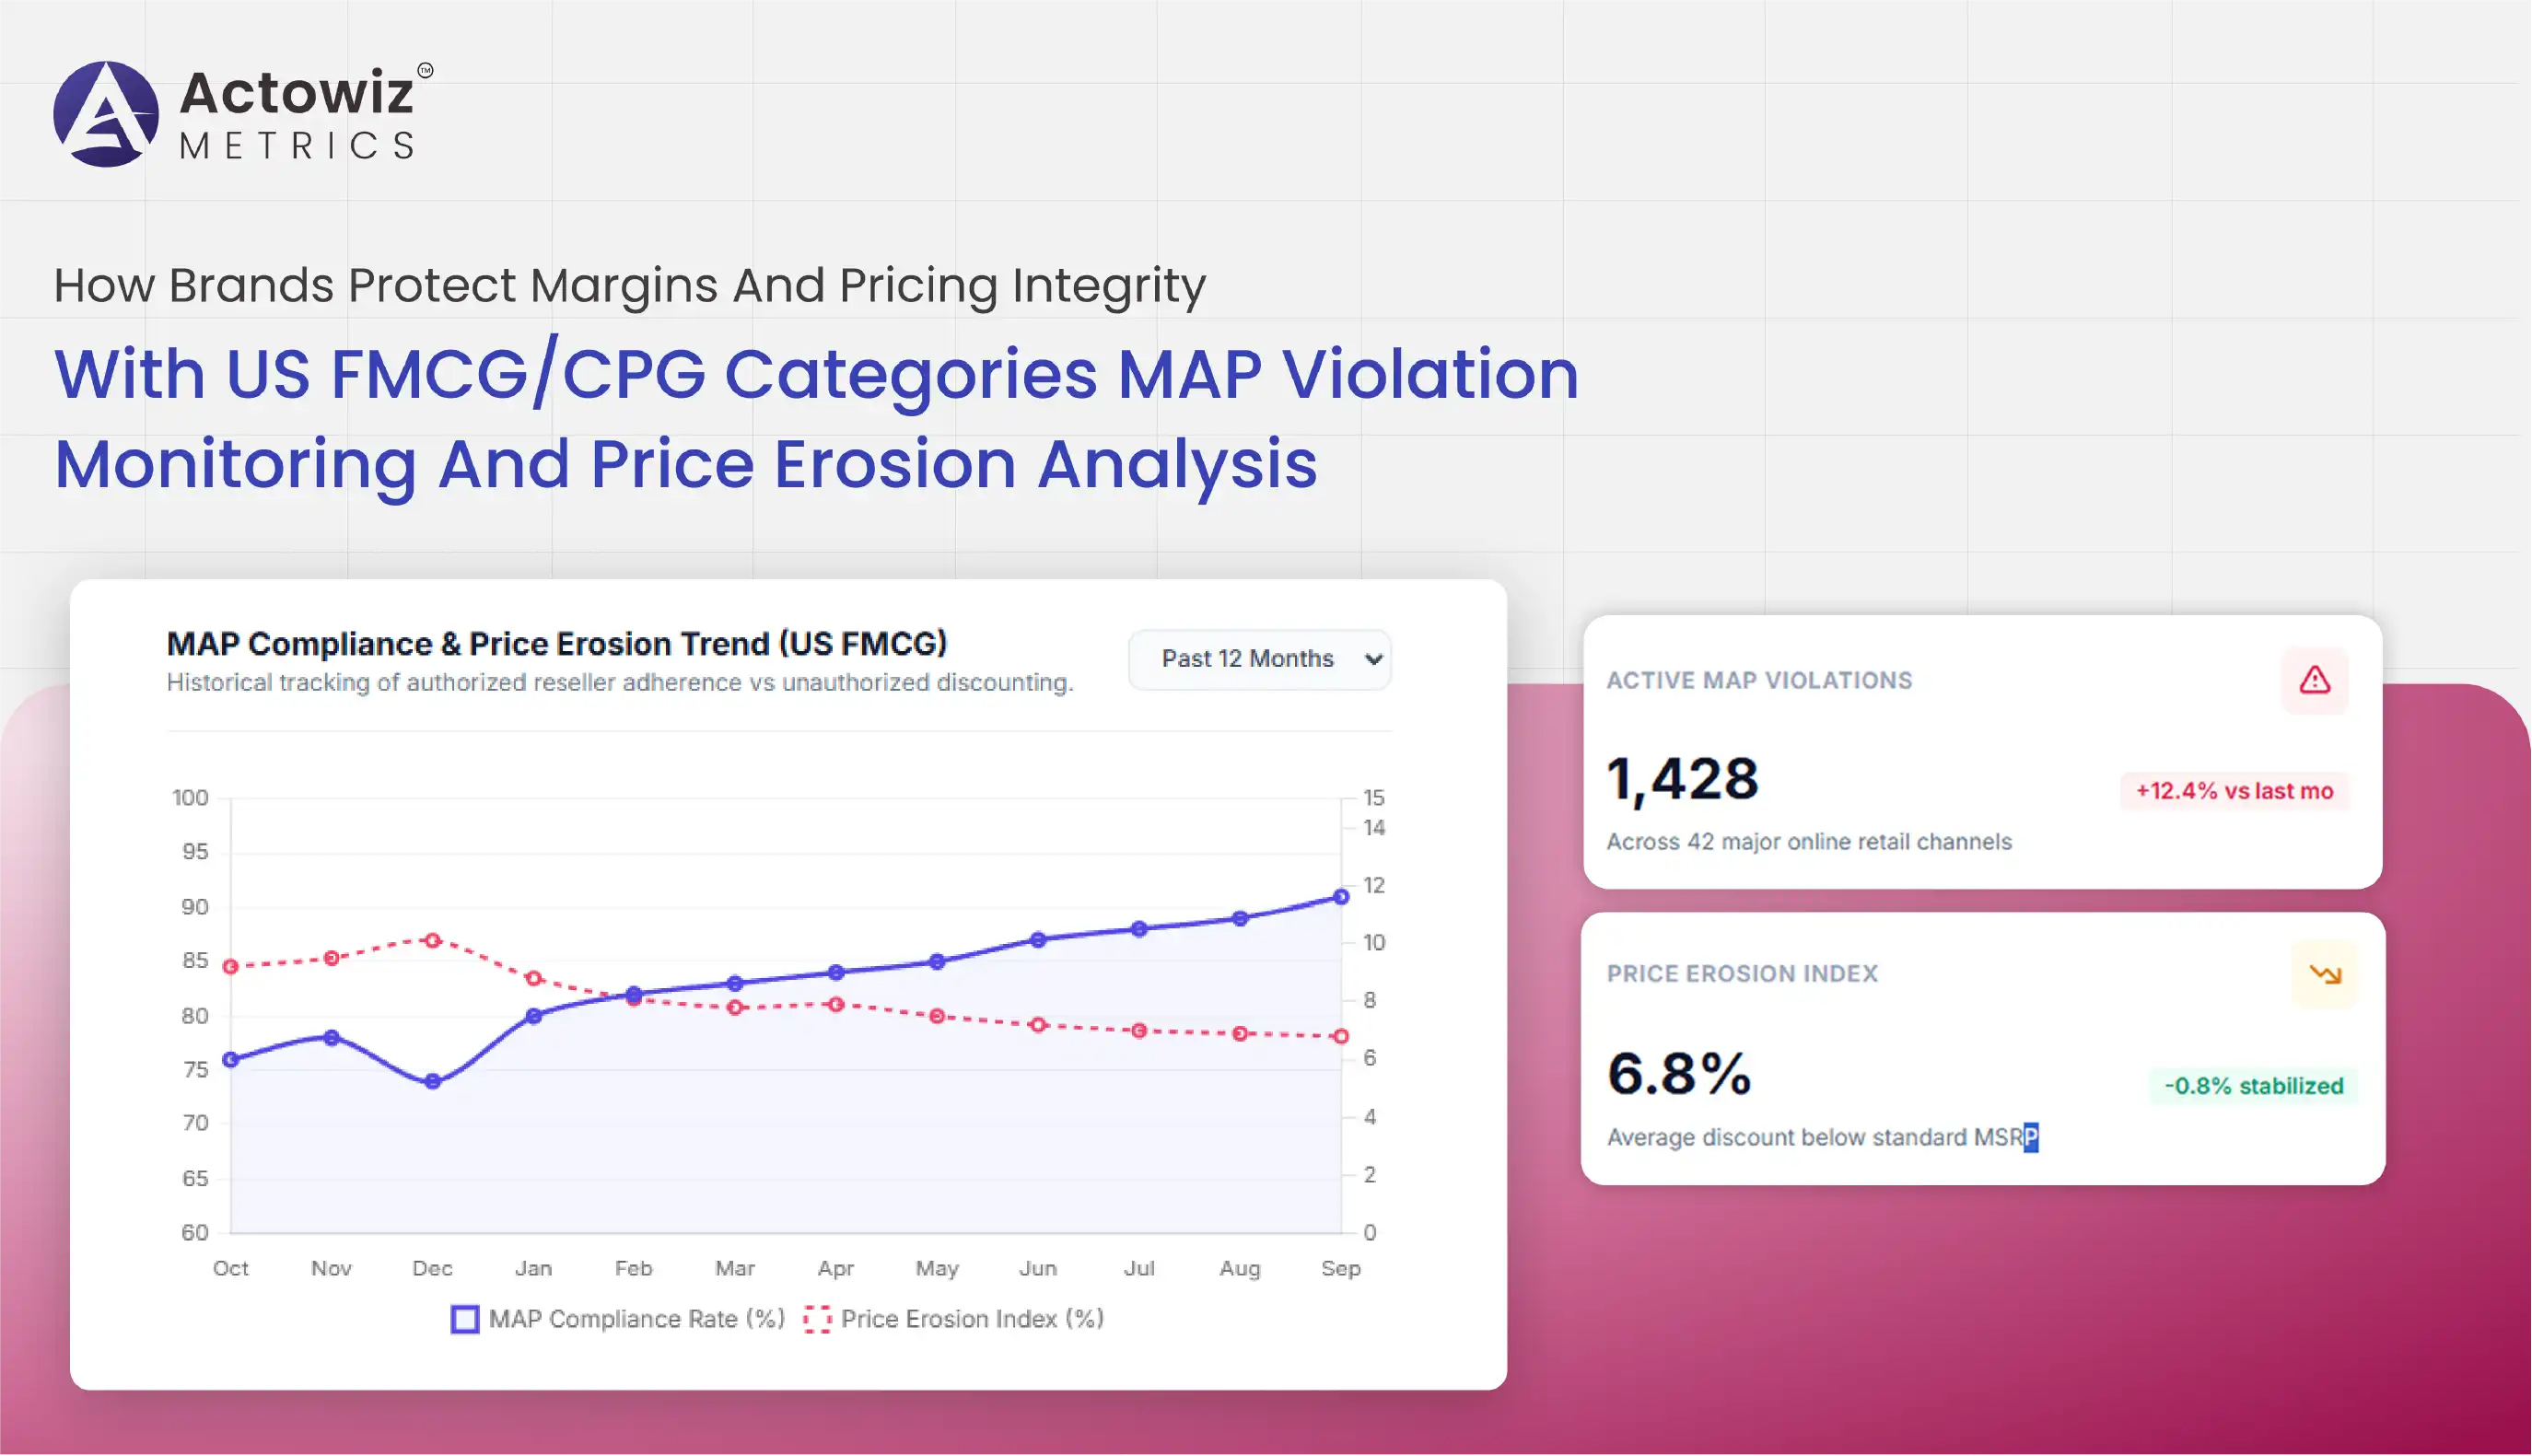
The US FMCG and CPG market has become increasingly competitive as brands sell through a combination of marketplaces, grocery websites, retailer-owned e-commerce stores, and direct-to-consumer channels. While this expanded digital presence creates opportunities for revenue growth, it also makes pricing consistency more difficult to maintain. Unauthorized discounts, inconsistent advertised prices, third-party seller activity, and frequent promotional changes can gradually weaken a brand's pricing position and margins.
US FMCG/CPG Categories MAP violation monitoring and price erosion analysis gives brands a structured way to identify where advertised prices diverge from approved pricing policies and where repeated discounting may be affecting revenue performance. Instead of relying on occasional manual checks, brands can use recurring digital data collection to observe products, sellers, prices, promotions, availability, and marketplace behavior across online channels.
At the same time, Grocery and FMCG (CPG) digital shelf analytics enables businesses to examine the broader digital shopping environment. Pricing is only one component of digital shelf performance; product availability, assortment, search visibility, promotions, ratings, reviews, and competitive positioning can also influence how consumers perceive and purchase products.
This research report examines how brands can use structured pricing and digital shelf data to understand price erosion, identify potential MAP violations, improve retailer compliance visibility, and protect pricing integrity across the US FMCG/CPG ecosystem.
As FMCG purchasing continues to move between physical and digital channels, brands have greater difficulty maintaining a consistent view of retail pricing. Products may appear across national retailers, regional grocery chains, marketplaces, specialty websites, and third-party seller listings. Each channel may have different promotions, seller arrangements, and pricing behaviors.
CPG brand price erosion monitoring across US online retailers helps businesses identify recurring price reductions and compare advertised prices against reference prices or approved pricing thresholds. This allows pricing teams to distinguish isolated promotions from persistent price deterioration.
| Indicator | Business Relevance |
|---|---|
| Online price variance | Highlights differences between retailers |
| Discount frequency | Shows how often products are promoted |
| Minimum advertised price gaps | Identifies potential policy exceptions |
| Seller-level price changes | Helps isolate problematic sellers |
| Product availability | Adds context to pricing movements |
| Historical price records | Enables trend and erosion analysis |
From 2020 to 2026, the evolution of digital FMCG commerce has increased the volume and frequency of pricing data available to brands. In 2020, many organizations were still dependent on spreadsheets, manual retailer checks, and periodic competitive reviews. As e-commerce adoption accelerated, product pages became more dynamic, with prices changing in response to promotions, competition, demand, inventory, and seller activity. Between 2021 and 2022, the need for more frequent monitoring became increasingly important as consumers compared prices across multiple online channels before purchasing. From 2023 onward, automated data collection and structured pricing databases enabled brands to move from occasional snapshots toward recurring monitoring. By 2024 and 2025, pricing teams increasingly needed historical datasets to identify patterns rather than simply record individual violations. In 2026, the emphasis is increasingly on connecting pricing information with digital shelf, assortment, availability, seller, and promotional signals. This progression makes historical price tracking particularly valuable because a single low-price observation does not necessarily indicate sustained price erosion. Repeated observations across retailers and sellers can reveal whether discounting is temporary, promotional, competitive, or persistent.
MAP compliance programs depend on reliable, comparable, and frequently refreshed information. Brands cannot effectively investigate pricing exceptions if retailer data is incomplete, inconsistent, or captured too infrequently. A structured data collection framework creates a common dataset that can be analyzed by SKU, retailer, seller, category, geography, and date.
US FMCG retailer MAP compliance data collection services can support this process by collecting product-level information from selected retailer websites and marketplaces. Relevant fields may include product name, SKU, brand, category, listed price, promotional price, discount, seller, availability, product URL, and timestamp.
| Data Attribute | Purpose |
|---|---|
| SKU/Product ID | Establishes product-level tracking |
| Brand | Enables brand-specific analysis |
| Retailer | Identifies channel-level behavior |
| Seller | Supports seller-level investigations |
| Regular price | Establishes pricing reference |
| Advertised price | Enables compliance comparison |
| Promotion/discount | Adds promotional context |
| Timestamp | Creates historical evidence |
| Product URL | Supports validation |
| Availability | Helps explain price changes |
Between 2020 and 2026, data collection for online retail pricing has evolved from small-scale manual observation into more structured, automated pipelines. During 2020, the rapid growth of digital shopping highlighted the limitations of manual monitoring because product information could change faster than teams could record it. In 2021, retailers expanded online assortments and promotional activity, increasing the number of pages and products that brands needed to review. In 2022 and 2023, businesses increasingly required normalized datasets that could compare equivalent products across different websites. By 2024, recurring data collection became more valuable for organizations seeking historical evidence of pricing behavior rather than isolated observations. In 2025 and 2026, the focus has shifted toward connecting retailer data with broader pricing intelligence and digital shelf measurement. A reliable monitoring framework should therefore capture consistent fields, normalize product identifiers, distinguish regular and promotional prices, and preserve historical observations. Data validation is equally important because product pages can change layouts, sellers can change, and promotions can expire. Consistency across collection cycles gives brands a stronger foundation for identifying meaningful pricing deviations and evaluating their commercial impact.
A single low advertised price may not necessarily represent a serious commercial issue. It could result from a temporary promotion, clearance event, coupon, bundle, or retailer-specific campaign. The greater challenge is determining whether a pricing deviation is isolated or part of a sustained pattern.
Brands can monitor MAP violations and price erosion across FMCG retailers by combining current observations with historical price records. This creates a more complete picture of how individual products behave over time.
| Metric | What It Reveals |
|---|---|
| Violation frequency | Repeated pricing exceptions |
| Average price gap | Magnitude of deviation |
| Lowest observed price | Downside pricing exposure |
| Days below threshold | Duration of potential erosion |
| Retailer violation rate | Channel-specific compliance |
| Seller violation rate | Potential seller-level issues |
| Price recovery time | Speed of return to reference price |
From 2020 to 2026, the analysis of pricing disruption has increasingly moved toward pattern recognition. In 2020 and 2021, brands frequently relied on individual price checks to identify obvious deviations. However, increasing online competition demonstrated that the frequency, duration, and magnitude of price changes could be as important as the lowest price itself. In 2022, historical datasets became more useful for identifying recurring discount behavior across specific retailers or sellers. In 2023, brands could increasingly segment pricing events by product category, retailer, and seller, helping teams determine where problems were concentrated. By 2024, businesses could combine price observations with promotional information and availability data to improve interpretation. In 2025 and 2026, a mature monitoring program can examine multiple dimensions simultaneously, including price deviation, duration, frequency, retailer concentration, and product-level exposure. This approach helps separate isolated events from recurring patterns. It also allows pricing teams to prioritize investigation based on measurable business signals instead of reviewing every price change manually. Historical records are particularly useful for understanding whether an observed deviation represents a short-lived promotion or a longer-term shift in the product's online price position.
MAP monitoring becomes more valuable when brands understand the competitive environment surrounding each product. A retailer may advertise a lower price because of aggressive competition, excess inventory, a seasonal event, or a broader category promotion. Competitive intelligence provides context for interpreting pricing movements.
CPG minimum advertised price tracking and competitive pricing intelligence can help brands compare approved pricing structures with observed retailer prices while also examining competitor positioning.
| Metric | Application |
|---|---|
| Brand price index | Measures relative price positioning |
| Competitor price gap | Shows competitive difference |
| Discount depth | Measures promotional intensity |
| Price spread | Shows retailer variation |
| Promotion frequency | Identifies recurring campaigns |
| Category price movement | Provides market context |
Between 2020 and 2026, competitive pricing intelligence has become increasingly interconnected with digital retail monitoring. In 2020, brands often assessed competitors through periodic manual research, creating limited historical visibility. During 2021 and 2022, increased digital competition encouraged more frequent comparison of product prices and promotions. By 2023, structured competitor datasets allowed businesses to evaluate price gaps at SKU and category levels. In 2024, more sophisticated monitoring programs began connecting competitor prices with retailer behavior and promotional activity. During 2025 and 2026, brands can use historical price datasets to understand whether price changes are isolated to one retailer or reflect broader market movements. This distinction matters when evaluating potential MAP issues because a price deviation should be considered within its commercial context. For example, widespread category discounting may indicate a market-level promotion, while a recurring deviation from one seller may warrant a different type of review. Competitive intelligence also helps pricing teams understand whether protecting a price point could affect competitiveness. Combining brand pricing records with competitor observations gives businesses a broader perspective on both compliance and market positioning.
Retailer compliance monitoring becomes challenging when a brand has hundreds or thousands of SKUs distributed across numerous digital channels. Manual checks can consume significant time while still providing only a limited snapshot of pricing behavior.
Retailer MAP compliance monitoring creates a recurring process for observing advertised prices and identifying exceptions across selected online channels.
| Monitoring Dimension | Example Insight |
|---|---|
| Retailer | Which channels show deviations? |
| Seller | Which sellers require review? |
| SKU | Which products are affected? |
| Category | Where are violations concentrated? |
| Time period | Are issues recurring? |
| Price gap | How significant is the deviation? |
| Frequency | How often does it occur? |
From 2020 to 2026, retailer monitoring has progressed toward broader channel coverage and more frequent data refreshes. In 2020, businesses often focused on a limited number of high-volume retail websites. As online FMCG adoption expanded through 2021 and 2022, the number of relevant digital channels increased, making manual monitoring increasingly difficult to scale. By 2023, automated collection allowed organizations to monitor larger SKU inventories across multiple retailers. In 2024, historical compliance datasets became useful for identifying retailers or sellers with recurring pricing exceptions. By 2025, businesses could segment monitoring by brand, category, retailer, seller, geography, and product. In 2026, the emphasis is increasingly on creating an integrated monitoring framework that connects pricing compliance with other digital shelf indicators. A retailer monitoring system should also maintain clear timestamps and source URLs so that individual observations can be reviewed when needed. Normalization is essential because different retailers may display prices, discounts, pack sizes, and product identifiers differently. By standardizing these attributes, brands can make retailer comparisons more meaningful and reduce the time required for manual data preparation.
Pricing is only one part of the online shopping experience. A product may have an appropriate advertised price but still underperform because it is unavailable, poorly positioned, missing from important categories, or surrounded by stronger competitor offers.
Digital shelf analytics enables brands to bring pricing, availability, assortment, promotions, content, ratings, reviews, and competitive information into a broader performance framework.
| Indicator | Business Question |
|---|---|
| Price | Is the product competitively positioned? |
| Availability | Can shoppers purchase it? |
| Assortment | Is the complete range represented? |
| Promotions | How aggressively is the category discounted? |
| Ratings | How do shoppers perceive the product? |
| Reviews | What customer feedback patterns exist? |
| Search visibility | Can consumers easily discover the product? |
| Competitor presence | Which competing products are visible? |
Between 2020 and 2026, digital shelf analysis has expanded from basic product availability checks into a broader form of online retail intelligence. During 2020, businesses primarily focused on maintaining online product availability as consumer purchasing behavior changed rapidly. In 2021 and 2022, brands increasingly recognized that visibility, content, pricing, and assortment could influence online performance together. By 2023, digital shelf datasets could be used to compare products across retailers and identify gaps in online execution. In 2024, pricing information increasingly became part of broader digital shelf measurement, allowing teams to connect price movements with availability and promotional activity. During 2025 and 2026, businesses can use recurring datasets to create more detailed views of retailer execution and category performance. This broader perspective is valuable for FMCG and CPG brands because price erosion may occur alongside other issues, such as inconsistent product content or reduced availability. A comprehensive digital shelf approach therefore helps brands investigate pricing concerns while also understanding the surrounding retail environment. When structured correctly, these datasets can support dashboards, alerts, retailer reviews, category analysis, and recurring business reports.
Actowiz Metrics helps brands convert complex online retail information into structured datasets that support pricing, competitive, and digital shelf intelligence. Its approach can combine automated data collection, product-level monitoring, normalization, validation, historical tracking, and analytics-ready delivery.
Brands operating across the US FMCG/CPG market may need to monitor thousands of SKUs across multiple retailers and sellers. A scalable data framework can expand monitoring coverage without requiring teams to manually review every product page.
Competitor intelligence can help businesses understand how their products compare with competing brands across retailers, categories, and pricing environments. Historical datasets also make it possible to analyze changes over time rather than relying solely on current snapshots.
Historical price records provide the foundation for identifying repeated price deviations, promotional patterns, and potential erosion. Actowiz Metrics can structure recurring observations to support trend analysis and reporting.
Brands can organize collected information by retailer, seller, SKU, category, and time period. This helps pricing and sales teams identify areas that require further review and supports more focused retailer discussions.
A broader US FMCG/CPG Categories MAP violation monitoring and price erosion analysis framework can combine pricing observations with competitor, availability, promotional, and digital shelf data. This gives brands a more comprehensive view of online retail conditions.
Maintaining pricing integrity across the US FMCG and CPG landscape requires more than occasional price checks. The expansion of online retailers, marketplaces, third-party sellers, and promotional activity has created a constantly changing pricing environment. Brands need reliable historical datasets to identify recurring deviations, understand price erosion, and distinguish isolated promotions from persistent pricing patterns.
The combination of retailer-level monitoring, competitive pricing intelligence, historical tracking, and digital shelf measurement can provide brands with a stronger foundation for investigating pricing exceptions and protecting commercial performance. Structured data also enables teams to prioritize issues by retailer, seller, SKU, category, frequency, and price deviation rather than relying on manual reviews.
For brands seeking to strengthen their pricing visibility and online retail intelligence, US FMCG/CPG Categories MAP violation monitoring and price erosion analysis can provide the data foundation required to track market changes, identify potential compliance issues, and understand pricing behavior across digital channels.
Want to strengthen your FMCG/CPG pricing intelligence? Partner with Actowiz Metrics to build scalable retail data collection and monitoring solutions tailored to your products, retailers, and competitive landscape!
Expert blogs, research reports and infographics — practical, data-driven reading across e-commerce and quick-commerce.
Most fields are optional — the more you share, the better your sample.
.webp "infographics")
.webp "infographics")