BLOG
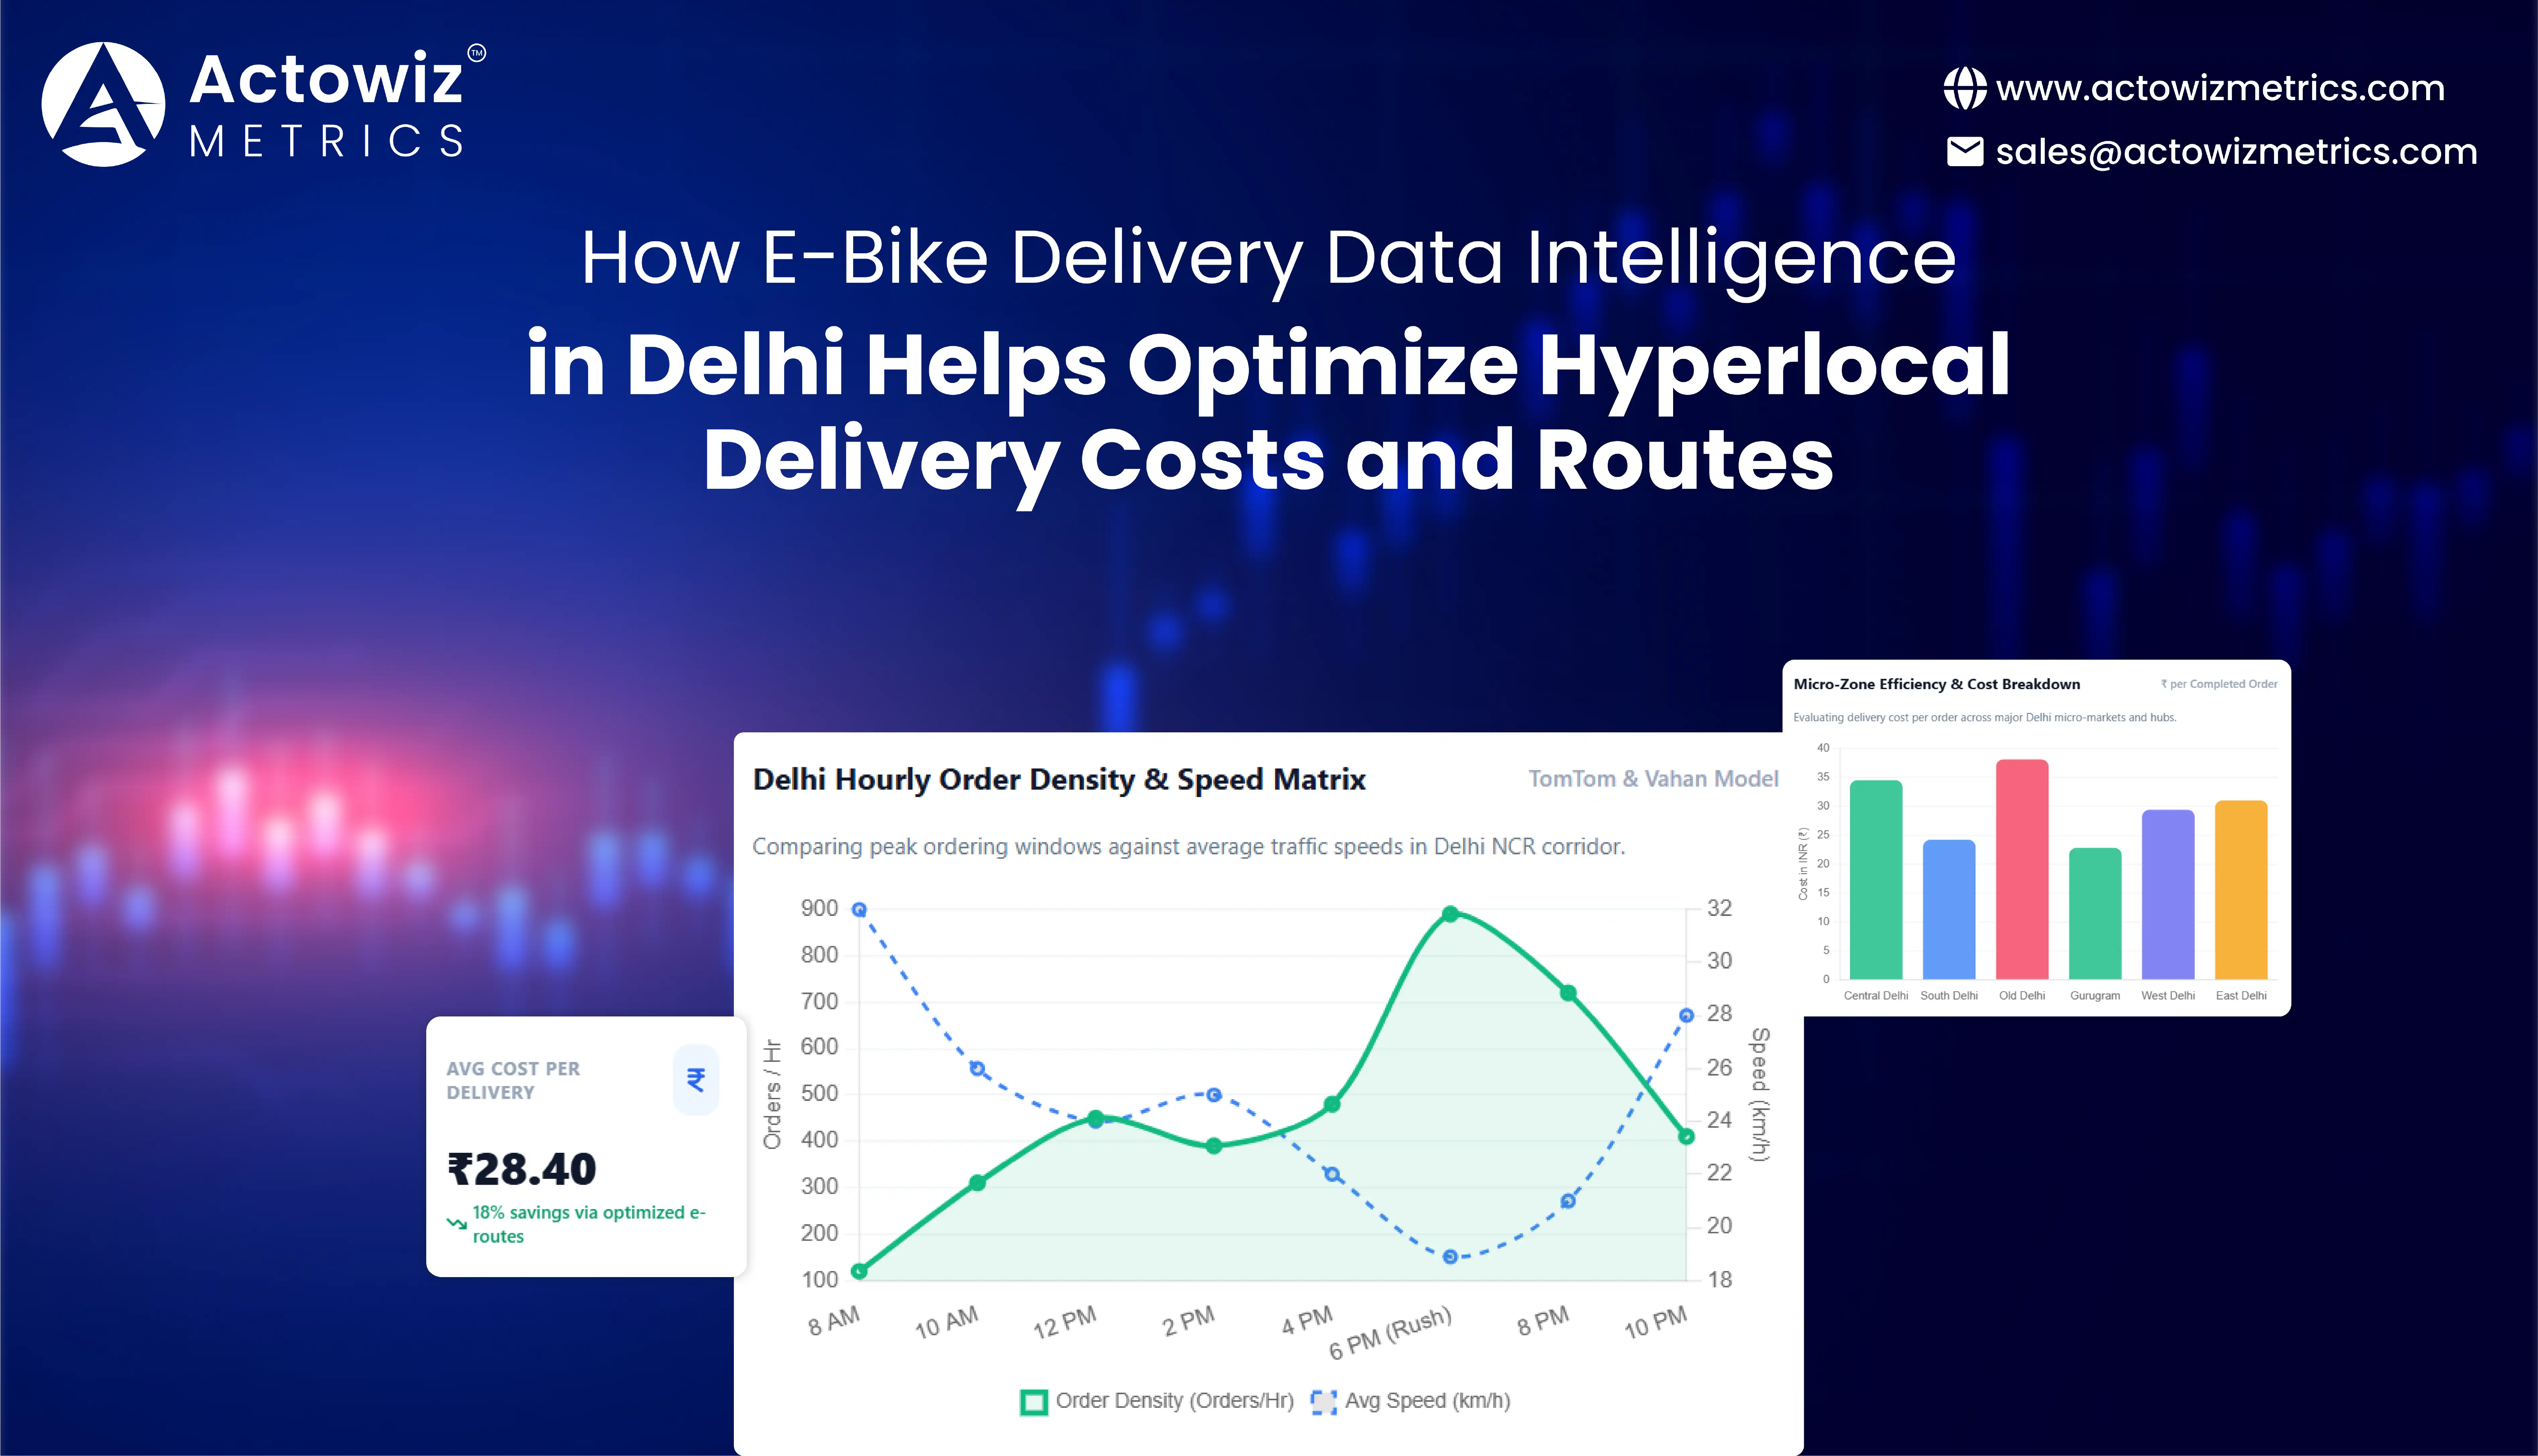




















Delhi's hyperlocal commerce environment is shaped by dense residential clusters, commercial districts, traffic bottlenecks, short delivery windows, and rapidly changing consumer demand. For grocery retailers, pharmacies, restaurants, D2C brands, dark-store operators, and local marketplaces, the challenge is no longer simply getting an order to a customer. The bigger challenge is deciding where demand will occur, which vehicle should serve it, when the order should be dispatched, and which route can meet the promised delivery window at an efficient cost.
This is where E-Bike Delivery Data Intelligence in Delhi becomes useful. It combines delivery records, location information, order timestamps, traffic conditions, SKU demand, vehicle utilization, and pincode-level activity into a structured intelligence layer.
The need is especially relevant because Delhi recorded an average congestion level of 60.2% in 2025, while a 10-km trip took an average of 24 minutes and 28 seconds. During evening rush hour, the average speed was only 18.9 km/h. (TomTom)
For local businesses, these conditions make route planning based only on static maps insufficient. A delivery route that looks efficient at 2 PM can become inefficient at 7 PM. Similarly, a rider assigned to a low-demand zone may travel more kilometers per order than a rider serving a dense cluster.
Data intelligence provides a way to identify these differences and continuously adjust delivery operations.
A practical delivery intelligence system can combine:
The objective is not simply to make routes shorter. It is to make the overall delivery network more productive per rider, vehicle, kilometer, and operating hour.
Delhi's road conditions create a strong case for granular delivery planning. TomTom's 2025 data shows that New Delhi experienced 104 hours of traffic-related time loss during rush hours, while the average rush-hour speed was substantially lower than unrestricted road speeds. (TomTom)
For an e-commerce or quick-commerce operator, the practical implication is straightforward: distance alone is not an adequate measure of delivery efficiency.
A 4-km delivery through a congested corridor can consume more rider time than a 7-km delivery through relatively free-flowing roads. Therefore, a useful analytics model should evaluate:
| Operational variable | Why it matters |
|---|---|
| Distance per order | Indicates physical delivery effort |
| Time per order | Measures rider productivity |
| Orders per rider-hour | Shows workforce utilization |
| Orders per pincode | Identifies demand concentration |
| Average route speed | Helps identify traffic-sensitive zones |
| Delivery delay rate | Reveals service-quality gaps |
| Empty-return distance | Highlights wasted movement |
| Battery consumption | Supports e-bike deployment planning |
| Orders per charging cycle | Connects mobility with operational capacity |
| Cost per delivered order | Links routing to profitability |
This data can then support route clustering, rider allocation, delivery-window planning, and fulfillment-location decisions.
The first layer is turning fragmented delivery records into location-aware operational intelligence. Delhi e-commerce delivery intelligence analytics can connect order coordinates, pincodes, timestamps, route distances, delivery outcomes, and traffic patterns.
Instead of asking only, "How many orders did we deliver?", an operator can ask:
| Indicator | Delhi/India evidence | Operational implication |
|---|---|---|
| New Delhi average congestion, 2025 | 60.2% | Static distance-based planning can miss congestion effects |
| Average speed during evening rush | 18.9 km/h | Time-sensitive deliveries need traffic-aware routing |
| Rush-hour time lost annually | 104 hours | Rider schedules can account for recurring congestion |
| India EV sales, 2024 | 2.03 million | Electrification is becoming material to urban mobility |
| 2W share of India's EV sales, 2024 | 59% | Two-wheelers are central to EV adoption |
NITI Aayog reported that India's EV sales reached 2.03 million units in 2024, with electric two-wheelers representing 59% of total EV sales. (NITI Aayog)
Between 2020 and 2026, delivery intelligence has moved from basic order tracking toward increasingly granular operational analysis. The expansion of online grocery, food delivery, D2C commerce, and quick commerce increased the importance of delivery density and fulfillment proximity. Bain reported that Indian quick-commerce orders doubled between 2022 and 2023, while leading operators improved unit economics through higher order density, rider productivity, and dark-store automation. (Bain) By 2024, quick commerce had reached approximately $7 billion in gross merchandise value, according to the Flipkart-Bain report. (Moneycontrol) Meanwhile, Delhi's mobility environment continued to create a strong need for location-sensitive planning. In 2025, New Delhi's congestion averaged 60.2%, demonstrating why route performance can vary substantially by time of day. (TomTom) By 2026, Delhi's EV transition had also become more significant: EV registrations increased from 83,512 in FY2024-25 to about 1.07 lakh in FY2025-26, according to analysis of Vahan data reported by PTI. (Hindustan Times) The combined trend means delivery operators can increasingly evaluate demand, mobility, traffic, and vehicle utilization as one connected dataset.
A delivery network can look healthy at city level while individual pincodes perform very differently. Hyperlocal delivery performance monitoring Delhi enables operators to examine performance at the pincode, neighborhood, fulfillment point, rider, route, and time-slot levels.
For example, a business can classify delivery zones using:
This creates a more actionable view than a citywide average.
| KPI | Example analytical question |
|---|---|
| Orders/hour | When does demand peak? |
| Average delivery minutes | Which zones consume rider capacity? |
| Distance/order | Where is routing inefficient? |
| Delay percentage | Where are service promises being missed? |
| Rider utilization | Which zones are over- or under-staffed? |
| Repeat orders | Where is customer density strongest? |
| Cancellation rate | Are delivery delays affecting conversion? |
| Battery usage/order | Which routes consume more vehicle capacity? |
The key is to compare similar time windows rather than treating every delivery as equivalent.
From 2020 onward, hyperlocal delivery measurement became increasingly granular as consumers became accustomed to shorter fulfillment windows. During the early e-commerce acceleration, businesses primarily monitored order volume and delivery completion. As quick commerce expanded, metrics such as orders per dark store, delivery time, rider productivity, and delivery density became more important. Bain's research highlighted delivery and warehousing cost optimization through greater order density and rider productivity. (Bain) By 2025, quick-commerce networks were operating at significantly larger scale. Instamart's reported active dark stores increased from 557 in Q1 FY25 to 1,062 by Q1 FY26, while orders per dark store per day changed from 1,144 to 985 over the same period. (BS Media) This illustrates why network expansion needs utilization monitoring rather than relying only on store-count growth. In 2026, Delhi operators can use historical pincode-level delivery records to distinguish genuine demand growth from temporary spikes. For local businesses, the progression is from measuring completed deliveries toward understanding the geographic and temporal causes of delivery performance.
E-bike delivery data intelligence solutions for Delhi local businesses can help smaller operators determine where electric two-wheelers make operational sense instead of deploying them uniformly.
The right deployment model depends on:
Delhi's EV market provides useful context. Recent Vahan-based reporting shows that 68,275 electric two-wheelers were registered in Delhi across FY2024-25 and FY2025-26, compared with 942,857 non-electric two-wheelers. EVs therefore represented about 6.8% of two-wheeler registrations across those two fiscal years. (Hindustan Times)
| Data field | Business use |
|---|---|
| Vehicle ID | Fleet-level performance |
| Battery level | Dispatch and charging planning |
| Order ID | Delivery traceability |
| Pickup pincode | Origin analysis |
| Drop pincode | Demand mapping |
| Pickup time | Dispatch analysis |
| Delivery time | SLA measurement |
| Distance | Route-cost analysis |
| Product category | Load planning |
| Delivery status | Exception monitoring |
| Rider ID | Productivity measurement |
Delhi's official EV program also provides incentives for electric two-wheelers and e-cargo cycles, while the city's EV policy framework includes purchase incentives and other measures. (Delhi EV)
The 2020–2026 period shows a gradual convergence between e-commerce logistics and electric mobility. India's electric two-wheeler segment expanded from a relatively small base, while delivery platforms increasingly experimented with EV fleets for urban last-mile operations. NITI Aayog's 2024 analysis reported that electric two-wheelers represented 59% of India's total EV sales, confirming their importance in the country's broader electrification trend. (NITI Aayog) Delhi has also maintained policies supporting electric mobility, including incentives for electric two-wheelers and e-cargo cycles. (Delhi EV) At the same time, actual two-wheeler adoption has remained below the city's earlier policy ambitions. Data reported in 2026 showed EVs represented 6% of Delhi's two-wheeler registrations in FY2024-25 and 7.4% in FY2025-26. (Hindustan Times) That gap makes operational data particularly important. Businesses considering fleet electrification can compare battery utilization, route length, order density, charging downtime, and delivery productivity rather than assuming that every route delivers the same economics. By 2026, this makes vehicle-level data a practical component of fleet planning rather than merely an environmental reporting metric.
Delhi Hyperlocal Delivery Intelligence can connect customer demand with fulfillment capacity, traffic conditions, inventory availability, and rider deployment.
A useful system can create a live operating map showing:
The system can then support decisions such as whether to reposition riders, alter delivery zones, change dispatch priorities, or adjust inventory placement.
GPS can identify the shortest physical route. Operational intelligence needs to consider time, demand, capacity, and delivery economics simultaneously.
For example:
Route A: 5 km, 35 minutes, high congestion
Route B: 7 km, 24 minutes, lower congestion
A distance-only algorithm may prefer Route A. A time-and-cost model could reach a different operational decision depending on rider wages, SLA commitments, fuel or battery consumption, and the number of orders that can be completed during the available shift.
Between 2020 and 2026, route optimization increasingly evolved from navigation assistance into network-level decision support. Earlier systems typically focused on finding a path from a pickup location to a customer. As order volumes increased and delivery promises shortened, businesses needed to coordinate multiple riders, fulfillment locations, and orders simultaneously. Quick-commerce operators demonstrated the importance of dense fulfillment networks and high order throughput. In Q1 FY26, one major quick-commerce business reported 92 million orders during the quarter and 1,062 active dark stores, according to company-reported figures compiled in its investor materials. (BS Media) The same data showed 985 orders per active dark store per day in that quarter, illustrating that network size and utilization must be analyzed together. Delhi's 2025 traffic conditions add another layer: evening-rush average speed was 18.9 km/h, and a 10-km trip averaged 31 minutes 45 seconds during the evening rush. (TomTom) Consequently, modern hyperlocal intelligence needs to connect route duration with demand timing, rider availability, and fulfillment proximity rather than treating every kilometer as operationally equal.
E-bike delivery demand forecasting for Delhi local businesses can help operators estimate where and when delivery requirements may increase.
Forecasting models can use historical order data together with:
The objective is to estimate expected order density, not merely total daily orders.
| Forecast layer | Decision supported |
|---|---|
| City level | Overall fleet capacity |
| Zone level | Rider positioning |
| Pincode level | Micro-market staffing |
| Hourly level | Shift scheduling |
| Category level | Inventory preparation |
| SKU level | Fulfillment readiness |
| Vehicle level | Battery and charging planning |
This becomes particularly important as consumer behavior shifts toward immediate fulfillment.
A 2025 Zepto year-end report, for example, found that milk was the top-ordered item across cities, while tomatoes and onions were among the leading items in Delhi NCR and other major markets. (Business Standard) Such category-level patterns can inform demand forecasting when combined with a business's own order history.
Demand forecasting became increasingly important as Indian consumers moved from scheduled online shopping toward immediate and repeat purchasing. Bain's 2023 research found that quick-commerce orders had doubled year over year and that approximately 80% of quick-commerce orders were concentrated in the top 10 cities, highlighting the urban concentration of the model. (Bain) By 2024, quick commerce represented more than two-thirds of online grocery orders in India, according to the Flipkart-Bain report. (Moneycontrol) In 2025, category-level consumer data showed continued demand for everyday staples such as milk and fresh produce in Delhi NCR. (Business Standard) By 2026, the forecasting opportunity is therefore broader than predicting total order counts. Businesses can model demand at the pincode, time-slot, category, and SKU levels. Combining these forecasts with vehicle availability makes it possible to prepare capacity before demand arrives. For e-bike fleets, the same model can estimate likely route demand and battery requirements, helping operators coordinate riders, charging schedules, and inventory preparation around expected workload.
Quick Commerce Intelligence brings together demand, fulfillment, pricing, inventory, delivery, and competitive signals to understand the economics of rapid commerce.
The Indian market has already reached substantial scale. The Flipkart-Bain 2025 report estimated India's quick-commerce gross merchandise value at $7 billion in 2024, compared with $1.6 billion in 2022. (Moneycontrol)
At the operational level, the scale creates a balancing problem:
More dark stores → potentially shorter delivery distances → but potentially lower utilization per location.
This is visible in reported quick-commerce operating data. In Q1 FY26, active dark stores reached 1,062, while orders per dark store per day were 985. (BS Media)
What should businesses monitor?
| Intelligence area | Useful metric |
|---|---|
| Demand | Orders per pincode/hour |
| Fulfillment | Orders per store/day |
| Delivery | Minutes per order |
| Fleet | Orders per rider-hour |
| Mobility | Distance per order |
| Cost | Cost per completed delivery |
| Inventory | Stock availability rate |
| Customer | Repeat-order rate |
| Service | SLA compliance |
| Network | Demand-to-capacity ratio |
For local businesses, this creates a practical feedback loop: forecast demand → position inventory → allocate riders → optimize routes → measure performance → update the forecast.
India's quick-commerce market developed rapidly between 2020 and 2026, moving from an emerging delivery model into a major part of online grocery and urban commerce. Bain reported that quick-commerce orders doubled between 2022 and 2023, while quick commerce accounted for 40%–50% of India's e-grocery GMV in 2023. (Bain) The following year, the segment reached approximately $7 billion in GOV, according to the Flipkart-Bain report. (Moneycontrol) Network expansion continued through 2025 and 2026. Business Standard reported that Zepto operated 1,139 dark stores at the end of FY26, while Instamart had 1,143 and Blinkit 2,243. (Business Standard) These figures show why quick-commerce intelligence cannot focus exclusively on customer demand. Businesses also need to understand store utilization, geographic coverage, delivery density, rider productivity, and the relationship between network expansion and operating performance. For Delhi-based operators, adding local traffic and pincode intelligence makes the analysis even more granular.
Actowiz Metrics can help businesses convert fragmented marketplace, retail, location, product, and delivery information into structured datasets for operational analysis.
Pincode-Level Retail Data Scraping for Market Intelligences can support granular analysis of product availability, prices, assortment, delivery coverage, and retail activity across targeted Delhi locations.
The resulting datasets can be structured around:
This can be combined with E-Bike Delivery Data Intelligence in Delhi to create a broader view of the relationship between where products are available, where customers are ordering, and how efficiently deliveries can be fulfilled.
For example, businesses can use recurring datasets to identify:
The value comes from connecting datasets rather than analyzing each source independently.
A practical implementation should begin with a consistent KPI framework.
| KPI category | Core metric | Business question |
|---|---|---|
| Demand | Orders/pincode/hour | Where is demand concentrated? |
| Routing | Minutes/order | Which routes consume the most time? |
| Fleet | Orders/rider-hour | How efficiently is capacity used? |
| Distance | Km/order | Where is travel excessive? |
| Service | SLA compliance | Are promised delivery times being met? |
| Inventory | Availability rate | Can local demand be fulfilled nearby? |
| Vehicle | Battery usage/order | Which routes require more energy? |
| Cost | Cost/order | Which zones are expensive to serve? |
| Network | Orders/store/day | Are fulfillment points adequately utilized? |
| Customer | Repeat orders | Which micro-markets have recurring demand? |
The strongest analysis does not treat these KPIs separately. It connects them.
For instance, a pincode with high demand but long delivery times may require inventory repositioning, not additional riders. A pincode with low demand and high travel distance may require delivery-zone restructuring. A high-demand zone with strong order density but poor battery availability may require charging and shift planning. That distinction can prevent businesses from solving a routing problem with unnecessary fleet expansion.
Delhi's traffic density, growing online commerce, expanding quick-commerce networks, and increasing adoption of electric two-wheelers are creating a more data-intensive environment for last-mile delivery. The relevant opportunity is not simply to collect more delivery records. It is to connect demand, location, traffic, vehicle capacity, inventory, and delivery performance into a decision-ready intelligence layer.
The 2025 New Delhi traffic data illustrates the operational challenge clearly: average congestion reached 60.2%, while evening-rush average speed was 18.9 km/h. (TomTom) At the same time, India's quick-commerce market reached approximately $7 billion in 2024, showing how rapidly time-sensitive commerce has scaled. (Moneycontrol)
For local retailers, D2C brands, grocery operators, pharmacies, restaurants, and quick-commerce businesses, granular intelligence can support better decisions around rider allocation, route planning, fulfillment placement, battery utilization, delivery windows, and pincode-level demand.
The practical goal is straightforward: use actual delivery and market data to put the right inventory, rider, vehicle, and route in the right place at the right time.
Explore E-Bike Delivery Data Intelligence in Delhi with Actowiz Metrics to turn pincode-level retail and delivery data into actionable insights for smarter routing, demand planning, fleet utilization, and hyperlocal growth!
Expert blogs, research reports and infographics — practical, data-driven reading across e-commerce and quick-commerce.
Most fields are optional — the more you share, the better your sample.

.webp "infographics")
.webp "infographics")