BLOG




















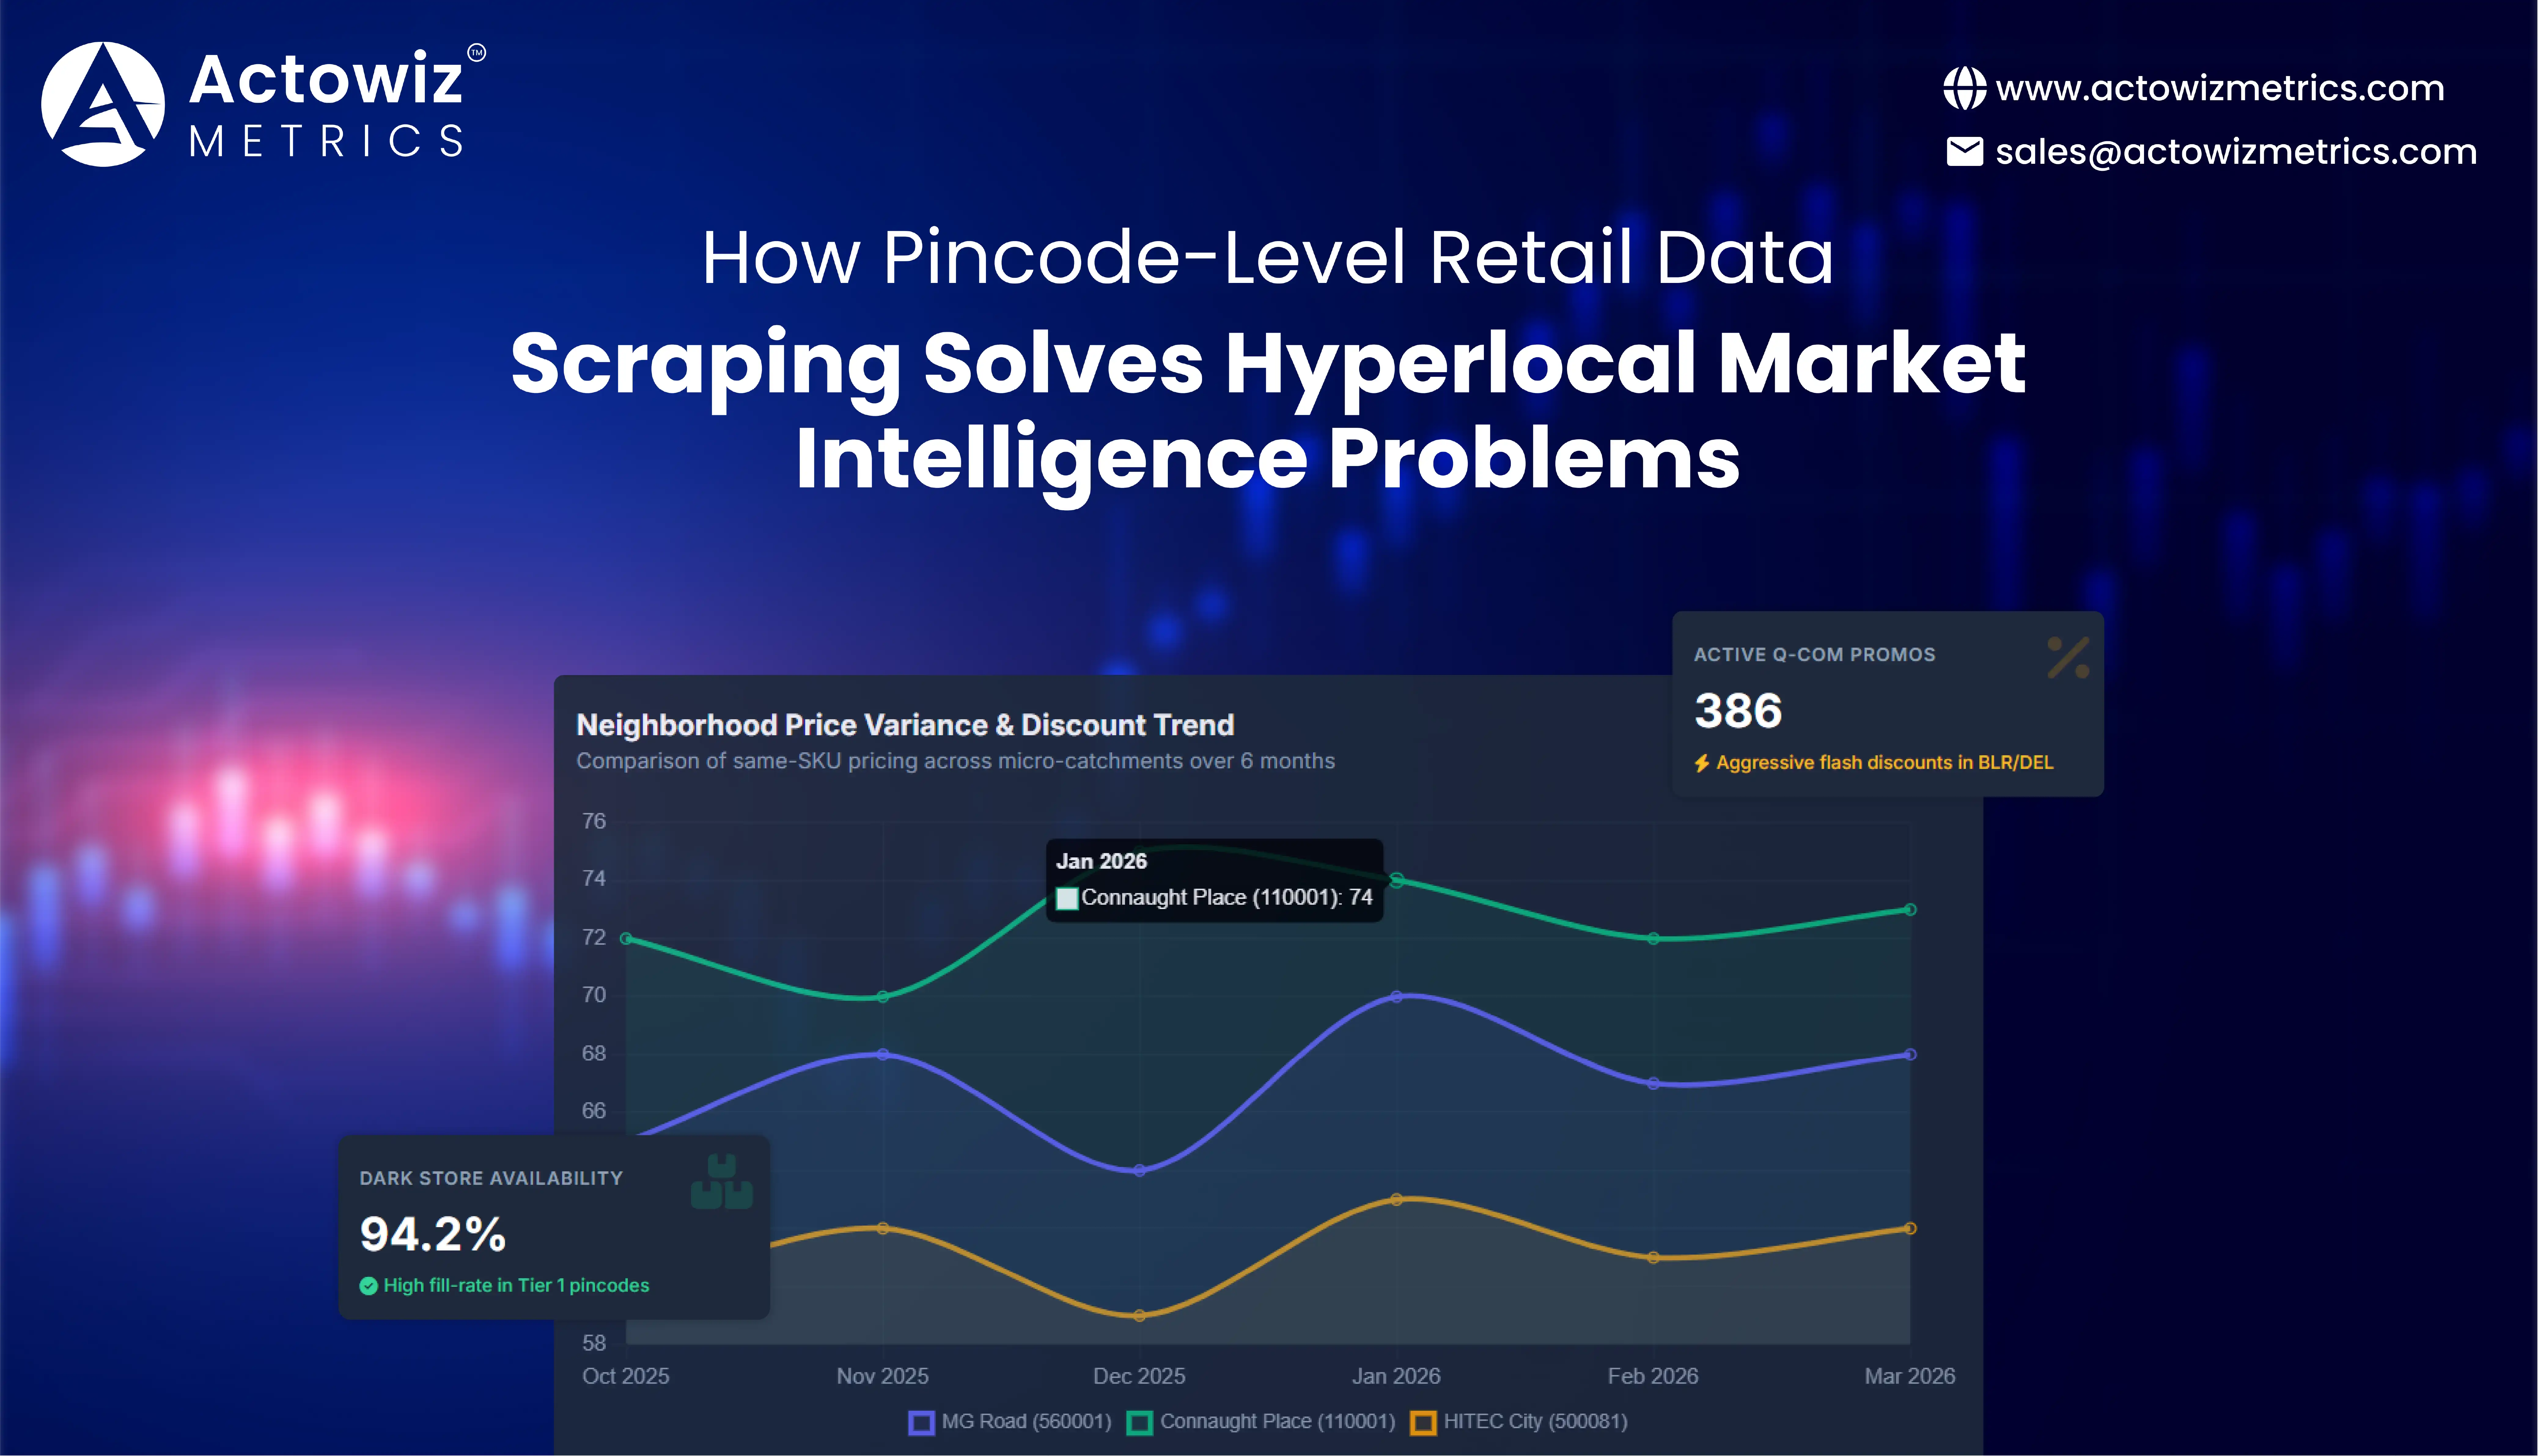
Pincode-Level Retail Data Scraping solves a core problem in modern retail: city-level averages can hide major differences in prices, availability, promotions, assortment, and delivery conditions between neighborhoods. For retailers, FMCG brands, quick-commerce businesses, and market researchers, collecting retail signals at the pincode level creates a much more actionable view of local demand and competition.
India's retail market is becoming increasingly digital and geographically fragmented. IBEF reports that India's online retail market reached approximately US$80 billion in FY2026, while quick commerce had become a US$7–8 billion market in FY2025.
This shift makes Price & promotion intelligence increasingly important. A product may be discounted in one locality while selling at its regular price elsewhere. Availability can also vary because stores and dark stores serve different catchment areas.
For a pricing manager, category manager, FMCG brand, or competitive-intelligence team, the key question is therefore not simply "What is the product price?" It is "What is the product price in this specific location, against which competitors, and at what point in time?"
Pincode-Level Retail Data Extraction converts geographically fragmented retail information into structured datasets that can be compared across neighborhoods. The data can include product names, brands, categories, prices, discounts, stock status, delivery charges, estimated delivery times, and promotional labels.
The 2020–2026 period is particularly important because India's retail landscape moved rapidly toward digital and hyperlocal commerce. During the pandemic, consumers increasingly relied on online channels for essential purchases. By 2021, quick commerce began scaling its dark-store model, while 2022 saw the category move toward more frequent everyday transactions.
Redseer's research shows monthly transacting users on quick-commerce platforms increased from 2.2 million in 2021 to 8.5 million in 2022, 13.2 million in 2023, 23 million in 2024, and 51 million in 2025.
| Year | Retail environment | Data implication |
|---|---|---|
| 2020 | Pandemic accelerated online grocery | Local digital availability became important |
| 2021 | Quick-commerce adoption expanded | Hyperlocal monitoring gained relevance |
| 2022 | Convenience-led shopping accelerated | Frequent price checks became valuable |
| 2023 | Competition broadened | Competitor benchmarking became more granular |
| 2024 | Q-commerce captured over two-thirds of e-grocery orders | Pincode-level analysis became more important |
| 2025 | Q-commerce reached US$7–8B in FY25 | Local assortment and pricing became strategic |
| 2026 | Online retail reached about US$80B in FY26 | Geographic retail intelligence continues to scale |
The objective is not simply to collect more retail records. It is to associate each observation with a geographic identifier and timestamp. This enables businesses to identify patterns that city-level datasets can miss. For example, two pincodes within the same city may have different promotional intensity because of local competition, purchasing power, store density, inventory levels, or delivery economics. A granular dataset makes these differences measurable.
Retail Data Scraping by Pincode allows businesses to observe how retail conditions differ across defined geographic markets. This is especially relevant for quick-commerce platforms, grocery retailers, consumer brands, and distributors competing in dense urban markets.
The importance of geographic retail intelligence increased as quick commerce expanded. Reuters reported in 2025 that quick commerce represented more than two-thirds of India's e-grocery orders in 2024 and that its market had grown to approximately US$6–7 billion from 2022 levels.
| Period | Market development | Pincode-level question |
|---|---|---|
| 2020 | Online grocery adoption surged | Which areas shifted online? |
| 2021 | Hyperlocal fulfilment expanded | Which pincodes received better coverage? |
| 2022 | Q-commerce scaled | Which areas had deeper assortment? |
| 2023 | Price competition increased | Where were discounts strongest? |
| 2024 | Q-commerce dominated e-grocery orders | How did local offers differ? |
| 2025 | 51M monthly Q-commerce users | Which areas showed stronger digital demand? |
| 2026 | Online retail reached ~US$80B | Where should expansion focus? |
The second keyword, Pincode-Level Retail Data Scraping, represents the technical layer behind this analysis. A recurring collection process can capture the same products across multiple pincodes and preserve their observations over time. This creates a matrix of product × retailer × pincode × date. Analysts can then calculate price differences, promotional frequency, availability rates, and assortment depth. For FMCG brands, the approach can reveal whether their products are consistently available in target areas. For retailers, it can identify neighborhoods where competitors have stronger assortment or more aggressive promotions. The result is a localized market view rather than a broad city-level snapshot.
Pincode-Level Product & Price Data can help businesses identify localized pricing gaps, assortment differences, promotional intensity, and product availability.
This matters because India's retail market is increasingly influenced by convenience and proximity. IBEF estimates that quick commerce reached US$7–8 billion in FY2025 and expanded at a 110–130% CAGR over 2021–2025.
When retail competition operates within short delivery catchments, the same product can experience different commercial conditions across locations.
| Data point | Example intelligence |
|---|---|
| Product price | Identify local price differences |
| Discount | Measure promotional intensity |
| Availability | Detect potential supply gaps |
| Pack size | Compare value positioning |
| Brand | Benchmark brand presence |
| Category | Identify local assortment depth |
| Delivery fee | Compare fulfilment economics |
| Delivery time | Measure service positioning |
| Promotion | Identify localized campaigns |
A practical analysis might compare the price of a one-litre branded beverage across 100 pincodes. Instead of calculating one national average, analysts can identify clusters where the product is consistently cheaper, more heavily promoted, or frequently unavailable. This information can influence pricing decisions. If a retailer consistently underprices a product in a specific cluster, competitors can investigate whether the strategy is designed to acquire customers, respond to local competition, or clear inventory. The same dataset can support assortment decisions. A brand may discover that some pincodes have strong demand indicators but limited product availability. That could suggest an opportunity for better distribution. The key is to combine price with context. A ₹10 price difference is not necessarily meaningful without knowing whether the pack size, promotion, availability, or delivery conditions are also different.
Zipcode-Level Retail Price Data Scraping provides another way to structure geographic pricing research, particularly for markets where postal or ZIP-code identifiers are used to determine retail availability.
Although India primarily uses pincodes rather than ZIP codes, the underlying analytical principle is the same: connect retail observations to precise serviceable areas.
From 2020 onward, digital retail increasingly allowed businesses to personalize availability and fulfilment according to location. Quick-commerce growth strengthened this model because inventory is held closer to consumers through dark stores and micro-fulfilment networks.
Redseer describes quick commerce as being driven by dense dark-store networks, predictable delivery, and convenience-led replenishment. Its research shows monthly transacting users rose sharply from 2.2 million in 2021 to 51 million in 2025.
| Year | Geographic-retail trend | Analytical opportunity |
|---|---|---|
| 2020 | Digital grocery adoption | Map emerging online demand |
| 2021 | Dark-store expansion | Track serviceable areas |
| 2022 | Faster delivery models | Compare local fulfilment |
| 2023 | Broader category coverage | Monitor local assortment |
| 2024 | Q-commerce scale-up | Benchmark local prices |
| 2025 | Rapid user expansion | Identify emerging markets |
| 2026 | Wider digital retail footprint | Prioritize geographic opportunities |
For a national retailer, geographic pricing data can reveal where a centralized pricing strategy is working and where localized intervention may be necessary. For a consumer brand, it can identify markets where competitors are using aggressive promotions. For a marketplace, it can help understand how assortment and pricing differ between serviceable zones. The resulting intelligence can also support location planning. Areas with strong assortment demand but weak competitor coverage may represent potential expansion opportunities.
Retail Competitor Price Monitoring becomes substantially more useful when observations are tied to individual locations. A national competitor price may provide a useful benchmark, but it does not necessarily represent what consumers see in a particular neighborhood.
The rapid expansion of quick commerce illustrates this challenge. CareEdge estimated India's quick-commerce market at around ₹64,000 crore in FY2025, representing a 142% CAGR between FY2022 and FY2025.
The market is therefore moving from broad online competition toward highly localized competition.
| Monitoring dimension | Business question |
|---|---|
| Price | Who is cheaper in each pincode? |
| Discount | Which competitor promotes more aggressively? |
| Availability | Which products are frequently unavailable? |
| Assortment | Which retailer has deeper selection? |
| Pack size | Are competitors changing value propositions? |
| Delivery | Which provider offers faster fulfilment? |
| Promotion | Which local offers recur most often? |
A retailer can use this information to create competitive price maps. Instead of reporting that Competitor A is 4% cheaper nationally, analysts can identify specific pincodes where the difference is 10% and others where Competitor A is actually more expensive. This distinction matters for pricing teams. It enables localized responses rather than blanket price changes that could unnecessarily reduce margins. FMCG companies can also use the information to assess retail execution. If a product has strong availability in one region but poor availability in another, the issue may relate to distribution rather than consumer demand. A timestamped competitor dataset additionally makes it possible to measure promotional duration. Analysts can identify whether a discount is a one-day event, a recurring weekly campaign, or a longer-term pricing strategy.
Location-Based Retail Data for Market Intelligence allows businesses to connect retail observations with geography, consumer catchments, competitor presence, and local commercial conditions.
This is increasingly important as Indian retail expands beyond major metropolitan centers. IBEF notes that retail growth is occurring across metros as well as Tier II and Tier III cities, supported by urbanization, rising incomes, and changing consumer preferences.
PhonePe's Pincode platform illustrates the broader movement toward hyperlocal retail infrastructure. By July 2025, Pincode had digitally empowered more than 1,000 offline stores across Bengaluru, Pune, Delhi NCR, Hyderabad, Mumbai, and Varanasi. PhonePe said its platform used data-backed insights to help retailers optimize product selection based on customer demand.
| Year | Strategic development | Location intelligence value |
|---|---|---|
| 2020 | Online retail accelerated | Identify digital adoption pockets |
| 2021 | Hyperlocal models expanded | Map local service coverage |
| 2022 | Q-commerce gained momentum | Compare dark-store catchments |
| 2023 | Retail competition intensified | Build local benchmarks |
| 2024 | Q-commerce captured major e-grocery share | Track neighborhood-level competition |
| 2025 | 51M Q-commerce monthly users | Identify high-activity areas |
| 2026 | Online retail reached ~US$80B | Support expansion and optimization |
The strongest location-intelligence model combines geography with product, price, availability, promotion, and competitor information. This creates a practical decision layer for market expansion, assortment planning, pricing, and promotional strategy. For a category manager, the question becomes which products should be stocked where. For a pricing manager, it becomes where prices need adjustment. For a brand, it becomes which pincodes have distribution gaps. For an expansion team, it becomes which markets offer the strongest competitive opportunity. That is the practical value of granular retail intelligence.
Quick Commerce Analytics requires a data foundation capable of connecting products, prices, availability, promotions, competitors, and locations. Actowiz Metrics can help businesses structure these signals into analytical datasets designed for recurring retail intelligence.
A location-aware workflow can capture comparable retail observations across selected pincodes and time periods. Businesses can then analyze price variance, promotional frequency, product availability, assortment depth, and competitive positioning.
The value of Pincode-Level Retail Data Scraping is strongest when the resulting data is normalized and timestamped. Instead of maintaining isolated observations, organizations can create historical datasets that show how retail conditions evolve.
Actowiz Metrics can support use cases across quick commerce, grocery, FMCG, marketplace research, and retail strategy. The objective is to transform raw retail observations into usable metrics that decision-makers can apply to pricing, assortment, competitor benchmarking, and geographic expansion.
For example, a business could monitor 500 products across 100 pincodes and calculate the median price, discount rate, availability percentage, and competitor price gap for every location. These metrics can then feed dashboards and recurring reports. This approach enables teams to move from generic market averages to location-specific decisions.
Hyperlocal retail competition cannot always be understood through national or city-level averages. Prices, promotions, product availability, assortment, and delivery conditions can vary significantly between serviceable areas. As India's digital retail and quick-commerce ecosystems expand, this geographic variation is becoming increasingly important.
The 2020–2026 period demonstrates the shift clearly. Quick commerce moved from an emerging convenience model to a major component of digital grocery, while online retail expanded across cities and increasingly into smaller markets. IBEF estimates India's online retail market at approximately US$80 billion in FY2026, while Redseer reports 51 million monthly quick-commerce transacting users in 2025.
For brands, retailers, pricing teams, and market researchers, Competitor intelligence becomes more actionable when every observation has a geographic dimension.
Pincode-Level Retail Data Scraping provides the foundation for this approach by connecting products, prices, promotions, availability, and competitors to specific locations and timestamps.
Build a smarter hyperlocal retail intelligence strategy with Actowiz Metrics and turn pincode-level retail data into actionable pricing, assortment, and competitive decisions!
Expert blogs, research reports and infographics — practical, data-driven reading across e-commerce and quick-commerce.
Most fields are optional — the more you share, the better your sample.
.webp "infographics")
.webp "infographics")