BLOG
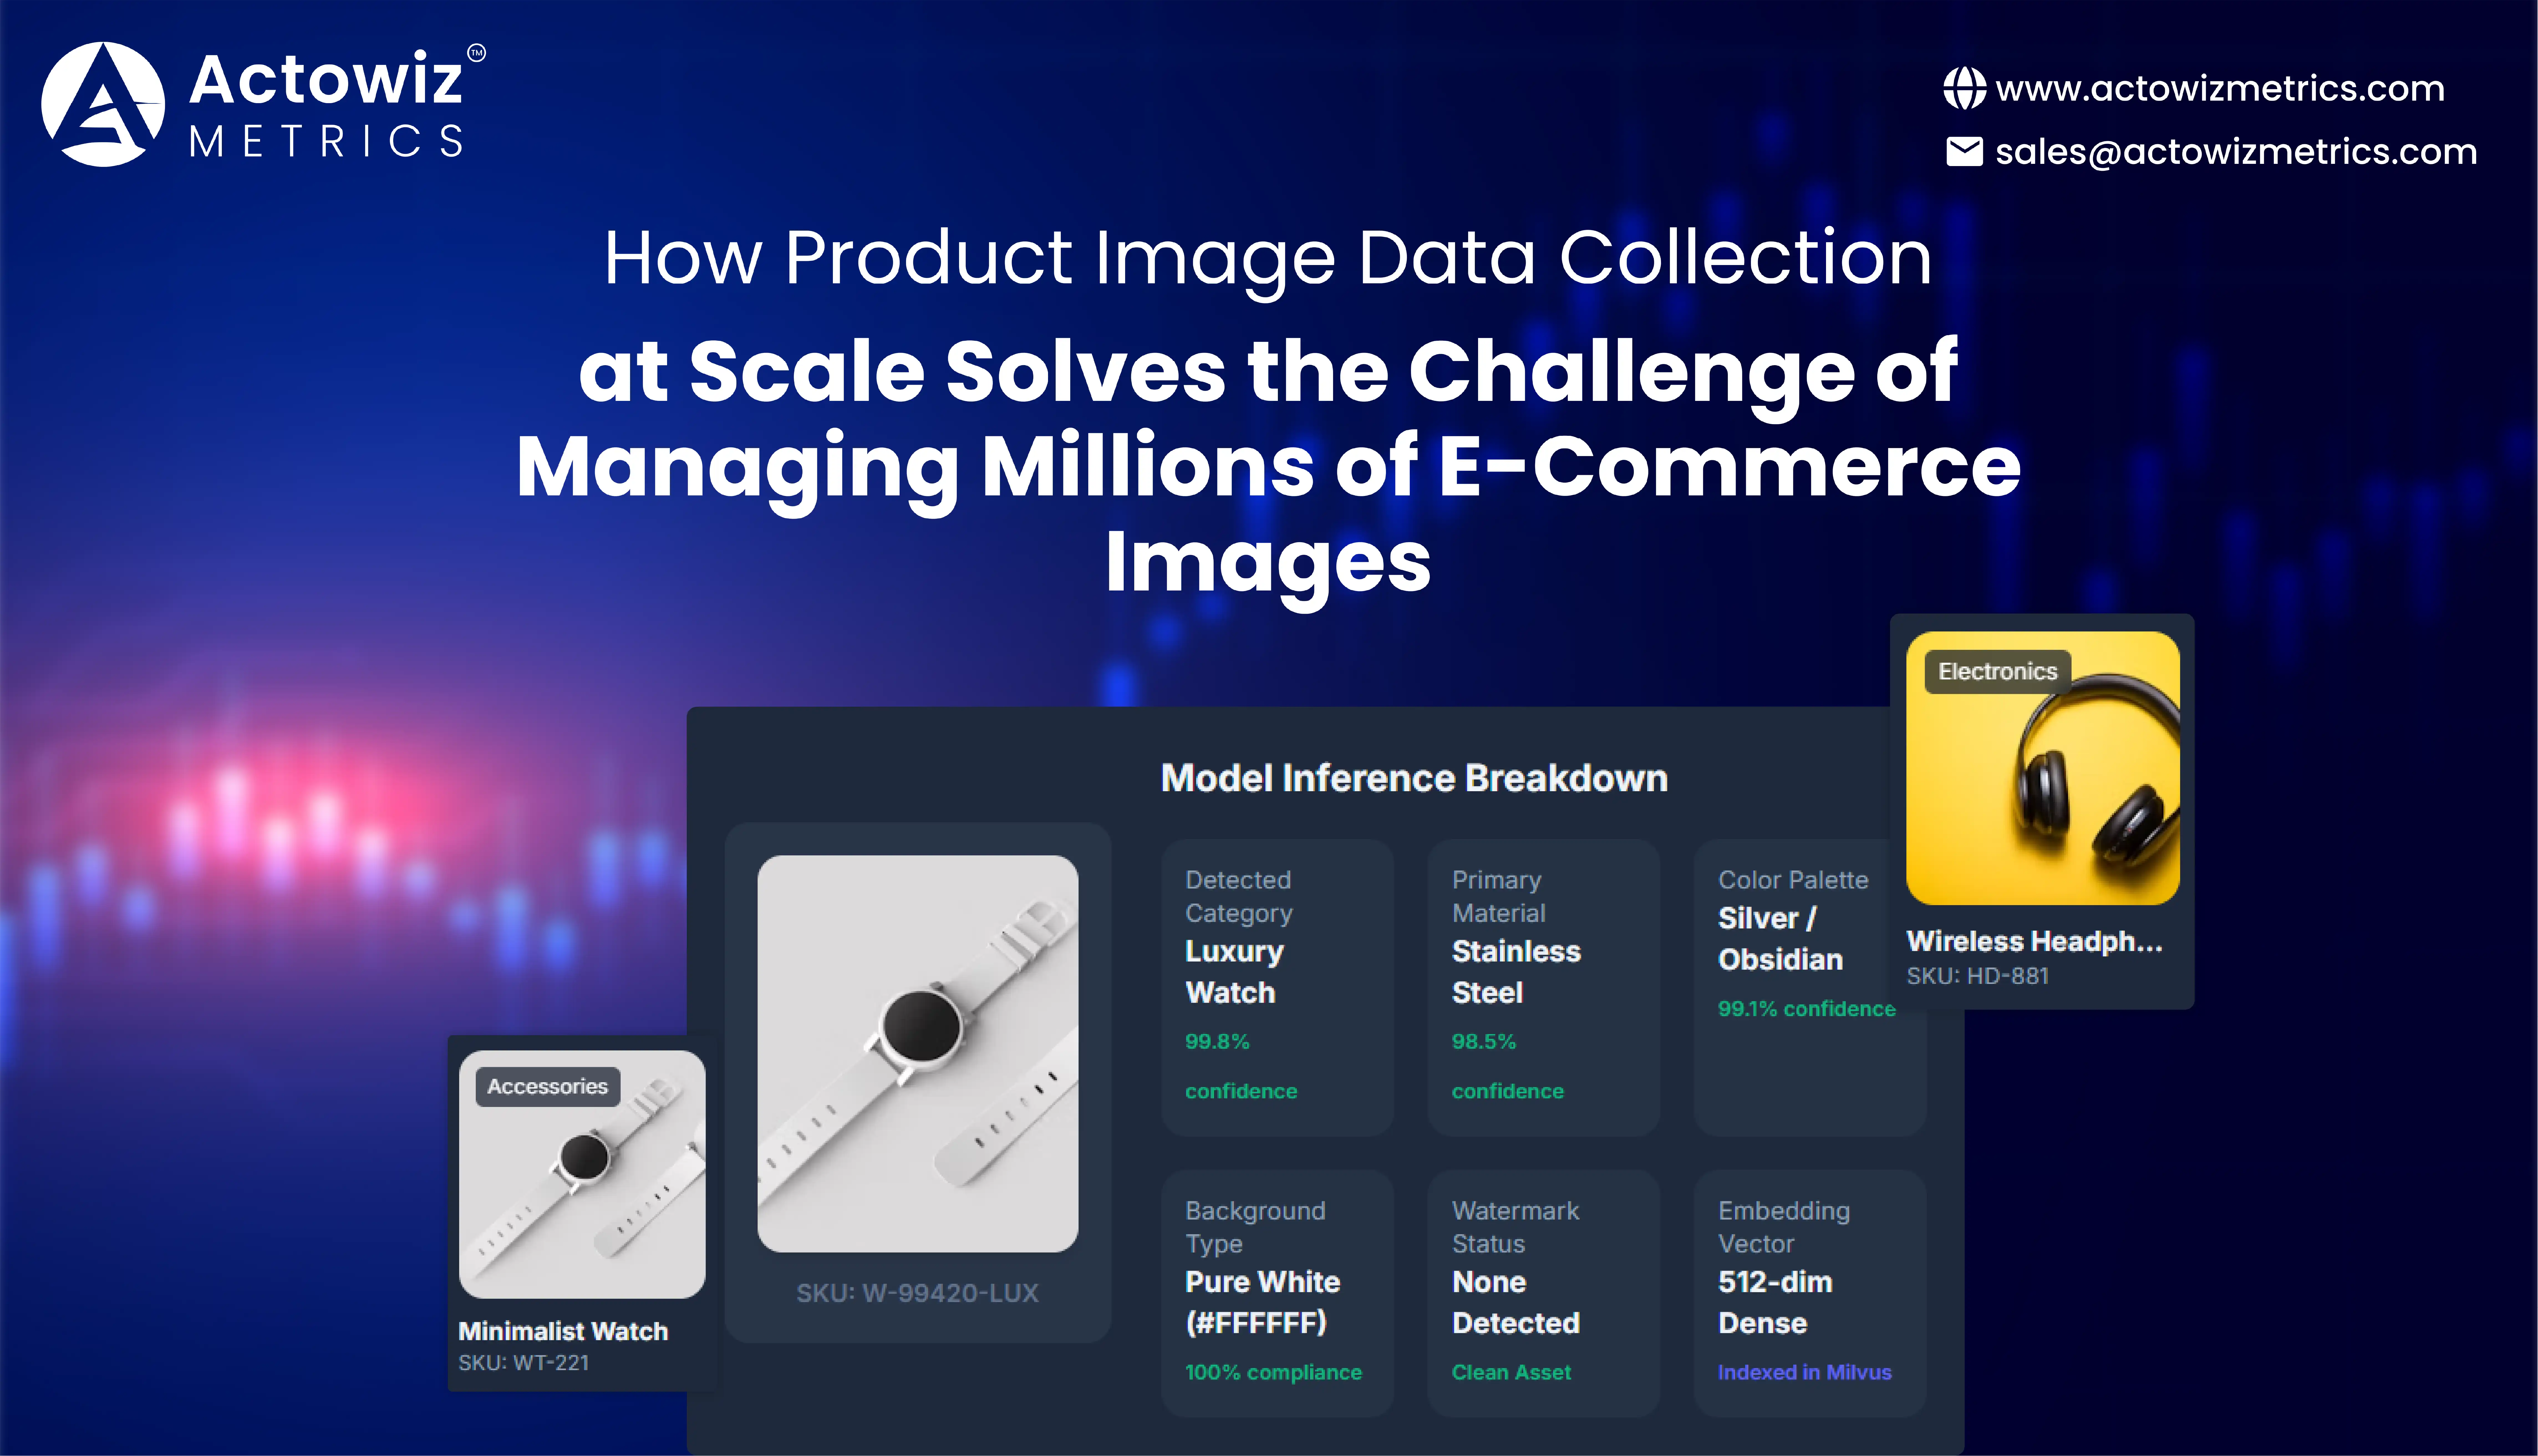




















Managing millions of e-commerce product images is difficult because marketplaces, brands, retailers, and D2C businesses continuously update images, SKUs, variants, colors, packaging, and catalog attributes. Product Image Data Collection at Scale solves this challenge by systematically collecting, organizing, validating, and monitoring product visuals across large online catalogs.
For businesses managing thousands or millions of SKUs, manual image collection creates operational bottlenecks. Teams may struggle with duplicate images, broken URLs, outdated visuals, missing variants, inconsistent naming, and disconnected product metadata. A scalable data pipeline can connect product images with SKU, brand, category, price, availability, product title, and other attributes.
This becomes especially valuable when visual data needs to support Product Data Tracking. Instead of treating images as isolated files, businesses can use them as structured signals for catalog monitoring, competitor intelligence, marketplace analysis, assortment research, and brand compliance.
The core benefit is simple: scalable image collection transforms large volumes of unstructured product visuals into usable, searchable, and monitorable business data.
E-Commerce Product Image Data Extraction enables companies to systematically capture product images and associated information from large online catalogs. The process can include image URLs, thumbnails, high-resolution images, product identifiers, variant information, product titles, categories, and timestamps.
The challenge increased significantly between 2020 and 2026 as digital commerce expanded across marketplaces, retailer websites, social commerce, and D2C channels. More sellers also meant more product variants and frequent catalog changes. In a typical enterprise workflow, a catalog containing 1 million SKUs can potentially generate several million image records when multiple images and variants are associated with each product.
A scalable pipeline should therefore support automated discovery, extraction, validation, deduplication, storage, and scheduled refreshes.
| Year | Typical Business Requirement | Image Data Challenge |
|---|---|---|
| 2020 | Rapid digital catalog expansion | More products moved online |
| 2021 | Marketplace assortment growth | Multiple images per SKU |
| 2022 | Omnichannel catalog management | Duplicate and inconsistent visuals |
| 2023 | Automated catalog intelligence | Greater need for structured data |
| 2024 | AI-assisted visual analysis | Image quality and metadata validation |
| 2025 | Near-real-time catalog monitoring | Faster image changes and refresh cycles |
| 2026 | Enterprise-scale visual intelligence | Automated, continuous image pipelines |
Enterprise benchmark: If 1 million SKUs have an average of five image assets each, the resulting catalog may contain approximately 5 million image records. At 10 images per SKU, that number reaches 10 million. This demonstrates why manual collection becomes impractical at scale.
For data teams, the priority should be consistency rather than simply collecting more images. Every image should ideally retain its product association, source, timestamp, variant, and relevant metadata so downstream analytics can use it reliably.
Product Image Scraping for Online Catalogs helps businesses reduce the operational burden associated with monitoring large and frequently changing product assortments. Instead of manually downloading images from thousands of product pages, automated workflows can identify product records, capture image references, and organize the resulting information into structured datasets.
From 2020 to 2026, online catalogs increasingly became dynamic rather than static. A product image could change because of packaging redesigns, seasonal campaigns, new photography, updated branding, color variants, or marketplace merchandising requirements.
| Problem | Manual Approach | Scalable Approach |
|---|---|---|
| Missing images | Manual checking | Automated validation |
| Duplicate visuals | Spreadsheet comparison | Image/hash-based matching |
| Outdated images | Periodic review | Scheduled monitoring |
| Variant confusion | Manual mapping | SKU-variant association |
| Broken URLs | Customer/team reporting | Automated URL checks |
| Large catalog updates | Bulk manual work | Automated refresh |
| Historical comparison | Difficult to maintain | Timestamped records |
A useful implementation should capture not only the image itself but also contextual information such as product ID, product name, variant, category, source URL, image position, and collection date. For example, an apparel retailer might have separate visuals for front view, back view, model view, close-up, color variant, and packaging. Without structured relationships between those images and the SKU, visual data becomes difficult to analyze. The most effective systems therefore treat images as part of the product record rather than independent assets. This makes catalog auditing, competitor comparison, assortment analysis, and visual compliance significantly easier.
Businesses increasingly need more than image URLs. Scrape E-Commerce Product Image & Catalog Data workflows can connect product visuals with titles, descriptions, prices, brands, categories, ratings, availability, specifications, and variants.
This creates a richer dataset for analyzing how products are presented across different digital channels. Between 2020 and 2026, the relationship between product content and commerce performance became increasingly important because consumers often evaluate products through a combination of images and structured information.
| Data Attribute | Example |
|---|---|
| Product ID | SKU-45821 |
| Brand | Example Brand |
| Category | Running Shoes |
| Product Title | Lightweight Running Shoe |
| Image Count | 6 |
| Primary Image | Main product visual |
| Variant | Black / Size 9 |
| Price | $89.99 |
| Availability | In stock |
| Image Timestamp | 2026-09-09 |
| Source | Marketplace/Product Page |
A catalog intelligence pipeline can compare these records over time. For instance, a brand could detect when a competitor replaces an old product image with a new campaign visual or when a retailer introduces additional product imagery.
In 2020, image collection was frequently treated as a supporting catalog task. By 2022, larger digital assortments made automated extraction more valuable. By 2024, businesses increasingly connected product visuals with broader product intelligence workflows. By 2026, scalable visual datasets can support automated classification, image similarity analysis, catalog quality monitoring, and AI-assisted insights.
The key lesson is that images become substantially more useful when connected to product-level metadata. A structured image-plus-catalog dataset allows teams to move from collecting files to understanding product presentation at scale.
Scalable Product Image Data Collection for E-Commerce Catalogs requires an architecture designed for volume, frequency, reliability, and historical tracking. Collecting 10,000 images once is fundamentally different from continuously monitoring millions of image assets across multiple websites.
An enterprise pipeline should account for source discovery, extraction, normalization, duplicate handling, image validation, metadata mapping, storage, and refresh schedules.
| Catalog Size | Avg. Images/SKU | Approx. Image Records |
|---|---|---|
| 10,000 SKUs | 5 | 50,000 |
| 100,000 SKUs | 5 | 500,000 |
| 500,000 SKUs | 5 | 2.5 million |
| 1 million SKUs | 5 | 5 million |
| 2 million SKUs | 5 | 10 million |
These are illustrative workload calculations, not market statistics.
The 2020–2026 progression highlights why scalability matters. A smaller catalog in 2020 might have been manageable through semi-automated processes. As marketplaces and omnichannel retailers expanded, the number of product-image relationships grew rapidly. By 2026, enterprise teams need systems capable of processing large datasets repeatedly rather than performing one-time collection.
Quality controls are equally important. An extraction pipeline should identify missing image fields, inaccessible URLs, duplicate assets, unexpected file types, and changes in image availability. For organizations, the objective is not simply maximum collection volume. It is dependable collection at predictable intervals. That means businesses can establish daily, weekly, or event-driven refresh cycles depending on the volatility of the catalog.
E-Commerce Visual Product Data Intelligence allows organizations to move beyond basic image collection and use visual information for business analysis. Product images can reveal assortment changes, packaging updates, merchandising strategies, seasonal campaigns, variant expansion, and differences in how products are positioned across sales channels.
From 2020 through 2026, visual commerce became increasingly important as retailers expanded digital storefronts and brands competed for attention across crowded product pages.
| Intelligence Area | Possible Business Insight |
|---|---|
| Image count | Identify content-rich product pages |
| Image changes | Detect catalog updates |
| Packaging visuals | Track branding changes |
| Color variants | Monitor assortment expansion |
| Competitor visuals | Compare merchandising approaches |
| Image quality | Identify catalog inconsistencies |
| Category imagery | Study visual positioning |
| Historical snapshots | Track changes over time |
For example, a consumer electronics brand could compare how competing retailers display the same smartphone. One retailer may emphasize lifestyle images, another technical specifications, and another promotional graphics. These differences can be converted into structured competitive observations.
Visual intelligence can also support internal catalog governance. Brands can identify products with missing hero images, inconsistent backgrounds, outdated packaging, or mismatched variant imagery. The 2020–2026 shift is particularly relevant because product content has become a measurable component of digital merchandising. Businesses can combine image datasets with pricing, availability, ratings, and product attributes to understand not just what competitors sell, but how they visually present those products. The result is a more comprehensive view of digital shelf performance.
E-commerce & D2C Brand Analytics can use large-scale product image datasets to support assortment monitoring, competitor benchmarking, content quality management, and digital shelf optimization. When combined with Product Image Data Collection at Scale, visual records can become part of a broader commercial intelligence system.
D2C brands face a particularly important challenge: products may appear across their own websites, marketplaces, retailer pages, social commerce channels, and regional storefronts. Images can differ between those channels even when the underlying SKU is identical.
| Period | Key Development | Business Impact |
|---|---|---|
| 2020 | Digital-first buying accelerated | More products required online visuals |
| 2021 | Marketplace adoption expanded | More image sources emerged |
| 2022 | Omnichannel catalogs matured | Cross-channel consistency became important |
| 2023 | Data automation increased | Manual catalog monitoring declined |
| 2024 | AI-based visual analysis grew | Images became analyzable data |
| 2025 | Continuous monitoring expanded | Faster competitive insights |
| 2026 | Integrated visual intelligence | Images support broader brand analytics |
A brand can use image intelligence to answer practical questions: Which products have incomplete image coverage? Which competitors recently changed packaging? Which SKUs have inconsistent visuals between channels? Which categories have the strongest visual content? How frequently do competitor catalogs change? These answers can support marketing, merchandising, product teams, e-commerce managers, and data analysts. The important distinction is between raw image collection and actionable intelligence. Raw files create storage requirements. Structured, timestamped, product-linked visual datasets create business value.
Actowiz Metrics can help organizations build structured product-image intelligence workflows designed for large and frequently changing e-commerce catalogs. The focus should be on turning fragmented product visuals into organized datasets that business and analytics teams can actually use.
A scalable workflow can combine product identifiers, image URLs, image metadata, categories, variants, prices, availability, and collection timestamps. This makes it easier to compare product presentation across marketplaces and monitor changes over time.
For large catalogs, automated validation can also help identify missing images, broken references, duplicates, and inconsistent product associations. Historical records can support trend analysis and competitive monitoring rather than relying only on the latest catalog snapshot.
For e-commerce leaders, marketplace managers, D2C brands, retailers, and data teams, this approach can reduce manual catalog auditing while creating a repeatable foundation for visual intelligence.
The value increases when image data is connected with other commercial datasets. Pricing, promotions, assortment, availability, ratings, and product attributes can provide additional context around every visual record. Actowiz Metrics can therefore support a data-driven approach in which product images become measurable digital shelf assets rather than disconnected media files.
Managing millions of e-commerce images requires automation, structured metadata, scalable infrastructure, validation, and continuous monitoring. Product Image Data Collection at Scale gives brands, marketplaces, retailers, and D2C businesses a practical foundation for transforming fragmented visual assets into structured intelligence.
The strongest approach connects every image to relevant SKU and catalog information, maintains timestamps for historical comparison, validates image availability, removes duplication, and supports scheduled refreshes. Businesses can then use the resulting dataset for catalog quality, competitor monitoring, assortment intelligence, merchandising, and digital shelf analysis.
For organizations dealing with rapidly changing catalogs, the goal should not be collecting the maximum number of images. It should be creating reliable, structured, and actionable visual data that can support business decisions.
Ready to turn millions of product images into actionable e-commerce intelligence? Connect with Actowiz Metrics to build a scalable product-image data strategy for your catalog and competitive analytics needs!
Expert blogs, research reports and infographics — practical, data-driven reading across e-commerce and quick-commerce.
Most fields are optional — the more you share, the better your sample.
.webp "infographics")
.webp "infographics")