BLOG
HALLOWEEN SPECIAL OFFER
Data Analytics & Intelligence Solutions
Turn Data into Smarter Business Decisions!
Offer Terms & Conditions Apply


Australia's grocery market has experienced significant pricing, competitive, and digital retail changes between 2020 and 2026. Inflation, changing household budgets, private-label expansion, promotional activity, online grocery adoption, and increasing consumer price sensitivity have made supermarket-level data increasingly valuable for grocery brands and retailers.
Coles Woolworths Aldi grocery price comparison Australia provides a structured way to examine product-level pricing, promotional movements, assortment differences, and availability across three important supermarket operators. The comparison becomes particularly useful when the same or comparable products are tracked over time and normalized by pack size, weight, volume, or unit.
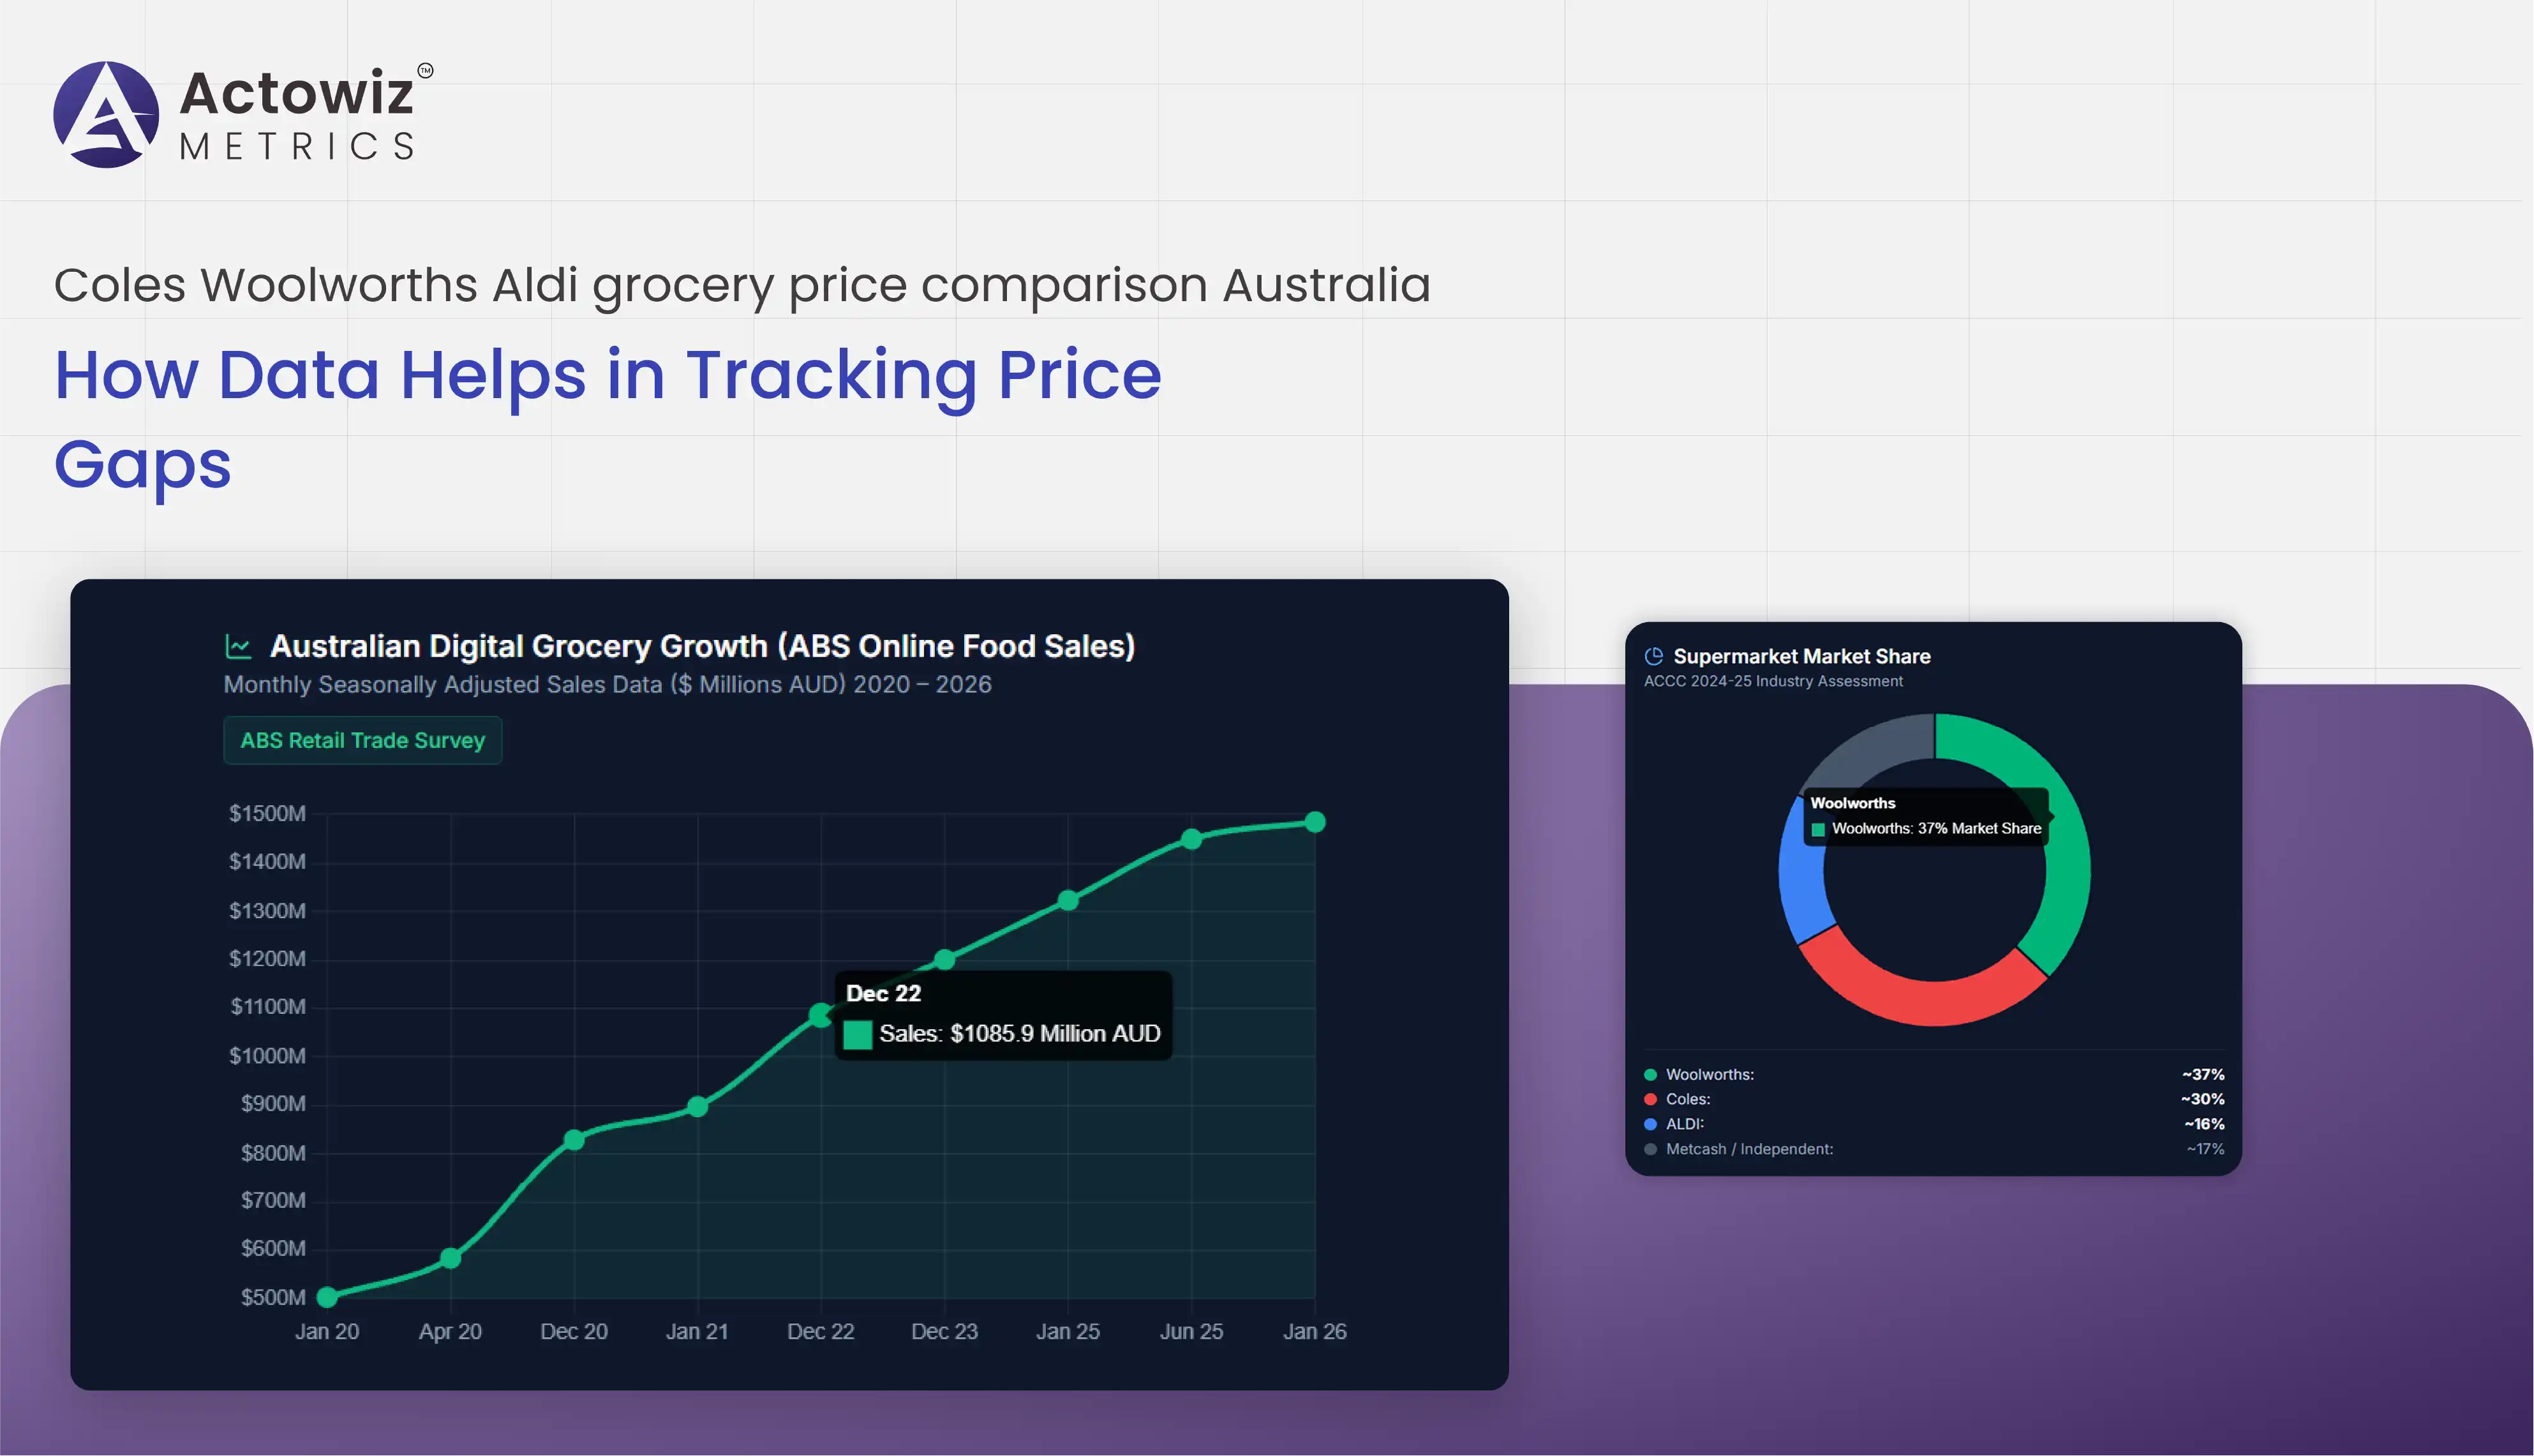
At the same time, Grocery and FMCG (CPG) digital shelf analytics is becoming more relevant as shoppers increasingly interact with supermarket websites and online grocery platforms before purchasing. Australian Bureau of Statistics data shows that seasonally adjusted food online sales increased from $503.0 million in January 2020 to $1,323.7 million in January 2025, illustrating the expansion of the digital grocery channel over the period.
The Australian Competition and Consumer Commission's supermarket inquiry also demonstrates the importance of competitive pricing intelligence. Its final report found that Coles and Woolworths together accounted for approximately 67% of Australian supermarket retailing, while ALDI represented an important competitive constraint despite operating with a smaller range and different retail model.
This report examines how structured supermarket data from 2020 through 2026 can help businesses identify price gaps, understand product availability, analyze digital shelves, map products, and develop deeper grocery market intelligence.
Australia supermarket competitor price intelligence, Coles Woolworths Aldi grocery price comparison Australia can help businesses transform individual supermarket observations into a consistent competitive pricing framework. Rather than checking a handful of products manually, brands can compare thousands of SKUs across categories such as dairy, beverages, cereals, snacks, frozen foods, fresh produce, pantry products, and household essentials.
The importance of this approach increased as Australian grocery affordability became a major public and commercial issue. The ACCC's 2024-25 supermarkets inquiry examined pricing practices, competition, profitability, and supplier relationships and analyzed billions of points of supermarket data. Its final report stated that Coles and Woolworths accounted for approximately 67% of supermarket retailing, while ALDI provided an important competitive constraint.
Between 2020 and 2026, grocery price analysis also became more complicated because prices could differ by product format, location, promotional period, and supermarket format. The ACCC found that some supermarket prices were nationally consistent while others, particularly certain fresh-food categories, could vary by store or region.
| Period | Market development | Data intelligence opportunity |
|---|---|---|
| 2020 | Pandemic-driven shopping disruption | Establish historical price baselines |
| 2021 | Online grocery activity expanded | Track digital prices and assortment |
| 2022 | Inflation intensified | Monitor frequent price changes |
| 2023 | Price sensitivity remained important | Compare promotions and unit prices |
| 2024 | Supermarket competition under scrutiny | Build cross-retailer benchmarks |
| 2025 | Online food sales remained substantial | Expand digital shelf monitoring |
| 2026 | Ongoing competitive monitoring | Maintain current and historical datasets |
For example, brands selling Coca-Cola, Pepsi, Kellogg's, Nestlé, Arnott's, Heinz, or other FMCG products can compare the same SKU across retailers while accounting for pack-size differences and promotions. This creates a more meaningful picture of competitive positioning than simply recording the headline shelf price.
Coles Woolworths Aldi supermarket price gap tracking Australia enables businesses to calculate the difference between comparable products and monitor how that gap changes over time. The process can involve matching products using brand, product name, pack size, GTIN or other identifiers before calculating absolute and percentage differences.
Price-gap analysis is particularly useful for grocery categories where the same branded products are widely distributed. For private-label products, however, direct SKU matching may be less appropriate because products can differ in ingredients, pack size, specifications, and brand positioning. In such cases, category-level and unit-price comparisons can provide a more consistent benchmark.
The 2020-2026 period provides a useful historical backdrop. The ACCC's final report noted that the supermarket sector is highly concentrated and that ALDI's smaller range and different operating model create a distinct competitive position. The ACCC also found that products not claimed to have nationally consistent prices, including some fresh produce, meat, and seafood, represented approximately 12-25% of total supermarket revenue in 2023-24.
| Price-gap metric | Example calculation | Business use |
|---|---|---|
| Absolute gap | $6.00 – $5.50 = $0.50 | Direct price difference |
| Percentage gap | $0.50 ÷ $5.50 | Relative competitiveness |
| Unit price | Price ÷ quantity | Pack-size normalization |
| Promotional gap | Regular price vs sale price | Promotion analysis |
| Category gap | Average retailer price | Category benchmarking |
| Historical gap | Current vs previous observation | Trend monitoring |
A recurring dataset can reveal whether a price gap is temporary or persistent. It can also identify whether the difference is caused by promotions, package-size changes, retailer-specific pricing, or broader category movements.
For example, a 500g cereal product may appear cheaper at one supermarket while its unit price is higher after accounting for different pack sizes. Normalization therefore becomes an essential part of reliable grocery price intelligence.
Australian supermarket digital shelf analytics brings together pricing, product content, availability, promotions, ratings, reviews, assortment, and search visibility into a single analytical framework.
The shift toward digital grocery became especially visible during the 2020 pandemic period. ABS data shows seasonally adjusted online food sales rising from $503.0 million in January 2020 to $584.2 million in April 2020 and $829.0 million in December 2020. By January 2021, food online sales reached $897.5 million, and by December 2023 they had reached $1,201.3 million.
| Year/period | Selected seasonally adjusted food online sales | Context |
|---|---|---|
| Jan 2020 | $503.0m | Pre-pandemic baseline |
| Apr 2020 | $584.2m | Early pandemic period |
| Dec 2020 | $829.0m | Elevated digital grocery activity |
| Jan 2021 | $897.5m | Continued online demand |
| Dec 2022 | $1,085.9m | Established digital channel |
| Dec 2023 | $1,201.3m | Further digital expansion |
| Jan 2025 | $1,323.7m | Higher online food sales |
| Jun 2025 | $1,449.9m | Continued growth |
These figures illustrate why digital shelf monitoring has become an important component of grocery intelligence.
From 2024 through 2026, brands can use digital shelf datasets to monitor whether a product remains visible, whether its price changes, whether promotional messaging changes, and whether availability differs across locations or fulfillment options.
For example, a beverage brand could monitor Coca-Cola 24-packs, Pepsi multipacks, or energy drinks across supermarket websites. A packaged-food brand could track Arnott's biscuits, Kellogg's cereals, or Heinz pantry products. Combining price, availability, product content, and promotional observations creates a more complete view of digital shelf performance.
Coles Woolworths Aldi market intelligence for Australian grocery brands helps FMCG companies move from individual product observations toward broader category and competitor analysis.
A grocery brand may want to understand how its products are positioned across multiple retailers, whether promotions occur simultaneously, whether competitors change prices around promotional periods, and how assortment differs between supermarket channels.
The ACCC's 2024-25 inquiry provides important context. The regulator reported that Coles and Woolworths together represented approximately 67% of national supermarket retail sales based on 2023 financial-year revenue, while ALDI, Coles, and Woolworths together with Metcash accounted for approximately 83%.
| Intelligence area | Brand application |
|---|---|
| Competitor pricing | Compare competing SKUs |
| Promotion tracking | Measure promotional frequency |
| Assortment | Identify retailer-specific listings |
| Private label | Compare branded and own-label products |
| Availability | Identify potential distribution gaps |
| Pack size | Normalize competitive prices |
| Product content | Evaluate digital presentation |
| Historical data | Identify recurring market patterns |
From 2020 to 2026, brands also faced changes in consumer purchasing patterns and increasing digital interaction. A structured dataset can preserve historical observations so teams can compare current pricing with previous periods.
For example, a breakfast category analysis could compare Kellogg's, Sanitarium, and supermarket private-label cereals. A beverage analysis could compare Coca-Cola, Pepsi, and private-label alternatives. A pantry analysis could compare Heinz, Leggo's, Campbell's, and retailer-owned products.
This type of intelligence does not simply identify which retailer has a lower price. It provides context around product positioning, promotion timing, availability, and assortment.
Coles Woolworths Aldi grocery product availability monitoring Australia expands competitive intelligence beyond price. A product may have an attractive price but limited availability, while another SKU may remain consistently available across several retail channels.
Availability became a particularly important consideration during the supply and demand disruptions of 2020-2022. Retailers experienced changes in shopping frequency, product demand, logistics, and inventory patterns. By 2023-2026, availability monitoring had become increasingly relevant to digital grocery operations because online shoppers expect products to be visible and orderable.
| Availability indicator | Intelligence generated |
|---|---|
| In stock | Product currently purchaseable |
| Out of stock | Potential sales or visibility issue |
| Limited availability | Potential supply constraint |
| Temporarily unavailable | Short-term monitoring signal |
| Store-specific availability | Geographic variation |
| Online-only availability | Channel differentiation |
| Product discontinued | Assortment change |
| Substitute product | Competitive opportunity |
The ACCC's final report noted that pricing consistency can vary depending on product category and store format, with differences particularly observed in remote and Northern Australian stores and Woolworths Metro locations.
This makes location-aware data particularly useful. A national dashboard may show that a product is available, while location-level monitoring can reveal that availability differs between Sydney, Melbourne, Brisbane, Perth, Adelaide, and regional markets.
From 2024 to 2026, combining availability data with pricing can provide a richer picture of competitive performance. A price decrease accompanied by an out-of-stock status should not be interpreted in the same way as a price decrease on a consistently available product.
Coles Supermarket Products Data Mapping, Coles Woolworths Aldi grocery price comparison Australia can help create a normalized product structure for cross-retailer analysis.
Product mapping is important because the same grocery item can appear with variations in naming, pack size, descriptions, category hierarchy, promotional labels, and product identifiers. Without normalization, a dataset may incorrectly treat multiple observations of the same product as different SKUs.
A structured mapping framework can connect product name, brand, category, subcategory, pack size, unit, GTIN where available, price, promotional price, availability, retailer, location, and timestamp.
| Data field | Mapping purpose |
|---|---|
| Product name | Product identification |
| Brand | Brand-level analysis |
| Category | Category benchmarking |
| Pack size | Product normalization |
| Unit | Unit-price calculations |
| GTIN/SKU | Product matching |
| Regular price | Baseline pricing |
| Sale price | Promotion analysis |
| Availability | Stock visibility |
| Location | Geographic analysis |
| Timestamp | Historical comparison |
Between 2020 and 2026, this type of historical product structure becomes increasingly valuable because businesses can compare current observations against previous periods rather than rebuilding their product universe every time.
The ACCC's inquiry itself highlights the scale and complexity of supermarket data analysis: its final report states that the inquiry involved analysis of billions of points of supermarket data.
For brands and retailers, product mapping can therefore support repeatable workflows across thousands of SKUs. It can also make dashboards easier to maintain because product records remain connected even when prices, promotions, and availability change.
Actowiz Metrics can help grocery brands and retailers build structured datasets for pricing, assortment, availability, product mapping, promotions, and competitive intelligence. Woolworths Bestselling Grocery Brands Analytics can be incorporated into a broader supermarket intelligence framework to identify leading products, compare brand presence, and monitor category-level movements.
The approach can combine recurring data collection with product matching, normalization, validation, historical storage, and analytics-ready delivery. This is particularly useful when businesses need to monitor thousands of grocery products across Coles, Woolworths, and ALDI rather than manually reviewing individual product pages.
Coles Woolworths Aldi grocery price comparison Australia can be structured around multiple analytical dimensions, including:
The resulting data can support pricing teams, category managers, brand managers, market researchers, e-commerce teams, and competitive intelligence professionals.
Actowiz Metrics can also structure datasets for recurring collection schedules, helping organizations maintain historical records instead of relying on isolated snapshots. This makes it possible to analyze how product prices, availability, and assortment evolve over weeks, months, and years.
Australia's grocery market has undergone substantial changes between 2020 and 2026, with inflation, digital grocery adoption, changing consumer behavior, retailer competition, promotions, and assortment strategies influencing the way brands monitor the market.
Aldi Brand Growth and Marketing Strategy Analysis can benefit from the same structured retail intelligence approach by examining product assortment, pricing, promotional positioning, and availability over time. At the same time, Coles Woolworths Aldi grocery price comparison Australia provides a practical framework for identifying product-level differences across major supermarket channels.
The expansion of online food sales also reinforces the importance of digital data. ABS figures show food online sales rising from $503.0 million in January 2020 to $1,323.7 million in January 2025 and $1,449.9 million in June 2025 on a seasonally adjusted basis.
For grocery brands, the combination of price, product, promotion, availability, and historical data can provide a more complete view of market dynamics. Rather than relying solely on occasional manual price checks, businesses can build recurring datasets that support benchmarking and trend analysis.
Build a scalable Australian grocery intelligence strategy with Actowiz Metrics and turn Coles, Woolworths, and ALDI product data into structured insights for pricing, assortment, availability, and competitive analysis!
Expert blogs, research reports and infographics — practical, data-driven reading across e-commerce and quick-commerce.
Most fields are optional — the more you share, the better your sample.
.webp "infographics")
.webp "infographics")