BLOG




















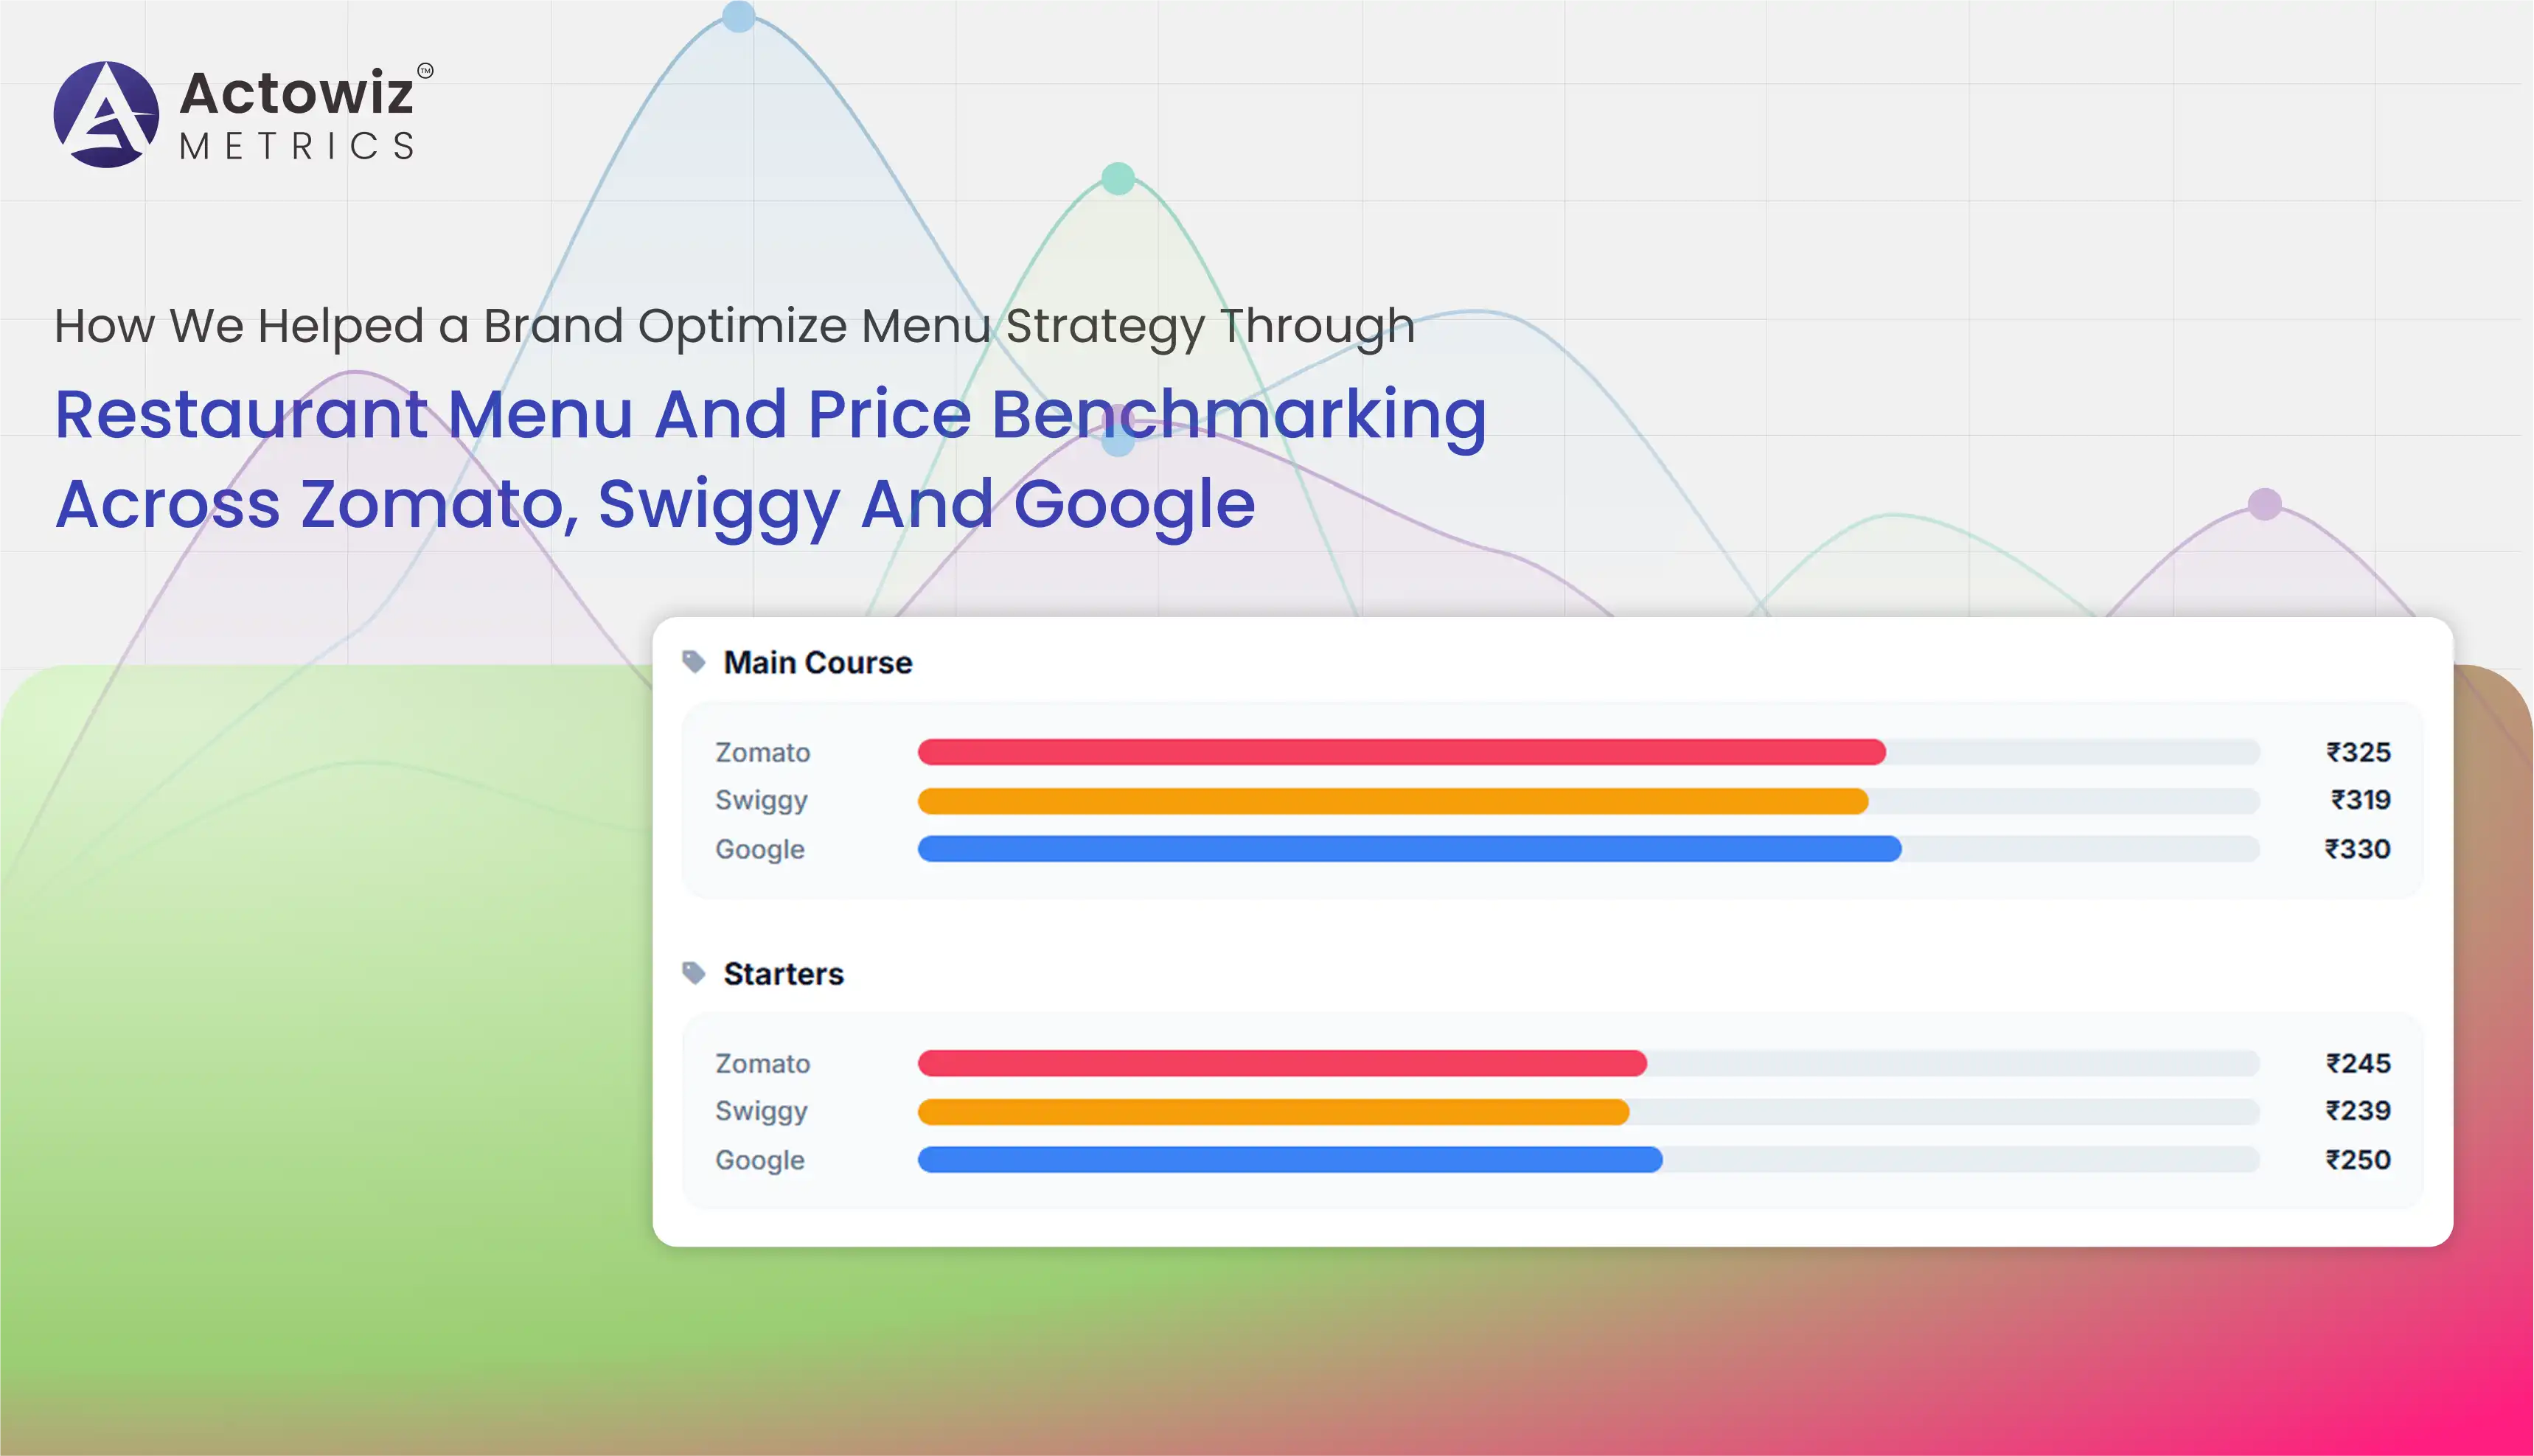
A restaurant and menu data API solves fragmented food-delivery intelligence by standardizing menu, pricing, availability, location, and promotion signals across platforms. For restaurants, aggregators, FMCG brands, and market researchers, this enables faster competitor benchmarking and more reliable pricing decisions.
Food delivery has evolved from a convenience service into a major digital marketplace where restaurants compete on menu breadth, pricing, promotions, ratings, delivery experience, and visibility. That creates a difficult data problem for businesses: the same restaurant can have different prices, menu items, promotions, and availability across platforms and locations.
A Restaurant & Menu Data API provides a structured approach to collecting and organizing these constantly changing signals. Instead of manually checking individual restaurant pages, businesses can create standardized datasets containing restaurant names, cuisines, menu items, prices, discounts, ratings, availability, locations, and other relevant attributes.
The challenge is not limited to websites. Consumers increasingly discover restaurants through mobile applications, making Restaurant Menu Data Extraction from a Mobile App valuable for understanding the information customers actually see.
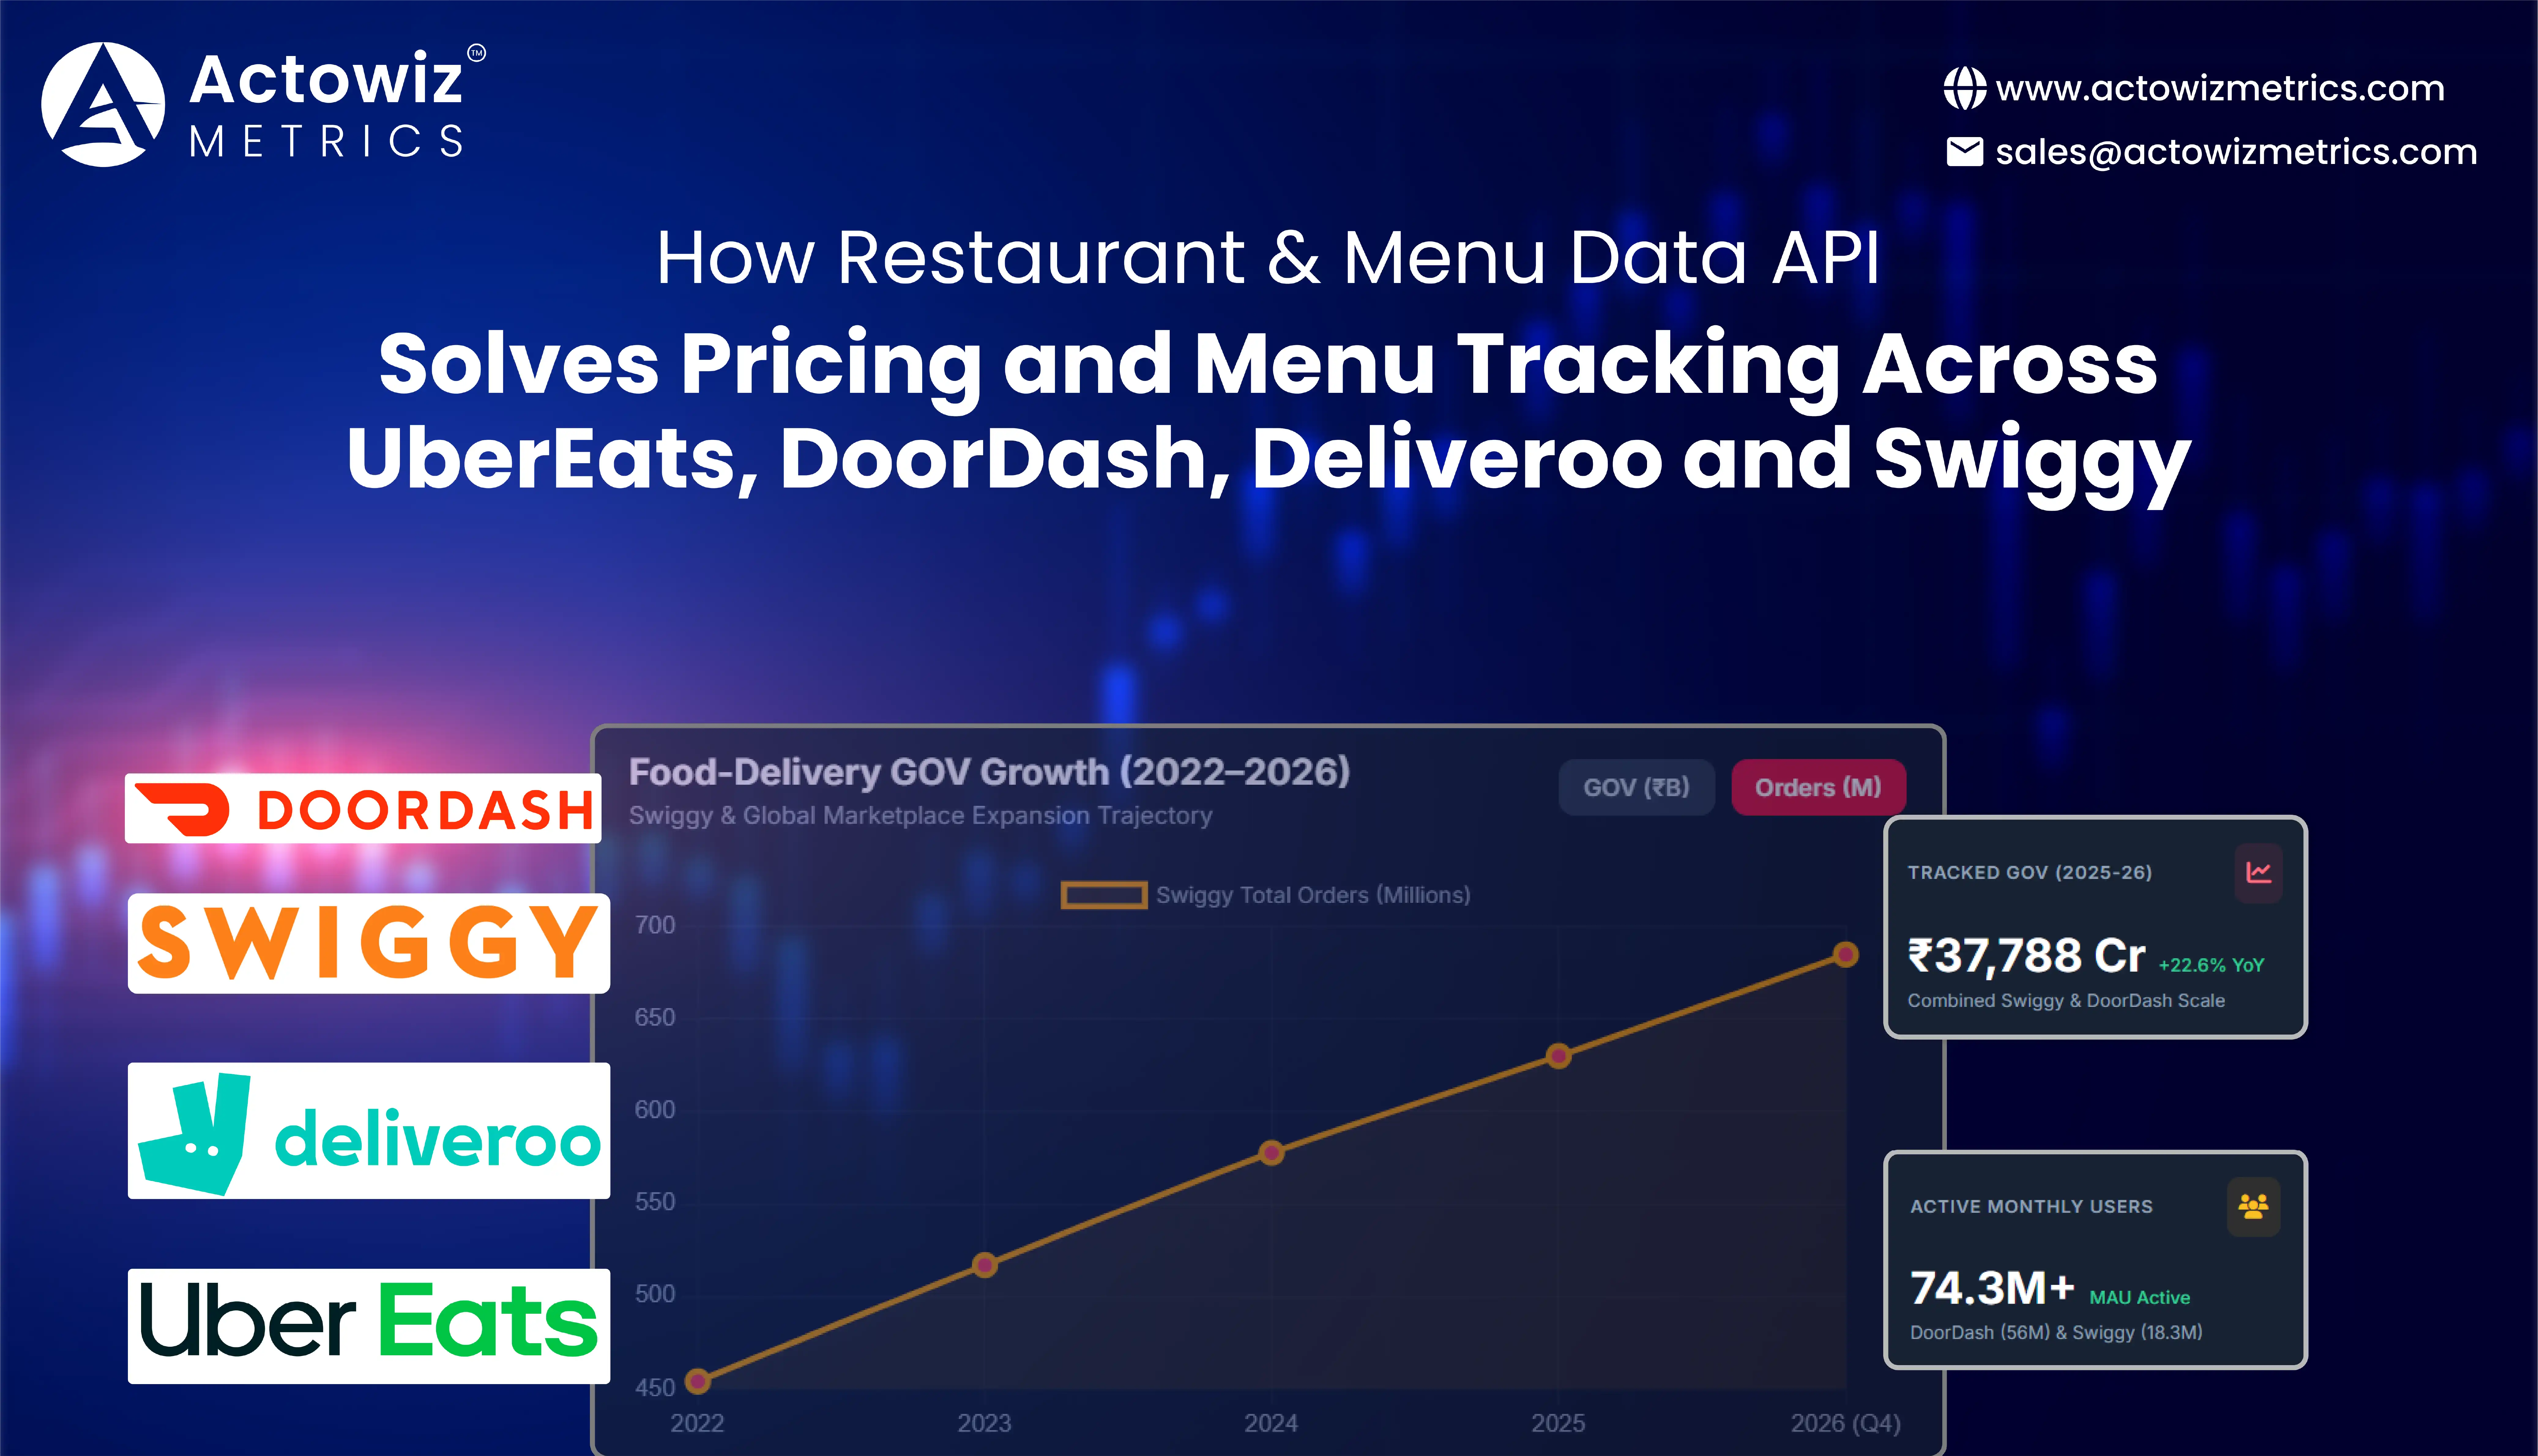
The market scale demonstrates why this intelligence matters. Swiggy reported FY2024–25 food-delivery GOV of ₹28,783 crore, up 16.4% year over year, while its food-delivery service operated across 700+ cities. (Swiggy) DoorDash, meanwhile, reported 2025 Marketplace GOV growth of 27% and more than 56 million monthly active users exiting the year. (DoorDash)
Businesses can Scrape Uber Eats, DoorDash, Deliveroo & Swiggy Restaurant Data to create comparable restaurant-level datasets instead of analyzing each platform independently.
The first challenge is consistency. One platform may display a restaurant's cuisine differently from another. Menu categories can vary, portion descriptions may be inconsistent, and promotional pricing can be presented differently. A structured collection pipeline can normalize these attributes so analysts can compare like-for-like information.
The 2020–2026 period illustrates the increasing importance of digital restaurant data.
| Year | Market development | Data implication |
|---|---|---|
| 2020 | Pandemic accelerated food-delivery adoption | Digital restaurant presence became critical |
| 2021 | Delivery demand remained elevated | Menu and availability monitoring expanded |
| 2022 | Delivery platforms competed for users and merchants | Pricing comparison became more valuable |
| 2023 | Restaurant digitization matured | Cross-platform benchmarking gained importance |
| 2024 | Food-delivery marketplaces continued scaling | Menu intelligence became more granular |
| 2025 | DoorDash exceeded 56M MAUs | Large-scale marketplace monitoring became more relevant |
| 2026 | Swiggy food delivery GOV reached ₹9,005 crore in Q4 FY26 | Recurring restaurant intelligence remains strategically valuable |
Swiggy's FY2026 results show the continued scale of food delivery: food-delivery GOV grew 22.6% year over year to ₹9,005 crore in Q4 FY26, while monthly transacting users reached 18.3 million. Swiggy also reported more than 2.7 lakh restaurant partners across 720+ cities. (Swiggy)
For a restaurant chain, cross-platform monitoring can reveal whether menu prices remain consistent. For a food aggregator, it can identify assortment gaps. For an FMCG or consumer brand, it can reveal which restaurant categories are growing and what products appear most frequently. The important principle is standardization. Every observation should ideally contain a restaurant identifier, platform, location, menu item, price, availability status, promotion information, and collection timestamp. That structure converts scattered platform information into a comparable market dataset.
An Uber Eats, DoorDash, Deliveroo & Swiggy Menu Data API approach can help businesses consolidate restaurant and menu information into a common analytical framework.
Menu intelligence goes beyond collecting dish names. A useful dataset can capture restaurant category, cuisine, menu section, item name, description, price, portion size, dietary labels, add-ons, discounts, ratings, and availability.
This enables businesses to answer commercially relevant questions. Which cuisines have the largest menus? Which restaurants use premium pricing? Which dishes are frequently discounted? Which brands offer similar products at different prices? Which locations have the strongest assortment?
Swiggy's FY2024 data provides an indication of the scale available for analysis. Its food-delivery GOV increased from ₹184.8 billion in FY2022 to ₹247.2 billion in FY2024, while annual orders increased from 454.14 million to 577.74 million. (Swiggy)
| Period | Swiggy food-delivery GOV | Orders |
|---|---|---|
| FY2022 | ₹184.8B | 454.1M |
| FY2023 | ₹215.2B | 516.9M |
| FY2024 | ₹247.2B | 577.7M |
| FY2025 | ₹287.8B | — |
| FY2026 | Continued growth | — |
The table uses Swiggy-reported figures; FY2025 GOV is from its annual report, while FY2026 growth is reported separately. (Swiggy)
For analysts, this scale means even small changes in menu pricing or assortment can become meaningful when observed across thousands of restaurants. A standardized data layer can also support historical comparisons. Instead of asking what a restaurant's menu looks like today, businesses can analyze how its menu evolved over months or years. That creates opportunities for menu innovation tracking, price benchmarking, promotional analysis, cuisine trend research, and restaurant competitive intelligence.
Food Delivery Restaurant & Menu Data Scraping can create the granular information required to understand restaurant-level competition, while DoorDash Bestselling Food Brands Analytics can help identify patterns in popular brands, categories, and menu offerings where relevant data is available.
The analytical value comes from connecting menu structure with commercial signals. A restaurant offering 100 menu items has a different competitive proposition from one offering 25 highly focused products. Likewise, a dish appearing across multiple successful restaurants may indicate broader consumer demand.
| Analytical metric | Business question |
|---|---|
| Menu count | How broad is restaurant assortment? |
| Average menu price | How is the restaurant positioned? |
| Discount frequency | How promotion-driven is the restaurant? |
| Bestseller presence | Which items receive visibility? |
| Cuisine mix | Which food categories dominate? |
| Availability | Which items are consistently offered? |
| Price distribution | Is the menu premium or value-focused? |
DoorDash's scale reinforces the importance of such analysis. In Q4 2025, the company reported 903 million total orders and $29.7 billion in Marketplace GOV, with orders growing 32% year over year. (DoorDash)
In a large marketplace, bestseller and menu signals can help businesses understand demand patterns without relying exclusively on broad industry surveys. For restaurant chains, competitor menus can inform product development. A burger brand might discover that competitors increasingly bundle meals with beverages. A pizza chain could identify changes in topping combinations or portion pricing. A market researcher could identify cuisine categories gaining visibility across multiple locations. For brands and investors, menu intelligence can also reveal expansion patterns. A restaurant chain introducing similar menu structures across multiple cities may indicate a standardized operating model. The strongest datasets therefore combine menu attributes with location, price, promotion, availability, and time.
Food Delivery Restaurant Price & Menu Data Extraction helps businesses understand how restaurants position their offerings across platforms, locations, and time periods.
Pricing is particularly complicated in food delivery because the customer-facing price can be affected by promotions, platform fees, restaurant-level discounts, bundles, and location-specific factors. A simple menu-price snapshot therefore provides limited intelligence. A historical dataset is more useful because it shows whether a price is stable, promotional, seasonal, or part of a broader repositioning strategy.
The market continued expanding between 2020 and 2026, increasing the importance of reliable pricing intelligence.
| Year | Pricing environment | Intelligence opportunity |
|---|---|---|
| 2020 | Restaurants shifted rapidly to delivery | Establish digital menu baselines |
| 2021 | Delivery remained important | Track menu normalization |
| 2022 | Competition and inflation affected pricing | Monitor price movements |
| 2023 | Digital ordering matured | Compare cross-platform pricing |
| 2024 | Large delivery marketplaces scaled | Expand restaurant benchmarks |
| 2025 | DoorDash orders and GOV grew strongly | Monitor high-frequency price changes |
| 2026 | Swiggy food-delivery growth accelerated | Maintain continuous price intelligence |
Swiggy reported AOV of ₹514 in FY2024–25, up 11.8% year over year. (Swiggy) This demonstrates why order-value and menu-price signals can be useful together: menu prices influence basket construction, while basket data provides context for pricing strategy.
Businesses can calculate metrics such as median menu price, average price by cuisine, price per portion, promotional discount rate, and competitor price gap. These metrics can then be segmented by city, neighborhood, cuisine, restaurant chain, platform, or menu category. For pricing teams, this is more actionable than simply collecting restaurant names. It provides evidence for identifying pricing opportunities and understanding competitive positioning.
Location-Based Food Delivery Restaurant Analytics allows businesses to connect restaurant and menu information with geography.
Restaurant competition is inherently local. Two restaurants belonging to the same chain may face different competitive conditions because their neighborhoods have different demographics, restaurant density, cuisines, pricing levels, and customer behavior.
Swiggy's FY2025 annual report highlighted expansion into underserved markets, including outskirts of major cities and Tier 2 towns. Its food-delivery service operated across 700+ cities. (Swiggy)
| Geographic signal | Potential insight |
|---|---|
| Restaurant density | Competitive intensity |
| Cuisine availability | Local consumer choice |
| Average menu price | Market positioning |
| Discount frequency | Local promotional competition |
| Restaurant ratings | Customer perception |
| Delivery coverage | Service accessibility |
| Menu assortment | Local category depth |
Location-level data can help identify food deserts, oversaturated categories, emerging cuisines, and premium-market clusters. For example, a restaurant brand considering expansion can compare the number of competing restaurants within a delivery radius, average menu prices, popular cuisines, and promotional intensity. A food-delivery platform can use similar intelligence to understand where merchant acquisition opportunities exist. FMCG brands can also benefit. A beverage or packaged-food company could examine which restaurant categories dominate specific markets and identify potential partnership opportunities. The geographic dimension makes the data more actionable because the same menu strategy may perform differently across markets.
Food Delivery Competitor Menu Intelligence helps restaurants and food businesses understand the strategies being used by competing brands.
Competitor analysis can include menu size, cuisine positioning, pricing tiers, promotions, bundles, bestselling categories, new products, ratings, and availability. Historical snapshots can then show whether competitors are expanding, simplifying, or repositioning their menus.
The importance of this intelligence grows as platforms become larger. DoorDash reported more than 56 million monthly active users at the end of 2025 and more than 35 million members across DashPass, Wolt+, and Deliveroo Plus. (DoorDash) In Q2 2026, DoorDash reported 970 million orders and $33.1 billion in Marketplace GOV. (DoorDash)
| Competitive metric | Strategic application |
|---|---|
| Average menu price | Pricing benchmark |
| Menu size | Assortment comparison |
| New items | Innovation tracking |
| Promotions | Discount benchmarking |
| Ratings | Customer perception |
| Bestseller categories | Demand analysis |
| Cuisine mix | Market positioning |
| Location coverage | Expansion research |
A restaurant can compare its menu against direct competitors and identify gaps. If three competing restaurants offer meal bundles but one does not, the missing bundle may represent a potential product opportunity. Likewise, if a competitor consistently prices a comparable dish 15% below the market median, a restaurant can investigate whether that price is supported by smaller portions, aggressive promotions, or a different cost structure. This makes competitor intelligence diagnostic rather than merely descriptive.
Swiggy Bestselling Food Brands Analytics can help businesses understand brand visibility, menu positioning, pricing patterns, and category-level competition where suitable public marketplace signals are available.
Actowiz Metrics can structure restaurant information into datasets that connect menus, prices, categories, locations, promotions, availability, ratings, and timestamps. This allows businesses to compare restaurants across multiple markets and monitor changes over time.
The Restaurant & Menu Data API approach can also support recurring delivery of processed data to dashboards, databases, analytics platforms, and internal research systems.
For restaurant chains, the workflow can support menu benchmarking and competitor analysis. For food-delivery businesses, it can support merchant intelligence and category research. For market researchers, it can create historical datasets for pricing and assortment studies.
A practical implementation might track thousands of restaurants across selected cities and collect their menu information on a recurring schedule. The resulting data can then be normalized by cuisine, category, restaurant chain, location, and price range. The objective is not simply to gather a large volume of menu records. The objective is to create reliable, comparable, timestamped intelligence that decision-makers can use.
Food-delivery competition increasingly depends on more than delivery speed. Restaurant selection, menu variety, price positioning, promotions, availability, ratings, and location all influence the digital customer experience.
The 2020–2026 period shows how quickly this market has scaled. Swiggy reported FY2025 food-delivery GOV of ₹28,783 crore and 14.7 million monthly transacting users, while its FY2026 results showed food-delivery GOV growth of 22.6% year over year in Q4. (Swiggy) DoorDash reported 903 million orders in Q4 2025 and continued strong growth into 2026. (DoorDash)
For restaurants, brands, aggregators, and market researchers, Uber Eats Bestselling Brands Analytics can provide another layer of competitive understanding when bestseller and product-visibility signals are available.
A Restaurant & Menu Data API can bring these fragmented signals together into a structured intelligence layer, enabling businesses to monitor pricing, menus, promotions, availability, locations, and competitor strategies more efficiently.
Build a scalable restaurant intelligence workflow with Actowiz Metrics and turn multi-platform menu, pricing, and restaurant data into actionable competitive insights!
Expert blogs, research reports and infographics — practical, data-driven reading across e-commerce and quick-commerce.
Most fields are optional — the more you share, the better your sample.
.webp "infographics")
.webp "infographics")