BLOG




















Grocery pricing has become increasingly dynamic across developed retail markets. Inflation, supply-chain costs, private-label expansion, promotions, changing consumer preferences, and the rapid growth of online grocery have made price benchmarking an important strategic activity for retailers, FMCG manufacturers, distributors, and investors.
The Multi-Market Grocery Price Index provides a structured framework for comparing grocery prices across the USA, UK, Australia and Canada. Rather than relying on national averages alone, a multi-market approach can evaluate identical or comparable products across retailers, cities, categories, pack sizes, brands, and promotional periods.
The period from 2020 to 2026 has been particularly significant. The pandemic changed shopping behavior and accelerated e-commerce adoption, while subsequent inflationary pressures created substantial differences in food-price movements between countries. Businesses consequently need granular data to understand whether price changes reflect broader inflation, retailer strategy, supplier costs, promotional activity, or competitive positioning.
The importance of online grocery is also growing. Grand View Research estimates the global online grocery market will reach $1.24 trillion by 2030, growing at a CAGR of 12.4% from 2024 to 2030.
For brands operating internationally, Grocery and FMCG digital shelf analytics can provide visibility into product prices, promotions, availability, assortment, ratings, and competitive positioning across digital retailers.
Grocery prices do not move uniformly across countries. Differences in agricultural production, transportation, labor costs, taxation, currency movements, retailer concentration, private-label penetration, and consumer behavior can produce substantially different pricing outcomes.
The United States, United Kingdom, Australia, and Canada all experienced significant food-price changes after 2020. The pandemic initially disrupted supply chains, followed by commodity, energy, transportation, and labor-cost pressures. Food inflation accelerated in 2022 across many developed economies before gradually moderating.
For international brands, Grocery pricing intelligence across countries helps separate broad inflationary effects from retailer-specific price movements. A cereal product increasing 8% in one country while increasing 3% in another may reflect differences in input costs, exchange rates, competitive intensity, or retailer promotions.
| Country | Approx. Food CPI Increase, 2022* | 2023 Trend | 2024 Trend |
|---|---|---|---|
| USA | ~10% | Moderating | Slower growth |
| UK | ~16% | High but easing | Moderating |
| Australia | ~9% | Moderating | Slower growth |
| Canada | ~10% | Moderating | Slower growth |
*Approximate peak/annual food inflation indicators based on national statistical releases and OECD/World Bank datasets; methodologies vary between countries.
The United Kingdom experienced particularly strong food inflation. The UK's Office for National Statistics reported food and non-alcoholic beverage inflation reaching 19.2% in March 2023, the highest rate in more than 45 years.
In Canada, food purchased from stores rose 9.8% in 2022, according to Statistics Canada.
These variations demonstrate why global grocery benchmarking requires country-level data. A multinational brand cannot assume that a price strategy successful in the United States will perform identically in the United Kingdom, Australia, or Canada.
A major challenge in international grocery research is creating valid product comparisons. A simple price comparison may produce misleading results if package sizes, formulations, currencies, taxes, or promotional conditions differ.
Between 2020 and 2022, businesses increasingly focused on supply-chain resilience and cost management. From 2023 onward, attention shifted toward understanding how retailers passed higher costs to consumers and how competitors responded.
Cross-market grocery price analysis can normalize prices according to pack size, unit weight, volume, brand, category, and currency.
For example, a 500g cereal package in the United Kingdom should not simply be compared with a 750g package in the United States. A more meaningful analysis calculates price per 100g or another standardized unit.
| Data Point | Purpose |
|---|---|
| Product name | Product matching |
| Brand | Brand comparison |
| Pack size | Size normalization |
| Unit price | Comparable benchmark |
| Currency | International conversion |
| Promotion | Promotional adjustment |
| Retailer | Competitive comparison |
| Country | Geographic segmentation |
| Timestamp | Historical tracking |
This approach can reveal whether a brand's effective pricing position differs across countries.
The online grocery environment makes this particularly relevant because consumers can compare products and prices more easily. According to the U.S. Census Bureau, e-commerce represented 16.4% of total U.S. retail sales in 2025.
As digital shopping becomes more integrated into grocery behavior, brands need visibility into how products appear to consumers across different markets.
Cross-border comparisons can also identify private-label pressure. A national brand may have a strong price premium in one country but face a narrower gap against supermarket private labels in another.
The competitive grocery landscape across the four target countries includes major supermarket groups, discount retailers, warehouse clubs, convenience operators, and online grocery platforms.
The United States includes retailers such as Walmart, Kroger, Costco, Target, and Amazon Fresh. The United Kingdom includes Tesco, Sainsbury's, Asda, Morrisons, Aldi, and Lidl. Australia has major players including Woolworths, Coles, Aldi, and Costco, while Canada includes Loblaw, Sobeys, Metro, Walmart, and Costco.
Monitoring these retailers enables businesses to understand differences in pricing, assortment, promotions, and private-label positioning.
Multi-country supermarket price monitoring becomes especially useful for multinational FMCG manufacturers. A brand can determine whether its products maintain consistent pricing architecture across retailers or whether local retailers create significant price deviations.
| Market | Major Supermarket/Retail Groups |
|---|---|
| USA | Walmart, Kroger, Costco, Target |
| UK | Tesco, Sainsbury's, Asda, Aldi, Lidl |
| Australia | Woolworths, Coles, Aldi, Costco |
| Canada | Loblaw, Sobeys, Metro, Walmart |
Retail concentration also influences price competition. The Australian Competition and Consumer Commission has highlighted the significance of Australia's supermarket sector and its concentration around major chains.
Monitoring should therefore cover more than the headline price. Important fields include promotions, loyalty prices, multi-buy offers, temporary discounts, product availability, pack sizes, and retailer-specific assortment.
Historical monitoring from 2020 through 2026 can reveal whether a retailer consistently positions itself as a premium, mainstream, or value-oriented competitor.
For manufacturers, this information can support retailer negotiations and international pricing strategy. For retailers, it can help benchmark competitors and identify products where pricing is materially above or below the market.
FMCG markets have undergone considerable changes since 2020. Supply-chain disruption, inflation, private-label growth, changing consumer priorities, and promotional pressure have all influenced product positioning.
In 2020–2021, many consumers prioritized availability and essential products. During 2022, inflation became a dominant consideration. In 2023–2024, consumers increasingly sought value, while retailers expanded private-label offerings and promotions. By 2025–2026, brands were balancing premiumization with affordability.
International FMCG market intelligence enables companies to understand these changes across countries rather than evaluating markets independently.
| Indicator | Strategic Significance |
|---|---|
| Average selling price | Market positioning |
| Price premium | Brand strength |
| Promotion depth | Competitive pressure |
| Private-label gap | Retailer competition |
| Availability | Distribution strength |
| Assortment breadth | Market penetration |
| Review rating | Consumer perception |
| Price volatility | Market stability |
Private labels have become increasingly important in several developed markets. NielsenIQ reported that private-label sales reached record levels globally in 2024, with private-label dollar sales growing across many markets.
This creates an important benchmarking opportunity. A manufacturer can compare its products against both competing national brands and private-label alternatives.
For example, if a branded pasta product commands a 35% premium over a retailer's private label in one market but only 15% in another, the difference may indicate varying consumer loyalty, competitive intensity, or retailer positioning.
International FMCG intelligence therefore supports pricing, portfolio management, market-entry decisions, promotional planning, and competitive strategy.
A useful international grocery index must account for more than absolute prices. Currency fluctuations, local inflation, package sizes, taxes, promotional mechanics, and category differences all influence the final comparison.
From 2020 to 2026, currency volatility added another dimension to international price benchmarking. A product may become more expensive in local currency while remaining relatively stable after currency normalization.
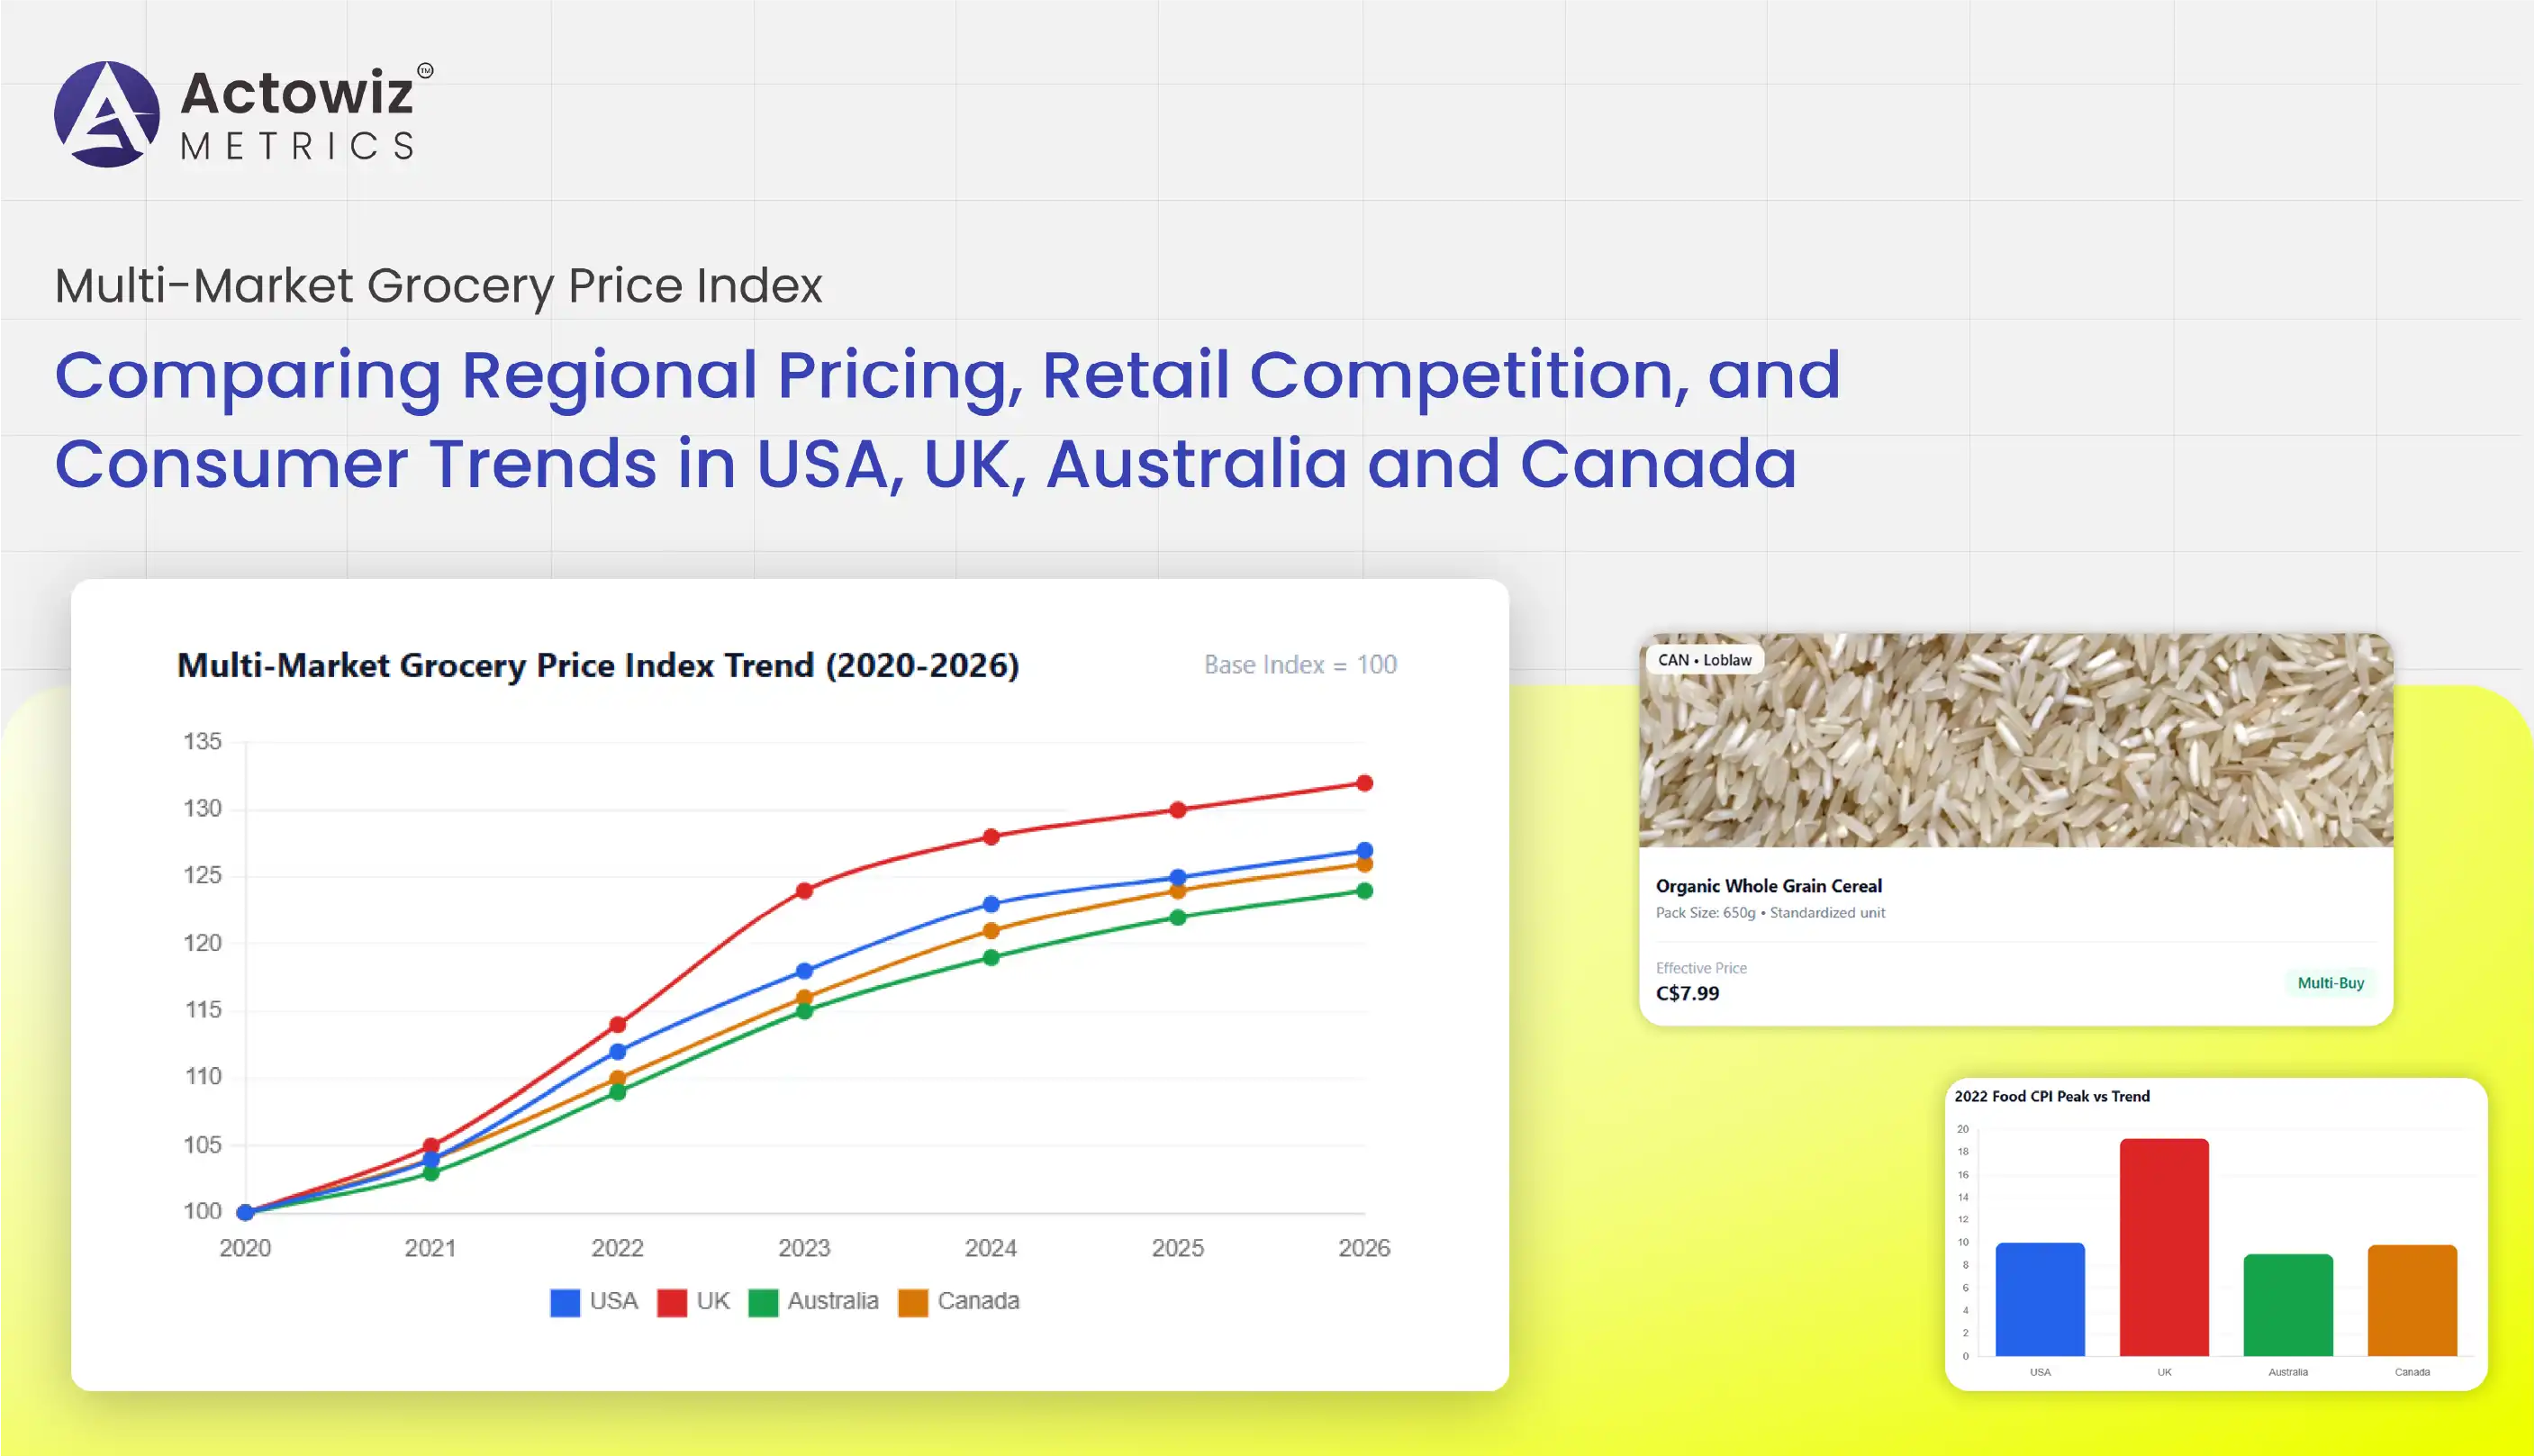
The International grocery price index approach can assign a standardized base value to a basket of comparable products and track how that basket changes over time.
| Market | Base Index 2020 | 2022 | 2024 | 2026 |
|---|---|---|---|---|
| USA | 100 | 112 | 123 | 127 |
| UK | 100 | 114 | 128 | 132 |
| Australia | 100 | 109 | 119 | 124 |
| Canada | 100 | 110 | 121 | 126 |
Illustrative analytical framework, not official national CPI data.
The index can be calculated using a standardized basket of products such as milk, eggs, bread, cereals, pasta, rice, coffee, cooking oil, soft drinks, household cleaners, personal-care products, and packaged foods.
The advantage is that businesses can observe relative movement rather than relying only on individual SKU prices.
For example, if the overall index rises 10% while one brand's basket increases 18%, the brand may be losing price competitiveness. Conversely, a 5% increase could indicate a stronger value position.
An index can also be segmented by category, retailer, brand, city, and product tier.
This enables businesses to answer questions such as:
Such insights turn raw retail pricing observations into a repeatable analytical framework.
Price benchmarking becomes substantially more valuable when promotional activity is included. A product listed at $5 may effectively sell for $4 during a promotion, while a competing product listed at $4.50 may have no discount.
Consequently, Price & promotion intelligence, Multi-Market Grocery Price Index should evaluate both standard and effective prices.
The period from 2020 to 2026 demonstrates why this matters. Promotional activity changed as retailers moved through pandemic disruption, inflation, cost pressures, and changing consumer demand.
| Metric | Application |
|---|---|
| Regular price | Baseline benchmark |
| Promotional price | Effective price |
| Discount percentage | Promotion depth |
| Multi-buy offer | Basket economics |
| Loyalty price | Member value |
| Promotion frequency | Retailer strategy |
| Price gap | Competitive positioning |
| Price volatility | Market movement |
For brands, promotional monitoring can reveal where competitors are discounting most aggressively.
Suppose a coffee brand is priced at $8.99 in the United States, £7.49 in the United Kingdom, A$12.50 in Australia, and C$10.99 in Canada. The nominal prices alone do not reveal the full competitive position.
Currency conversion, purchasing power, package size, taxes, and promotion status need to be incorporated into the analysis.
The same framework can identify retailer-specific behavior. A retailer may maintain relatively high everyday prices but compensate through frequent loyalty promotions. Another may operate with consistently low prices and fewer temporary promotions.
Understanding these differences can help FMCG manufacturers determine where to allocate promotional budgets and how to structure retailer-specific pricing strategies.
For retailers, competitive price monitoring can highlight where pricing is uncompetitive and where promotional investment could have the greatest impact.
Actowiz Metrics can help brands, retailers, FMCG manufacturers, and market researchers transform fragmented grocery information into structured international intelligence.
The Multi-Market Grocery Price Index approach provides a framework for comparing prices, promotions, product availability, assortment, and competitive positioning across the USA, UK, Australia, and Canada.
Actowiz Metrics can support data collection across retailer websites, digital marketplaces, product catalogs, and other publicly accessible sources, subject to applicable laws, platform terms, and technical restrictions.
The resulting datasets can be normalized by product, pack size, category, currency, retailer, market, and timestamp. This allows organizations to build historical benchmarks and identify meaningful pricing changes.
The framework can also support retailer-specific analysis. Businesses can compare Walmart vs. Kroger, Tesco vs. Sainsbury's, Woolworths vs. Coles, or Loblaw vs. Sobeys to understand differences in price positioning and promotional activity.
With automated monitoring and analytics-ready datasets, teams can reduce manual research and gain faster visibility into changing market conditions.
For multinational FMCG companies, this can support international pricing strategies, retailer negotiations, market expansion, promotion planning, assortment decisions, and competitive benchmarking.
The Multi-Market Grocery Price Index provides a practical framework for understanding how grocery and FMCG prices evolve across the USA, UK, Australia, and Canada.
Between 2020 and 2026, grocery markets experienced unprecedented changes. Pandemic disruption altered purchasing patterns, supply-chain challenges affected costs, food inflation increased significantly in several markets, and consumers subsequently became more value-conscious.
The UK experienced particularly strong food inflation, with food and non-alcoholic beverage prices rising 19.2% year over year in March 2023. Canada also experienced a 9.8% increase in food purchased from stores during 2022.
These differences demonstrate why international businesses need granular, comparable pricing information rather than relying solely on national inflation statistics.
A comprehensive grocery index can combine SKU-level prices, pack sizes, currencies, promotions, retailer information, availability, and historical observations. This enables brands and retailers to understand not only where prices are changing but also why competitive positions are shifting.
As online grocery continues expanding, digital shelf data will become increasingly important for maintaining visibility across markets. Automated monitoring can provide the frequency and scale required to compare thousands of products across multiple retailers and countries.
Ready to benchmark grocery prices and competitive movements across global markets? Partner with Actowiz Metrics to transform multi-market retail data into actionable pricing, promotion, and FMCG intelligence!
Expert blogs, research reports and infographics — practical, data-driven reading across e-commerce and quick-commerce.
Most fields are optional — the more you share, the better your sample.
.webp "infographics")
.webp "infographics")