BLOG
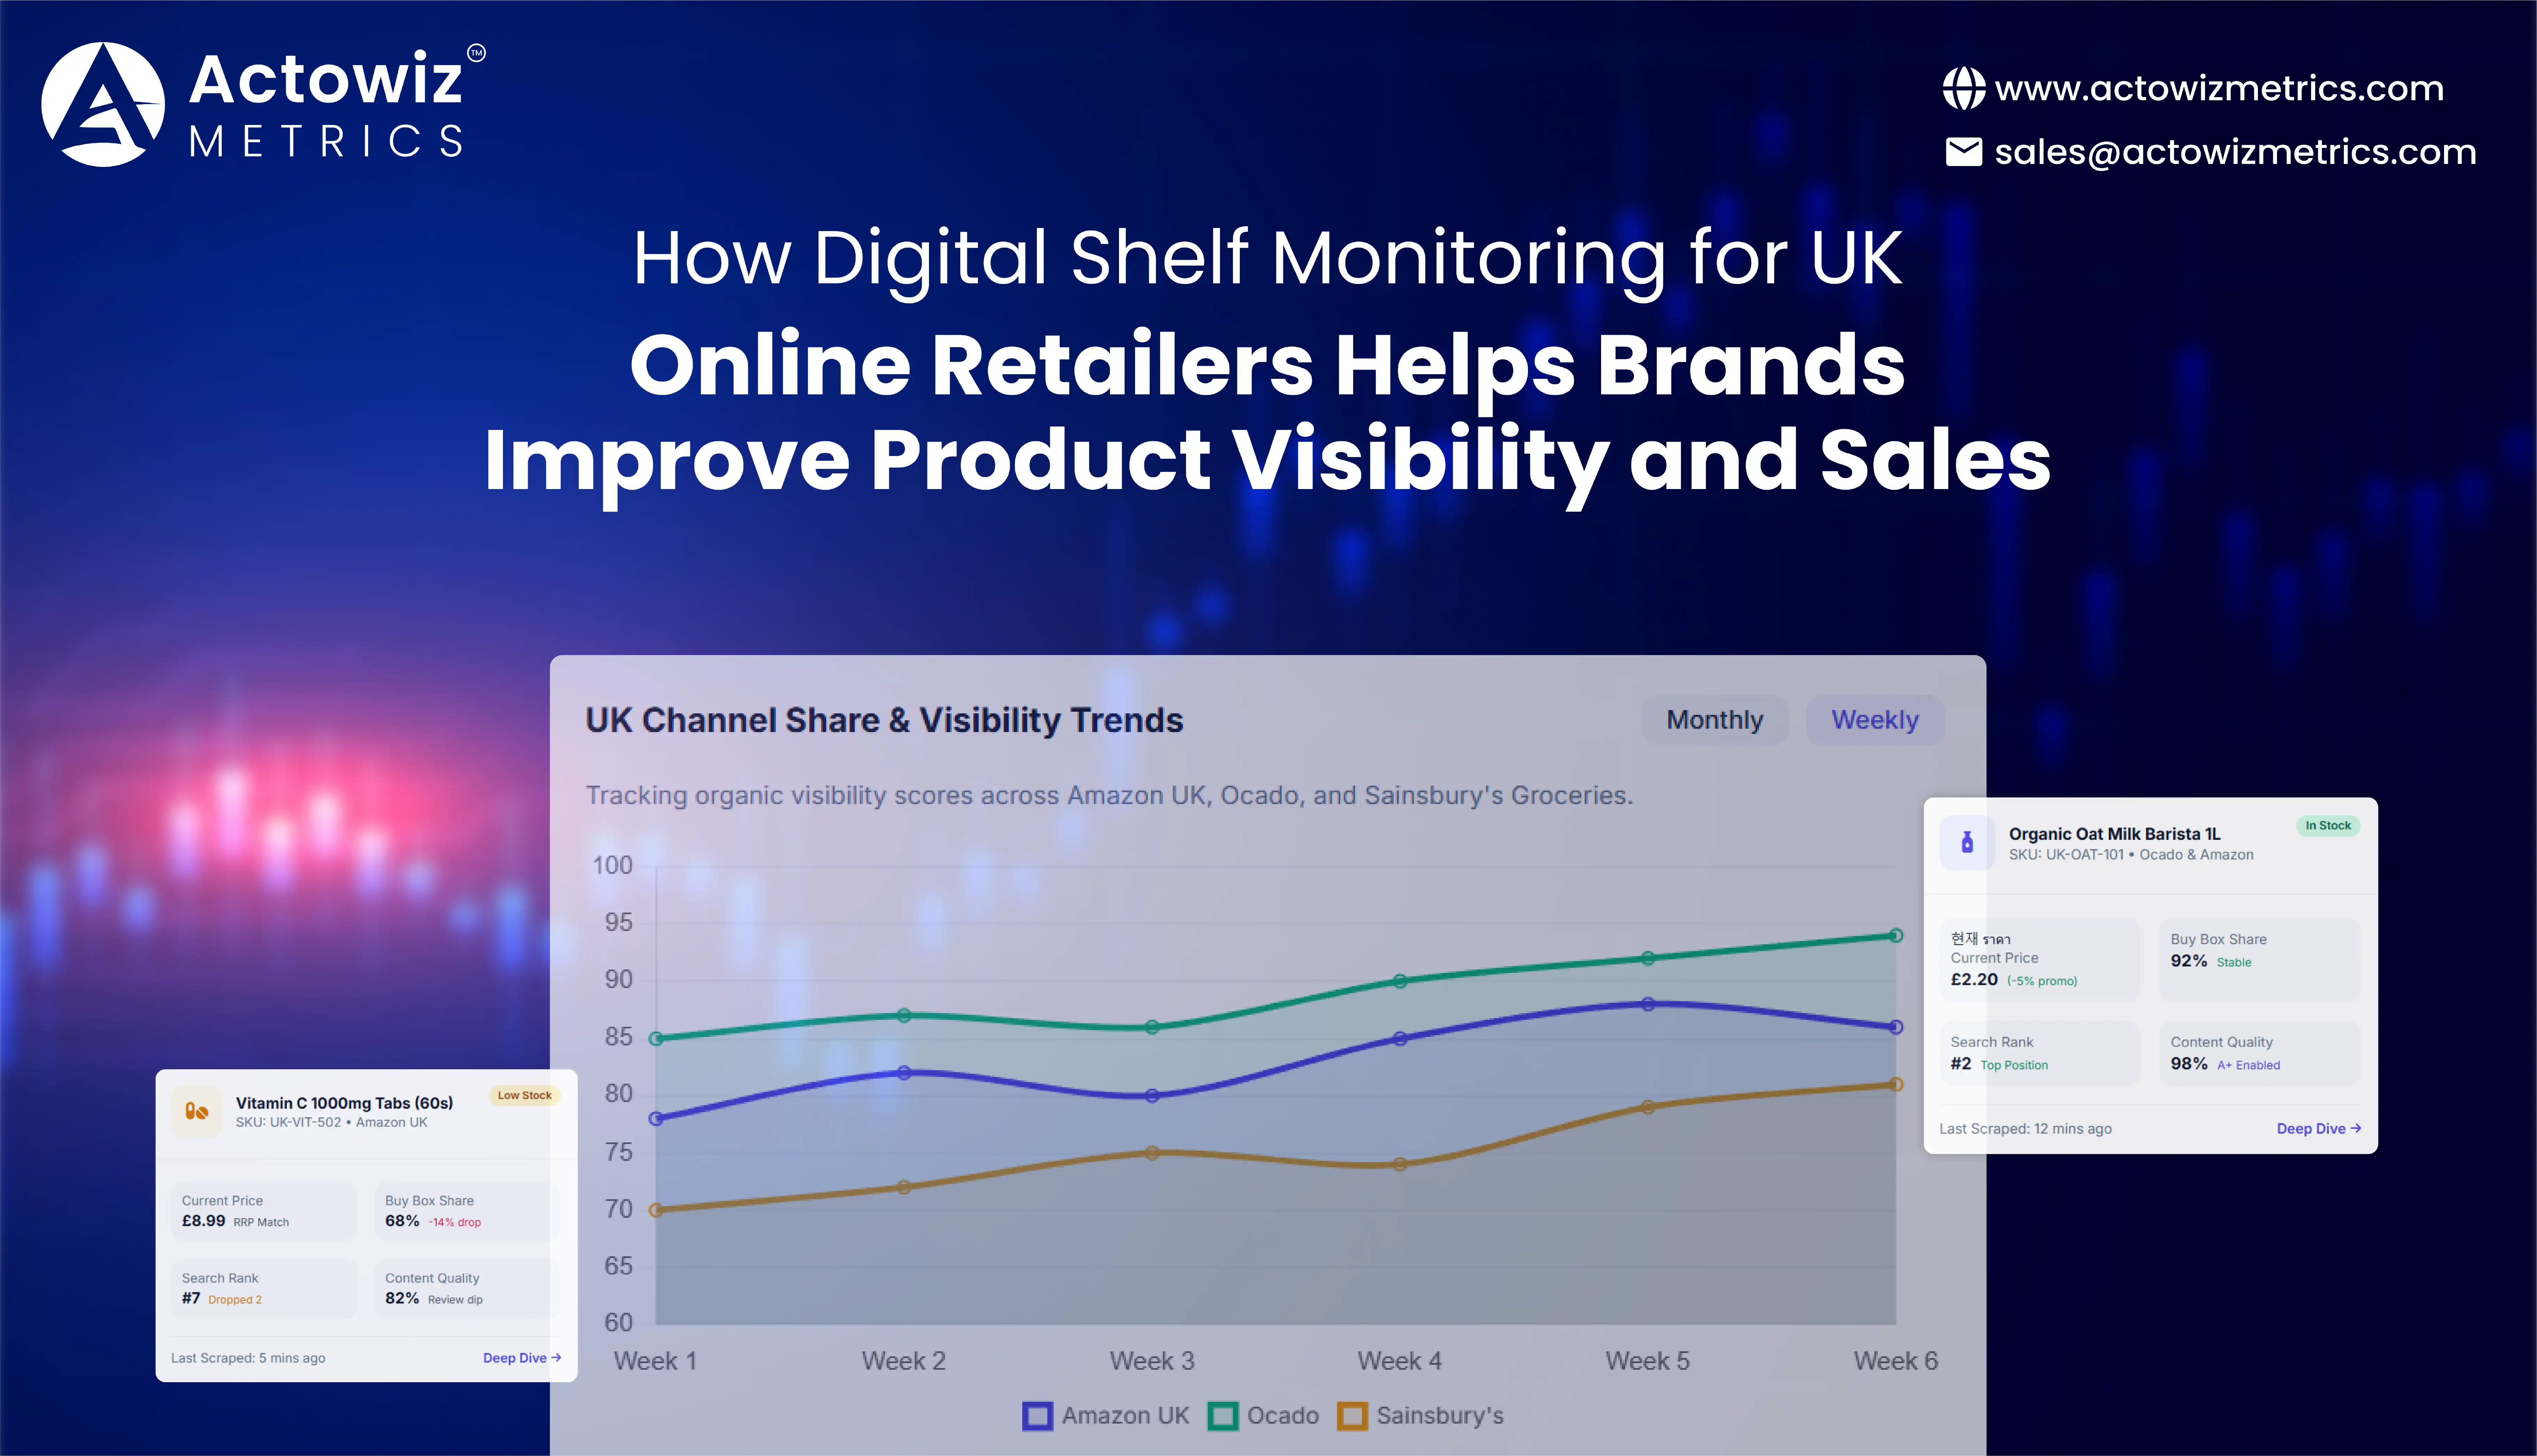




















Digital Shelf Monitoring for UK Online Retailers helps brands identify pricing gaps, stock availability issues, ranking changes, assortment differences, and competitor activity that can directly affect online product visibility and sales. For UK brands managing products across Amazon, Ocado, Sainsbury's, and other digital channels, continuous monitoring turns scattered marketplace signals into actionable commercial intelligence.
The UK digital retail environment is highly competitive. Online sales represented 27.4% of total retail sales in 2025, according to the Office for National Statistics (ONS). The proportion reached 27.8% in Q2 2026, showing that online shopping remains a substantial part of UK retail.
For an e-commerce director, digital shelf manager, category manager, or brand intelligence team, the problem is no longer simply getting products listed online. The bigger challenge is maintaining visibility, availability, competitive pricing, content quality, and discoverability across multiple retailers.
This makes digital shelf intelligence particularly important for brands asking:
A reliable monitoring program answers these questions using recurring product-level data rather than occasional manual checks.
Digital Shelf Data Collection Across UK Retailers allows brands to create a structured view of product performance across multiple online channels.
A digital shelf includes much more than product listings. It includes every customer-facing element that influences product discovery and purchase decisions.
A useful collection framework can include:
| Data Element | What It Reveals | Business Use |
|---|---|---|
| Product name | Listing accuracy | Content governance |
| Brand | Brand presence | Market visibility |
| Price | Current selling position | Price benchmarking |
| Discount | Promotional intensity | Promotion analysis |
| Availability | Stock status | Availability monitoring |
| Product URL | Listing location | Shelf auditing |
| Category | Product placement | Assortment analysis |
| Reviews | Customer feedback | Reputation monitoring |
| Rating | Customer perception | Product quality tracking |
| Images | Visual presentation | Content optimization |
| Product attributes | Feature positioning | Competitive comparison |
| Seller information | Marketplace competition | Seller intelligence |
The need for this visibility is supported by the scale of online retail in Britain. ONS data shows internet sales reached 27.4% of total retail sales in 2025, compared with 19.2% in 2019. For brands, this means the online shelf cannot be treated as a secondary channel.
A practical workflow starts with defining a product universe.
For example, a consumer brand could monitor:
500 SKUs × 6 retailers × 30 days = 90,000 daily product observations.
Instead of asking an analyst to manually check thousands of pages, automated collection can create timestamped records for every monitored SKU.
This allows the brand to identify:
The most useful insight is often not the current value but the change from the previous observation.
UK E-Commerce Product Ranking and Visibility Analytics helps brands understand whether their products are discoverable and competitively positioned.
Visibility can be influenced by several factors. A product may be technically listed but still have weak commercial visibility because it is buried in category pages, unavailable, priced above competitors, or missing important content.
Brands should therefore track visibility using a combination of signals.
| Signal | Example Measurement | Interpretation |
|---|---|---|
| Search position | Position 8 | Strong visibility |
| Category position | Top 20 | Competitive |
| Availability | 98% | Strong execution |
| Price index | 102 | Slightly above benchmark |
| Rating | 4.5/5 | Positive perception |
| Review volume | 2,400 | Strong social proof |
| Content completeness | 95% | Strong listing quality |
| Promotion | 10% discount | Competitive offer |
Illustrative framework; values are not retailer-reported benchmarks.
A useful internal visibility score can combine these variables. For example:
Visibility Score = Search Position + Availability + Price Competitiveness + Content Quality + Customer Signals
The exact weighting should vary by category.
A grocery brand may prioritize availability and price. A fashion brand may prioritize product images, assortment, ratings, and promotional visibility. An electronics brand may place greater emphasis on specifications, reviews, seller information, and price. The important principle is to avoid treating one metric as the complete picture.
ONS reported that online spending values in Q4 2025 were 8.4% higher than Q4 2024, while online sales values increased 11.1% year over year in December 2025.
As online spending grows, visibility becomes increasingly connected to revenue opportunity.
A product that is unavailable, incorrectly categorised, or consistently less competitive may lose sales even when consumer demand exists.
Ocado Product Availability and Digital Shelf Monitoring can help grocery brands identify availability gaps, assortment changes, and competitive pricing differences on one of the UK's major online grocery platforms.
Availability is particularly important in grocery because purchase decisions can be immediate. If a customer searches for a familiar product and finds it unavailable, the customer may select an alternative instead of waiting.
Ocado describes its platform as offering a broad selection of major brands, independent products, M&S Food, and Ocado own-range products. Its website also highlights its Price Promise, which matches like-for-like shopping against Tesco.com on more than 10,000 products.
This creates several monitoring opportunities for brands.
| Monitoring Area | Example Question |
|---|---|
| Availability | Is the SKU currently available? |
| Price | Has the selling price changed? |
| Promotion | Is the competitor discounted? |
| Pack size | Are comparable pack sizes available? |
| Range | Is the complete assortment listed? |
| Product content | Are descriptions and images accurate? |
| Substitutions | Are alternative products appearing? |
| Competitor presence | Which competing SKUs are listed? |
A recurring dataset can reveal patterns that manual checks miss.
For example, suppose a brand discovers that one product is unavailable on Ocado for 14% of monitored observations while its main competitor remains available 98% of the time.
That does not automatically prove lost sales, but it creates a clear commercial question:
Is inconsistent availability reducing the brand's opportunity to convert demand?
This is the type of question digital shelf monitoring should help commercial teams investigate.
Sainsbury's Online Product Visibility Monitoring gives brands a structured way to evaluate product presence, pricing, promotions, and assortment across Sainsbury's digital shopping environment.
Sainsbury's has continued investing heavily in price competitiveness and online shopping. Its 2025 annual report stated that the company had invested more than £1 billion in lowering prices over four years. It also reported more than 9,000 Nectar Prices offers and more than £2 billion in customer savings through Nectar Prices during the year.
This illustrates why price and promotion monitoring are important for brands selling through the channel.
A brand can monitor:
| Product | Brand Price | Competitor Price | Discount | Availability |
|---|---|---|---|---|
| Product A | £4.50 | £4.25 | 10% | In stock |
| Product B | £6.99 | £6.99 | 0% | In stock |
| Product C | £3.75 | £3.49 | 15% | Limited |
| Product D | £8.50 | £7.99 | 5% | In stock |
Illustrative data.
The purpose is not simply to identify who is cheapest.
A stronger approach asks:
Where is price disadvantage combined with visibility disadvantage?
A product priced 5% above a competitor may remain commercially strong if it has superior ratings, content, availability, or brand recognition. However, a product priced 10% higher while also being out of stock and poorly represented may require immediate attention.
Amazon UK Product Visibility Analytics helps brands monitor the marketplace signals that influence how products appear and compete on Amazon.co.uk.
Amazon's UK marketplace is substantial. Amazon says around 100,000 UK small and medium-sized businesses sell on Amazon, and UK small businesses generated more than £3.8 billion in export sales in 2024. Amazon also says around 60% of its sales come from small businesses, which sold more than one billion products in 2024.
For brands, this means the digital shelf can contain significant competition.
Monitoring can include:
| Amazon Signal | Why It Matters |
|---|---|
| Search position | Measures discoverability |
| Best Sellers Rank | Indicates relative category performance |
| Price | Tracks competitive position |
| Buy Box/seller information | Helps understand selling dynamics |
| Reviews | Measures customer response |
| Rating | Indicates product perception |
| Availability | Identifies stock risks |
| Product content | Measures listing quality |
| Images | Supports visual comparison |
| Promotions | Tracks commercial activity |
Amazon's UK grocery business also demonstrates how broad the marketplace has become. Amazon reported that groceries and household essentials represented more than one in every three units sold on Amazon.co.uk in Q1 2025, with more than two million grocery and household essentials available in the UK.
This creates an important lesson for consumer brands:
Digital shelf competition is no longer limited to traditional competitors.
A product can compete with multiple brands, sellers, pack sizes, substitutes, and private-label alternatives.
A single Amazon check might show that a product ranks well today.
Historical monitoring can answer:
This turns marketplace monitoring into an ongoing decision-support system.
Digital shelf analytics connects product, pricing, availability, content, ranking, and competitor information into one analytical framework.
The objective is to help commercial teams move from isolated observations to actionable decisions.
| Business Problem | Data Signal | Potential Action |
|---|---|---|
| Product losing visibility | Ranking decline | Review content and pricing |
| Competitor undercutting | Price gap | Evaluate pricing strategy |
| Frequent stockouts | Availability history | Investigate supply planning |
| Weak conversion | High visibility + low sales | Review offer/content |
| Competitor launch | New SKU detected | Assess market response |
| Poor digital content | Missing attributes/images | Improve listing |
| Promotion gap | Competitor discount | Evaluate promotion |
Digital Shelf Monitoring for UK Online Retailers becomes most valuable when these observations are connected to business processes.
For example, a brand could create automatic alerts when:
These alerts allow category managers to prioritize the events that need attention instead of manually reviewing thousands of products.
From 2020 to 2026, UK e-commerce moved from an accelerated pandemic channel into a permanent part of retail strategy. ONS data shows internet sales accounted for 28.1% of retail sales in 2020, rising to 30.7% in 2021, before settling at 26.6% in 2022, 26.7% in 2023, 27.1% in 2024, and 27.4% in 2025. The latest ONS data shows the ratio at 28.1% in Q1 2026 and 27.8% in Q2 2026.
In 2020–2021, brands primarily needed to manage rapid changes in online demand, product availability, and digital assortment. In 2022–2023, the focus increasingly moved toward price competition, promotions, stock visibility, and marketplace positioning. During 2024–2025, retailers placed greater emphasis on value and digital customer experience. Sainsbury's, for example, reported substantial investment in lower prices and expanded its Nectar Prices programme. Amazon also continued to expand its UK marketplace ecosystem, with around 100,000 UK SMEs selling on its platform and more than £3.8 billion in export sales reported by UK small businesses in 2024. In 2026, the emphasis is increasingly shifting toward continuous intelligence, automation, AI-assisted analysis, and cross-retailer visibility.
The major change is therefore not simply that more retail is online. It is that online visibility has become measurable at product level. Brands can now compare prices, availability, ranking, content, assortment, reviews, and competitor activity across time and channels.
Real-Time Ocado Online Grocery Pricing Analytics can be incorporated into a broader retail intelligence workflow designed around the specific needs of UK brands.
Actowiz Metrics can help brands collect, structure, monitor, and analyse product-level data across relevant online retail channels.
A typical workflow can include:
1. Define the Product Universe
Identify the brand's priority SKUs, competitor products, categories, retailers, and geographic markets.
2. Collect Product-Level Data
Capture product names, prices, promotions, availability, ratings, reviews, images, descriptions, categories, and other relevant attributes.
3. Build Historical Records
Timestamp each observation so teams can identify changes rather than relying on one-time snapshots.
4. Benchmark Competitors
Compare brand products against competitors across price, availability, assortment, content, and visibility.
5. Detect Important Changes
Create rules for identifying significant price movements, stockouts, new products, assortment changes, and ranking shifts.
6. Create Dashboards and Alerts
Deliver structured datasets for BI dashboards, reporting systems, internal analytics, and automated alerts.
7. Support Commercial Decisions
Use the resulting intelligence to help pricing, sales, category, e-commerce, and brand teams decide where action is required.
The value comes from connecting data collection with a decision framework.
For example:
Price change → competitor comparison → margin assessment → promotion decision
or:
Availability decline → retailer comparison → supply investigation → corrective action
This makes digital shelf data operational rather than merely descriptive.
Digital Shelf Monitoring for UK Online Retailers helps brands maintain a clearer view of how their products appear, compete, and perform across the UK's increasingly important online retail environment.
The strongest monitoring strategy combines price, availability, ranking, assortment, content, reviews, ratings, and competitor activity rather than relying on one metric.
The latest ONS data shows that online retail continues to represent around a quarter or more of UK retail sales, with the internet-sales share reaching 27.8% in Q2 2026. That makes digital shelf execution a core commercial priority rather than an optional analytics exercise.
For brand managers and e-commerce leaders, the practical objective is simple:
Know when visibility changes, understand why it changes, and act before the change affects sales.
With structured historical data and automated monitoring, brands can identify pricing gaps, stock issues, competitor movements, assortment opportunities, and content weaknesses faster.
Ready to strengthen your UK online retail visibility and turn product-level marketplace data into actionable sales intelligence? Contact Actowiz Metrics for scalable digital shelf monitoring, competitor tracking, pricing intelligence, and custom retail data solutions!
Expert blogs, research reports and infographics — practical, data-driven reading across e-commerce and quick-commerce.
Most fields are optional — the more you share, the better your sample.

.webp "infographics")
.webp "infographics")