BLOG
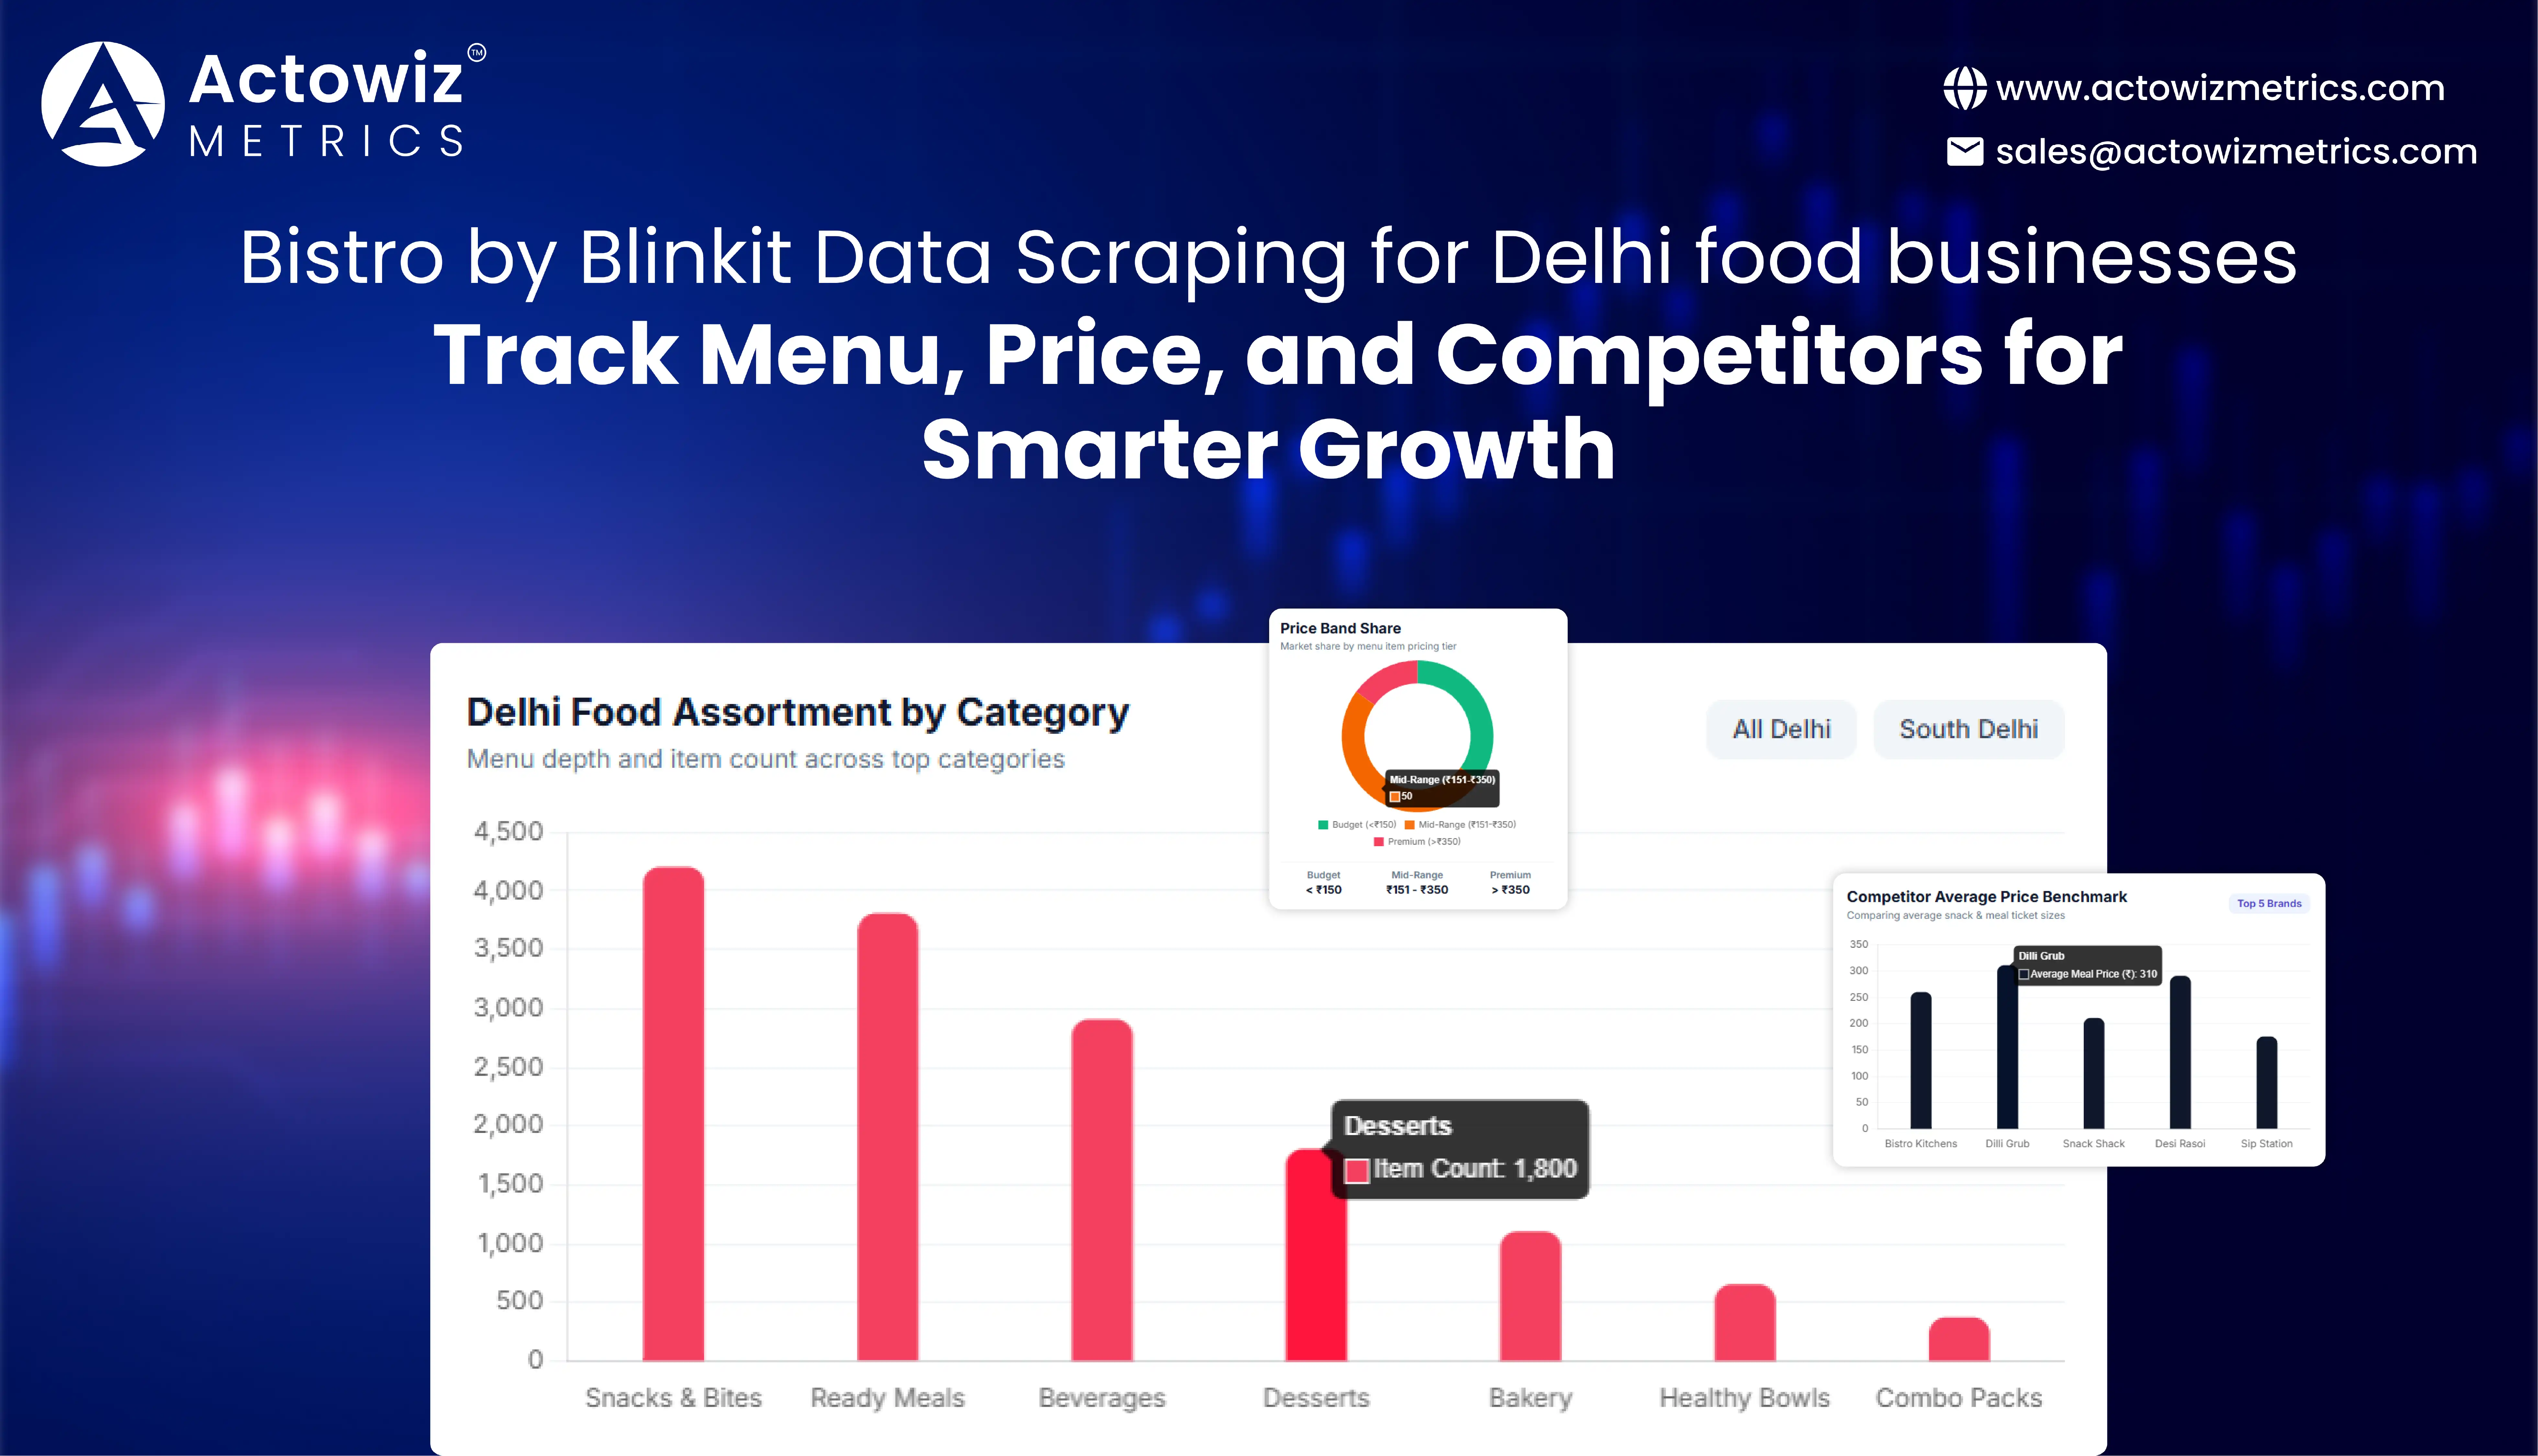




















Bistro by Blinkit Data Scraping for Delhi food businesses helps restaurants, cloud kitchens, QSRs, food brands, and market-research teams monitor digital menus, prices, product availability, and competing offers in a fast-changing delivery environment. The core business question is simple: Which menu items, prices, and competitors are creating opportunities or putting pressure on a Delhi food business?
Bistro positions itself as a quick food-delivery destination offering snacks, meals, and drinks prepared in nearby kitchens and delivered to customers. Its official platform highlights speed, live order tracking, hygiene, and nearby preparation as part of its proposition.
For Delhi food businesses, these digital signals can be valuable because the Indian food-services market is becoming increasingly organized and technology-driven. India's food-services market is projected to grow from about US$90 billion in FY26 to US$150 billion by FY31, while the online segment's share is expected to rise from 11% to 18%. Metro-city online food-delivery transactions reportedly increased from around 30 crore in FY21 to approximately 106 crore in FY26.
Food & beverage analytics can turn recurring marketplace observations into structured intelligence. Instead of manually checking individual menus, businesses can build datasets that compare products, prices, categories, availability, promotions, and competitor activity across locations and time periods.
Delhi's food market includes restaurants, cloud kitchens, QSRs, cafés, bakeries, dessert brands, beverage businesses, and specialized food concepts. Their digital competition can change quickly.
A competitor can introduce a new dish, change a price, add a combo, remove a popular item, or launch an offer without providing direct visibility to other businesses.
A structured data-monitoring approach can help answer:
These insights can support menu planning, pricing reviews, product development, promotional planning, and competitor benchmarking.
Bistro by Blinkit menu data scraping Delhi can help businesses build a structured view of menu assortment, product names, categories, descriptions, prices, add-ons, combos, and availability.
For a restaurant owner, simply knowing that a competitor sells pizza or burgers is not enough. The more useful question is how that competitor structures the assortment.
For example, businesses can compare:
| Menu Attribute | Business Value |
|---|---|
| Product name | Identify comparable items |
| Category | Measure assortment depth |
| Description | Understand positioning |
| Price | Benchmark pricing |
| Combo availability | Compare value propositions |
| Add-ons | Identify upselling patterns |
| Availability | Detect assortment gaps |
| Product frequency | Identify recurring market items |
| Location | Compare local competition |
Historical menu observations are especially useful. A restaurant might discover that several competitors introduced protein-focused meals, beverages, desserts, or value combos during a particular period. This can help a business investigate whether the change represents a short-term promotion or a broader category movement.
Between 2020 and 2026, digital food ordering moved from being primarily a convenience channel toward becoming an important source of customer and market intelligence. The pandemic accelerated online ordering and pushed many restaurants, cloud kitchens, and food brands to improve their digital presence. From 2021 to 2023, online menus became increasingly important for product discovery, comparison, and customer acquisition. By 2024 and 2025, organized food-service businesses were increasingly using technology, delivery platforms, and digital channels to expand their reach. IBEF reported in 2024 that India's food-services industry was projected to grow at an 8.1% CAGR from 2024 to 2028, with online food-delivery platforms already reaching an estimated 6.6 crore urban users. In 2025, organized food services accounted for approximately 45–50% of the market, according to a Kearney-Swiggy report summarized by IBEF. By 2026, the expanding digital food ecosystem makes menu monitoring more valuable for businesses trying to understand assortment shifts. Instead of treating a delivery platform as only a sales channel, restaurants can analyze publicly visible marketplace information as a source of competitive and category intelligence.
Bistro by Blinkit pricing intelligence Delhi gives restaurants a way to understand how comparable products are priced across the market.
Price comparison becomes more meaningful when businesses track products over time rather than taking a single snapshot.
A useful dataset can include:
| Pricing Metric | What It Helps Measure |
|---|---|
| Listed price | Current market positioning |
| Discounted price | Promotional positioning |
| Discount percentage | Offer intensity |
| Combo price | Value perception |
| Add-on price | Upselling strategy |
| Price changes | Competitive movement |
| Price range | Category benchmark |
| Historical price | Long-term positioning |
For example, suppose several Delhi businesses sell comparable bowls. One competitor may remain within a narrow price range while another frequently introduces discounts. Tracking both patterns helps a restaurant distinguish stable market pricing from promotion-led pricing. The goal is not necessarily to offer the lowest price. Instead, businesses can identify where their pricing sits relative to comparable products and determine whether their menu requires repositioning.
Food pricing became more dynamic between 2020 and 2026 as restaurants responded to changing input costs, customer demand, delivery economics, promotions, and increasing competition. In 2020 and 2021, many food businesses were focused on maintaining operations and adapting menus to delivery-friendly formats. Between 2022 and 2024, restaurants increasingly experimented with combos, discounts, premium positioning, and digital-first menu strategies. By 2025, India's organized food-services segment was expanding faster than the unorganized market, while cloud kitchens and QSRs became important growth formats. IBEF reported that organized food services were expected to grow at 12–14% annually between 2025 and 2030, compared with 5–7% for unorganized players. In 2026, pricing analysis therefore needs to consider more than a product's displayed price. Businesses can examine price bands, discount frequency, menu positioning, product combinations, and competitor movement. Historical pricing data can also help identify recurring promotional periods and understand whether competitors are gradually moving toward premium, mid-market, or value-oriented positioning.
Bistro by Blinkit competitor analysis for Delhi Food Businesses helps restaurants understand the competitive structure surrounding their products.
Competitor intelligence can cover both direct and indirect competition.
For instance, a café selling sandwiches may compete with another café, a QSR, a cloud kitchen, or a specialized sandwich brand. Looking only at businesses with the same restaurant category may therefore underestimate the actual competitive environment.
A structured competitor dataset can compare:
| Competitive Signal | Business Question |
|---|---|
| Brand | Who operates in the segment? |
| Menu size | How broad is the assortment? |
| Product overlap | Which products compete directly? |
| Price | How are products positioned? |
| Discounts | Who uses aggressive promotions? |
| New products | Who is expanding? |
| Availability | Which products are consistently listed? |
| Location | Where is competition concentrated? |
This allows restaurants to identify whitespace opportunities.
For example, a business might discover that competitors have many standard beverages but relatively few specialized beverage products. That does not automatically prove demand exists, but it gives the business a measurable hypothesis to investigate.
Competitive intelligence in food services has become more important as digital ordering reduces geographic barriers within urban markets. In 2020, restaurant competition was strongly influenced by physical location and operational limitations. As delivery adoption increased from 2021 onward, restaurants could reach customers beyond their immediate walk-in audience. Between 2022 and 2024, cloud kitchens, QSRs, cafés, and digitally native food brands increasingly competed through online discovery and delivery. The 2025 Kearney-Swiggy report cited by IBEF highlighted the expanding role of organized food services, cloud kitchens, QSRs, and technology-enabled delivery. By 2026, a Delhi food business can therefore face competition from multiple concepts serving similar customer occasions. Competitor monitoring helps businesses organize that complexity. Historical data can reveal which brands expand their menus, which categories become crowded, and which products repeatedly appear across multiple competitors. The strongest analysis combines competitor identity with menu, price, availability, and location signals so businesses can understand not just who their competitors are, but how they are positioning themselves.
Delhi food delivery market intelligence helps businesses understand demand patterns within a rapidly expanding digital food environment.
India's food-services market is projected to reach US$150 billion by FY31, with online food services expected to increase their share of the overall market. Metro-city food-delivery transactions rose substantially between FY21 and FY26, according to Redseer data reported by IBEF.
For Delhi businesses, the implication is practical: digital menu visibility and competitive positioning can influence how customers discover and compare food options.
| Market Intelligence Area | Example Insight |
|---|---|
| Category growth | Which food categories are expanding? |
| Menu density | Which categories are crowded? |
| Price bands | What price points dominate? |
| Product launches | Which concepts are expanding? |
| Availability | Where are supply gaps visible? |
| Promotions | How frequently are offers used? |
| Location | Which areas show greater competition? |
Blinkit analytics can complement these observations by organizing marketplace data into recurring datasets and dashboards.
Delhi's digital food environment has evolved alongside India's broader online consumption transformation. In 2020, pandemic restrictions accelerated reliance on delivery and takeaway models. During 2021 and 2022, restaurants adapted menus for delivery, while customers became more comfortable ordering food digitally. From 2023 onward, organized food-service brands, QSRs, cafés, cloud kitchens, and digital-first concepts increasingly competed for online demand. By 2025, India's food-services market had reached approximately Rs. 6,96,072 crore, or US$78 billion, according to the Kearney-Swiggy report summarized by IBEF, with organized players accounting for an estimated 45–50% of the market. In 2026, this environment creates a stronger need for structured local-market intelligence. A Delhi restaurant cannot assume that a national trend applies equally to every neighborhood or cuisine segment. Location-specific menu and price observations can provide a more precise starting point for analysis. Businesses can compare nearby competitors, identify recurring product categories, observe pricing ranges, and detect assortment changes. This local perspective is particularly relevant for restaurants that operate in dense urban markets where multiple brands can compete for similar customer occasions.
Bistro by Blinkit menu item data collection gives restaurants a granular view of the products available in their competitive environment.
Instead of analyzing a competitor only at brand level, businesses can compare individual menu items.
A menu-item dataset can contain:
This information can support several business decisions.
Menu Optimization
Businesses can identify overrepresented categories and potential assortment gaps.
Product Benchmarking
Restaurants can compare equivalent products across competitors and price bands.
New Product Research
Recurring appearances of particular product types can provide hypotheses for new menu development.
Promotional Analysis
Businesses can observe whether competitors frequently bundle products or use discounts.
Seasonal Planning
Historical observations can reveal products that appear more frequently during specific periods.
Menu strategy has changed considerably since 2020. Restaurants that previously depended heavily on dine-in traffic increasingly adapted their menus for delivery, emphasizing products that travel well, maintain quality, and support profitable preparation. From 2021 to 2023, cloud kitchens and delivery-focused concepts expanded the importance of standardized menu structures. Between 2024 and 2025, consumer demand also diversified. IBEF reported that changing consumption patterns, social media, pop culture, and demand for diverse cuisines were contributing to growth in India's organized food-services market. By 2026, menu intelligence can therefore help restaurants understand not only what competitors sell but how their assortment evolves. Tracking individual products over time can reveal additions, removals, pricing changes, and category expansion. This is especially useful for businesses testing new cuisines, launching cloud-kitchen concepts, or evaluating whether their existing menu remains competitive. Rather than copying competitor products, restaurants can use these observations to formulate hypotheses, test customer response, and refine their assortment based on measurable market evidence.
Bistro by Blinkit product data scraping for Delhi food market analysis enables businesses to bring menu, price, availability, and competitor observations into one structured analytical framework.
The value comes from connecting individual records to business questions.
| Business Need | Data Signals | Potential Output |
|---|---|---|
| Menu planning | Products + categories | Assortment opportunities |
| Pricing | Product + price history | Price benchmarks |
| Competitor research | Brand + product | Competitive map |
| Promotion planning | Discounts + combos | Offer patterns |
| Availability | Product status | Supply gaps |
| Market research | Location + category | Local market view |
| Trend analysis | Historical records | Category movement |
A product-level dataset also allows businesses to segment competitors by cuisine, price tier, menu size, location, and product category. This creates a more useful framework than a simple competitor list.
Product-level food intelligence has become increasingly relevant as digital marketplaces have expanded the amount of information available to customers and businesses. In 2020, many restaurant decisions were based on internal sales data and traditional competitor observation. From 2021 to 2023, delivery platforms created broader digital footprints around menus, prices, promotions, and availability. During 2024 and 2025, the expansion of organized food services and cloud kitchens increased the need for structured market comparison. India's food-services industry was valued at about US$80 billion in 2024 and was projected to reach US$144–152 billion by 2030, according to Redseer estimates reported by IBEF. By 2026, businesses can benefit from treating marketplace data as a longitudinal research asset. Repeated observations make it possible to identify persistent patterns rather than isolated changes. For Delhi food businesses, this can mean comparing local competitors by product category, price range, menu depth, availability, and promotional activity. Such analysis does not guarantee demand for a new product, but it can reduce information gaps and help teams make better-informed decisions about which opportunities deserve testing.
Actowiz Metrics can help food businesses convert marketplace observations into structured, analytics-ready datasets.
Food Delivery Data Scraping: Menu & Price Intelligence can support businesses that need recurring visibility into:
A Practical Data Pipeline
For a Delhi restaurant group, this approach can scale from monitoring a handful of competitors to analyzing a large product universe across multiple locations and categories.
Delhi's food market is becoming increasingly digital, organized, and competitive. India's food-services industry is projected to reach US$150 billion by FY31, while online food services are expected to account for a growing share of the market.
For restaurants, QSRs, cloud kitchens, cafés, and food brands, the challenge is no longer simply knowing what competitors sell. The greater opportunity is understanding how menus, prices, availability, promotions, and product categories change over time.
Restaurant & Menu Data API for Smarter Food Insights can complement recurring marketplace datasets by helping businesses integrate structured food information into their analytics workflows.
The most useful strategy is to turn marketplace observations into a historical intelligence layer. With consistent data collection, Delhi food businesses can benchmark competitors, identify menu gaps, monitor pricing patterns, study product movements, and create evidence-based hypotheses for growth.
Ready to turn Delhi food marketplace data into actionable business intelligence? Partner with Actowiz Metrics to build scalable menu, price, availability, and competitor data solutions that support smarter food-business decisions!
Expert blogs, research reports and infographics — practical, data-driven reading across e-commerce and quick-commerce.
Most fields are optional — the more you share, the better your sample.
.webp "infographics")
.webp "infographics")