BLOG


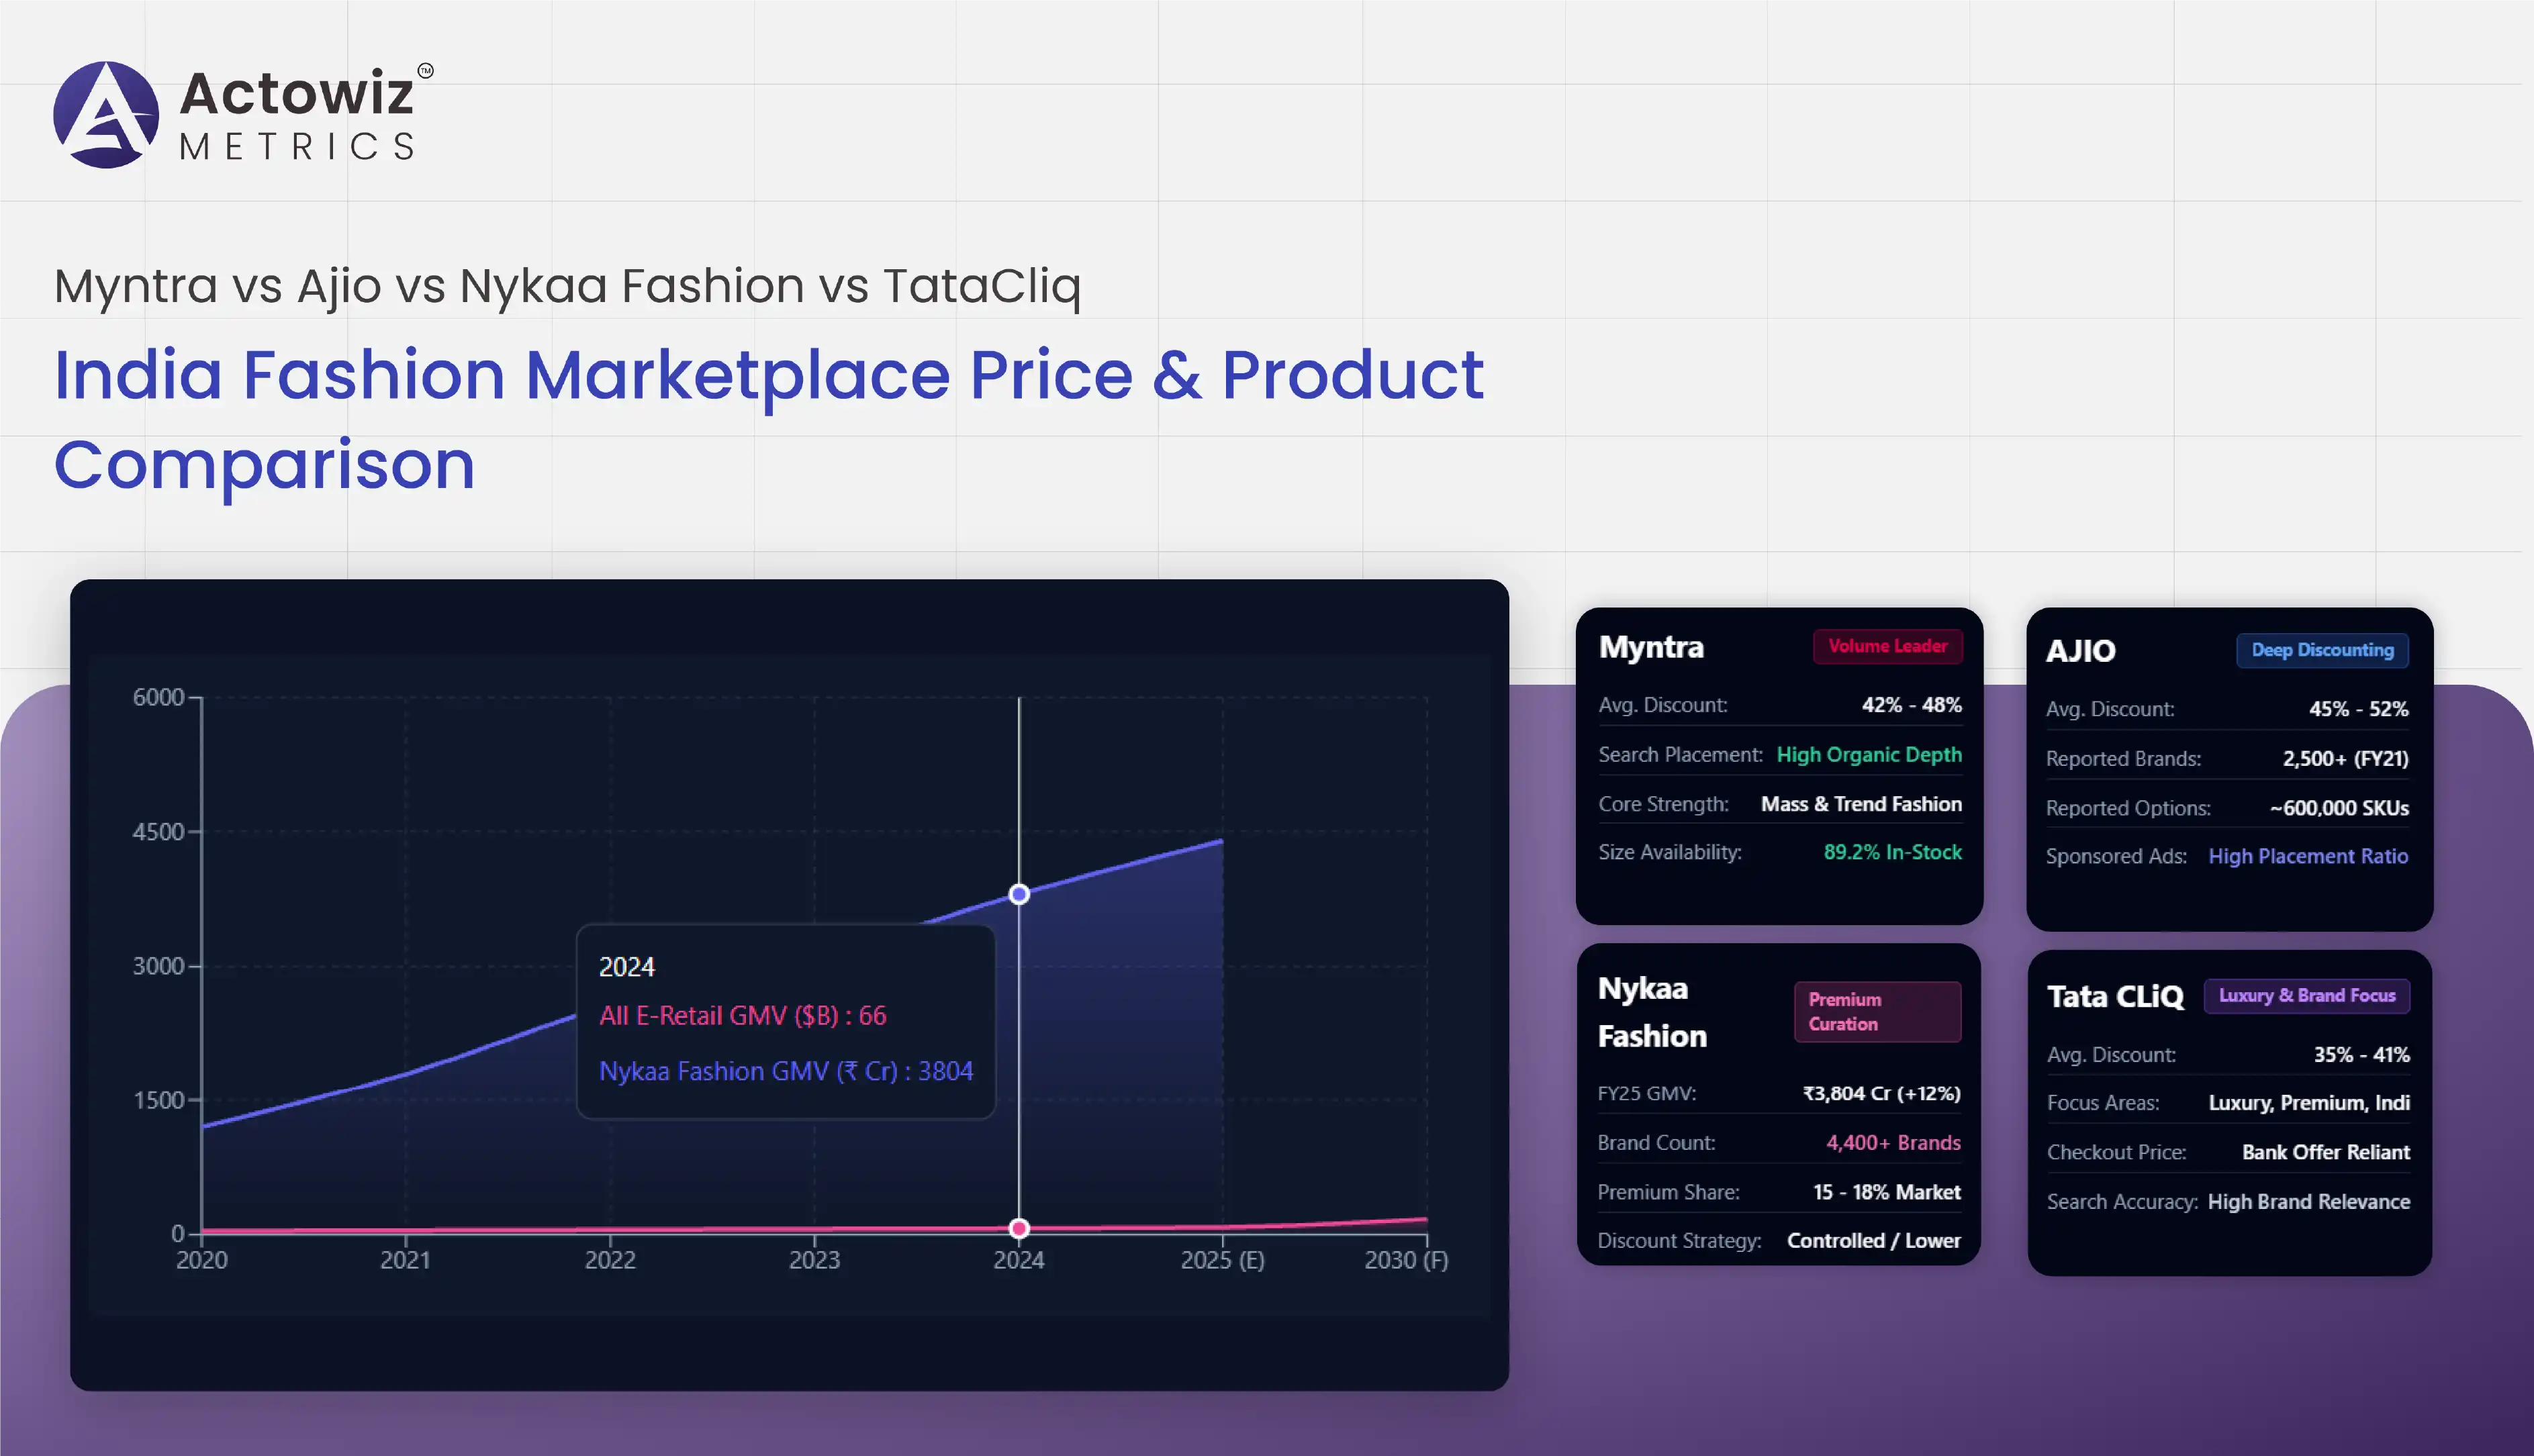
India’s fashion e-commerce market is shaped by changing consumer preferences, digital shopping adoption, promotional campaigns, brand expansion, and competition across online marketplaces. India Fashion Marketplace Comparison helps retailers and fashion brands evaluate how platforms differ in displayed prices, product assortment, discounts, product visibility, and availability. Fashion & Apparel E-commerce Analytics provides a structured approach to turning marketplace observations into actionable commercial insights. Myntra, AJIO, Nykaa Fashion, and Tata CLiQ offer useful comparison points, although their brand portfolios, category mixes, promotional policies, and shopping experiences differ. A fair comparison must account for product variants, sizes, seller information, delivery locations, and the time at which prices are observed. It must also distinguish verified platform-wide facts from individual product listings, which can change frequently.
This report examines six dimensions of marketplace competition using published company disclosures, government statistics, and other credible sources. Where consistent, comparable figures for all four platforms are not publicly available, the report identifies that limitation rather than presenting unsupported estimates.
The following table separates reported market figures from forecasts and platform-specific disclosures. These figures describe different measures and should not be treated as a single continuous dataset.
| Year | Verified market or platform indicator | Source |
|---|---|---|
| 2020–21 | AJIO reported nearly 600,000 product options across more than 2,500 brands. | Reliance Industries Annual Report 2020–21 |
| 2021–22 | No directly comparable annual fashion marketplace price index for all four platforms was identified. | Reliance Industries annual reports |
| 2022–23 | Nykaa Fashion reported GMV of ₹2,569 crore and more than 2,850 brands. | Nykaa FY2023 AGM highlights |
| 2023–24 | Nykaa’s investor presentation reported fashion online premium market share of 15–18%, as of March 31, 2024. | Nykaa Investor Day 2024 |
| 2024–25 | Nykaa Fashion reported ₹3,804 crore in GMV, 12% year-on-year growth, and more than 4,400 brands. | Nykaa Annual Report 2024–25 |
| 2025 | Bain and Flipkart estimated India’s total e-retail GMV at approximately US$65–66 billion. This covers all e-retail categories, not fashion alone. | Business Standard, April 2026 |
| 2026 | India’s e-retail market is projected to reach US$170–180 billion by 2030, according to the 2026 Bain–Flipkart report. This is a forecast, not a 2026 full-year result. | NDTV Profit, April 2026 |
The figures above establish the market’s scale and selected platform milestones, but they do not provide a verified year-by-year price, discount, or availability series for Myntra, AJIO, Nykaa Fashion, and Tata CLiQ. Those comparisons require timestamped product-level observations.
Myntra vs Ajio vs Nykaa Fashion vs TataCliq Price Comparison should begin with identical products rather than broad category averages. A branded T-shirt, pair of jeans, sneaker, or handbag can have different prices across listings because of variations in size, colour, seller, product version, and promotional eligibility. Analysts should match brand, style code, size, material, and pack quantity before treating two prices as comparable. Where a unique product identifier is available, it can improve matching accuracy.
For Nykaa Fashion Products data scraping, any data collection should follow the relevant platform terms, authorized access arrangements, and applicable legal requirements. Product-level research can then capture listed price, displayed sale price, product identifier, seller information where available, and collection timestamp. The resulting dataset can support price comparisons without assuming that one platform is consistently cheaper across all fashion categories.
The distinction between original price and current selling price matters. A displayed maximum retail price is not necessarily the price at which a product previously sold, and a discount label does not by itself prove a historical price reduction. A robust comparison should therefore preserve each price field separately and document its source.
The Competition Commission of India has discussed price transparency, deep discounts, search ranking, and marketplace competition in its e-commerce market study. These issues reinforce the value of transparent, reproducible comparison methods.
Source: Competition Commission of India: e-commerce market study.
| Price metric | Recommended measurement |
|---|---|
| Listed price | Price displayed for the matched product |
| Selling price | Current displayed price after applicable markdowns |
| Effective checkout price | Final payable price, only where eligibility and fees are verified |
| Price difference | Difference between matched products at the same observation time |
| Historical movement | Change between timestamped observations, not an inferred history |
Myntra, Ajio, Nykaa Fashion & TataCliq Discount Benchmarking requires analysts to separate product markdowns from coupon offers, bank promotions, loyalty benefits, and conditional checkout discounts. These incentives can produce different final prices for different customers. A headline percentage alone is therefore an incomplete measure of promotional competitiveness.
A reliable comparison records the original displayed price, current displayed price, promotion type, offer conditions, and observation time. If an offer requires a bank card, minimum purchase, membership, or coupon code, the condition should be captured rather than treating the discount as universally available. Where checkout details cannot be verified, the analysis should be labelled as a displayed-price comparison rather than a final-price comparison.
India Fashion Marketplace Comparison also needs to account for sale events and seasonal timing. A product observed during a major promotional event may not be comparable with the same product observed during an ordinary trading period. Analysts can reduce this bias by checking the same matched products at consistent intervals and retaining separate records for sale and non-sale periods.
The CCI’s 2020 market study identified deep discounts and platform transparency among the issues relevant to competition in e-commerce. That publication provides a regulatory context for examining promotions, but it does not establish that any of these four fashion platforms offers the highest average discount.
Source: CCI market study findings, Government of India.
| Benchmark | What it reveals |
|---|---|
| Displayed markdown | Difference between listed and sale prices |
| Coupon-based offer | Savings conditional on a valid coupon |
| Bank-linked offer | Benefit restricted to eligible payment methods |
| Sale-period movement | Changes in observed prices during promotional events |
| Offer availability | Whether the promotion applies to the matched product and customer conditions |
Myntra, Ajio, Nykaa Fashion & TataCliq Assortment Comparison should measure the breadth and depth of products available in comparable categories. Breadth refers to the range of categories, such as menswear, womenswear, footwear, accessories, and occasion wear. Depth refers to the number of distinct styles, brands, sizes, and variants within each category. Counting every colour or size variant as a separate product can inflate assortment totals, so reporting should distinguish unique styles from individual sellable variants.
Nykaa’s published FY2023 AGM highlights reported more than 2,850 brands on Nykaa Fashion, up from 1,500 in the preceding year, and fashion GMV of ₹2,569 crore in FY2023. Its FY2025 annual report later reported more than 4,400 brands. These figures demonstrate expansion in Nykaa Fashion’s reported brand portfolio, but they should not be compared directly with platform-wide product counts from other marketplaces because the measures differ.
AJIO’s FY2020–21 report described nearly 600,000 product options spanning over 2,500 brands. This is a historical platform disclosure, not a current assortment count. Tata CLiQ Fashion describes its offering across womenswear, menswear, kidswear, footwear, watches, and accessories on its official website. Comparable, independently verified current assortment totals for all four marketplaces were not established in the sources reviewed.
Sources: Nykaa FY2023 AGM highlights, Nykaa FY2025 Annual Report, and Reliance Industries FY2020–21 Retail Report.
| Assortment metric | Analytical purpose |
|---|---|
| Unique brands | Measures brand coverage within a defined category |
| Unique styles | Prevents sizes and colours from inflating product counts |
| Variant depth | Shows the number of available sizes or colour options |
| Category coverage | Identifies differences in platform specialisation |
| New-brand additions | Tracks documented changes in the assortment over time |
For fashion brands, this comparison can reveal whether a marketplace offers broad category coverage or a more curated selection. It can also identify assortment gaps, provided that the collection method and category definitions remain consistent.
Myntra, Ajio, Nykaa Fashion & TataCliq Product Visibility Analysis examines how easily customers can discover products through search results, category pages, filters, and promotional placements. A product may be listed on a marketplace without receiving meaningful visibility for relevant searches. Visibility analysis should therefore measure more than whether a product exists in the catalogue.
A repeatable methodology uses a predefined set of non-branded and branded search terms, a consistent observation schedule, and documented device or location conditions. Analysts can record whether a product appears within the first page of results, its observed position, and whether it appears in a clearly identified sponsored placement. Personalisation, location, account status, and dynamic ranking may affect results, so these factors should be documented wherever possible.
India Fashion Marketplace Comparison can then assess search coverage, category-page presence, and the visibility of selected brands across platforms. The analysis should avoid interpreting a single search snapshot as a permanent ranking or equating higher placement with higher sales. Without verified transaction data, visibility is an indicator of discoverability rather than a direct measure of conversion.
The Competition Commission of India’s e-commerce study recommended transparency around the main parameters used in search ranking, including disclosure when remuneration can influence placement. This is a useful policy reference for marketplace research, although it does not reveal the current ranking algorithms of the four platforms.
Source: CCI e-commerce study findings.
| Visibility indicator | How to interpret it |
|---|---|
| Search-result position | Observed placement for a specific query and time |
| First-page presence | Whether a product appears in the defined initial result set |
| Search coverage | Number of relevant queries returning the product |
| Sponsored placement | Paid visibility, where clearly identified |
| Category-page presence | Whether the product appears under relevant category filters |
A longitudinal dataset can help brands identify changes in discoverability, compare query coverage, and investigate whether products disappear from important searches. Conclusions should be based on repeated observations rather than one-off rankings.
Myntra, Ajio, Nykaa Fashion & TataCliq Availability Comparison should distinguish catalogue presence from actual purchase availability. A product page may remain accessible even when a particular size or colour is unavailable. For fashion retailers, this distinction is commercially important because a product that appears in search results may still be unavailable in the variant a shopper wants.
A practical monitoring framework records product-page status, size-level availability, colour options, delivery eligibility where observable, and the timestamp of each check. Location-specific observations should be maintained separately because delivery coverage and stock status may differ across service areas. Analysts should also distinguish an explicit out-of-stock message from an inaccessible page, a technical error, or an item that cannot be located through search. These conditions have different meanings and should not be grouped into one stockout measure.
Historical platform disclosures can establish the scale of a marketplace’s offering, but they cannot verify current stock levels. For example, AJIO’s FY2020–21 report documented a large assortment at that time; it does not establish present-day availability for individual products. Similarly, Nykaa’s published brand counts indicate catalogue breadth rather than the number of products available in every size.
Sources: Reliance Industries Annual Report 2020–21 and Nykaa Annual Report 2024–25.
| Availability metric | What should be recorded |
|---|---|
| Product-page status | Accessible, unavailable, or inconclusive |
| Size availability | Status for each observed size |
| Colour availability | Status for each observed colour variant |
| Delivery eligibility | Whether the platform indicates service for a defined location |
| Reappearance rate | Frequency with which an unavailable item becomes available again, based on repeated observations |
With repeated, timestamped records, brands can investigate persistent gaps, compare variant coverage, and distinguish short-term fluctuations from longer periods of unavailability. The resulting analysis should be described as observed availability, not as a complete inventory of each marketplace.
Myntra, Ajio, Nykaa Fashion & TataCliq Market Trends should be assessed against the wider evolution of Indian e-commerce and the platforms’ documented business strategies. India’s online retail environment has expanded substantially, although annual growth and demand conditions have varied. Bain and Flipkart’s How India Shops Online 2025 estimated India’s e-retail GMV at approximately US$60 billion in 2024 and reported growth of 10–12% that year, below the more than 20% historical growth rates cited in the report.
By 2025, Bain and Flipkart estimated e-retail GMV at US$65–66 billion, with growth of 19–21%, according to the 2026 edition of their research. These are all-category e-retail figures rather than fashion-specific sales estimates. They provide context for fashion marketplace strategy but cannot be used to calculate the market shares of Myntra, AJIO, Nykaa Fashion, or Tata CLiQ.
Nykaa’s FY2025 report offers a platform-specific indicator: its fashion vertical recorded ₹3,804 crore in GMV, up 12% year on year, and reported more than 4,400 brands. AJIO’s current performance indicators should be taken from dated Reliance disclosures, while Tata CLiQ Fashion’s own announcements can help track its evolving positioning. Metrics must be compared only when definitions and reporting periods align.
Sources: Bain–Flipkart 2025 report, Bain–Flipkart 2026 report coverage, and Nykaa Annual Report 2024–25.
| Period | Verified indicator | Implication for fashion analysis |
|---|---|---|
| 2020–21 | AJIO reported nearly 600,000 options across more than 2,500 brands. | Historical assortment scale |
| 2022–23 | Nykaa Fashion reported ₹2,569 crore GMV and over 2,850 brands. | Platform-specific growth and assortment benchmark |
| 2023–24 | Nykaa reported 15–18% online premium fashion market share in its investor presentation. | Context for its premium positioning; company-reported figure |
| 2024–25 | Nykaa Fashion GMV reached ₹3,804 crore, up 12% year on year. | Recent reported fashion performance |
| 2025–26 | Bain–Flipkart estimated 2025 all-category e-retail GMV at US$65–66 billion. | Wider market context, not a fashion-only figure |
The 2026 outlook should be treated as a forecast wherever full-year results are unavailable. Brands can use a combination of marketplace observations and published disclosures to monitor category shifts, promotional intensity, assortment expansion, and changes in consumer discovery. This approach offers a more defensible basis for planning than assuming that general e-commerce growth translates equally to every fashion platform.
Competitor Analysis for Brands helps fashion businesses organise marketplace observations into structured comparisons of prices, promotions, product assortment, availability, and search visibility. For brands selling across several online channels, consistent monitoring can make it easier to identify pricing differences, review promotional positioning, and investigate gaps in product coverage. The usefulness of the analysis depends on reliable data access, consistent product matching, and clear reporting definitions.
For India Fashion Marketplace Comparison, Actowiz Metrics can support the design of a repeatable benchmarking framework covering Myntra, AJIO, Nykaa Fashion, and Tata CLiQ. The framework can specify the products and categories to monitor, define comparable pricing fields, record observation timestamps, and establish validation checks before results are used in business decisions.
A practical reporting programme should also distinguish verified historical records from current snapshots and market forecasts. Public company disclosures can provide business context, while product-level observations can help explain differences between platforms. Neither source should be used to make unsupported claims about another platform’s market share or performance.
The recommended approach is to build a documented dataset that enables fashion brands to compare like-for-like products, investigate meaningful price movements, and review availability and visibility patterns. Any data collection should comply with platform terms, applicable law, and the relevant access permissions.
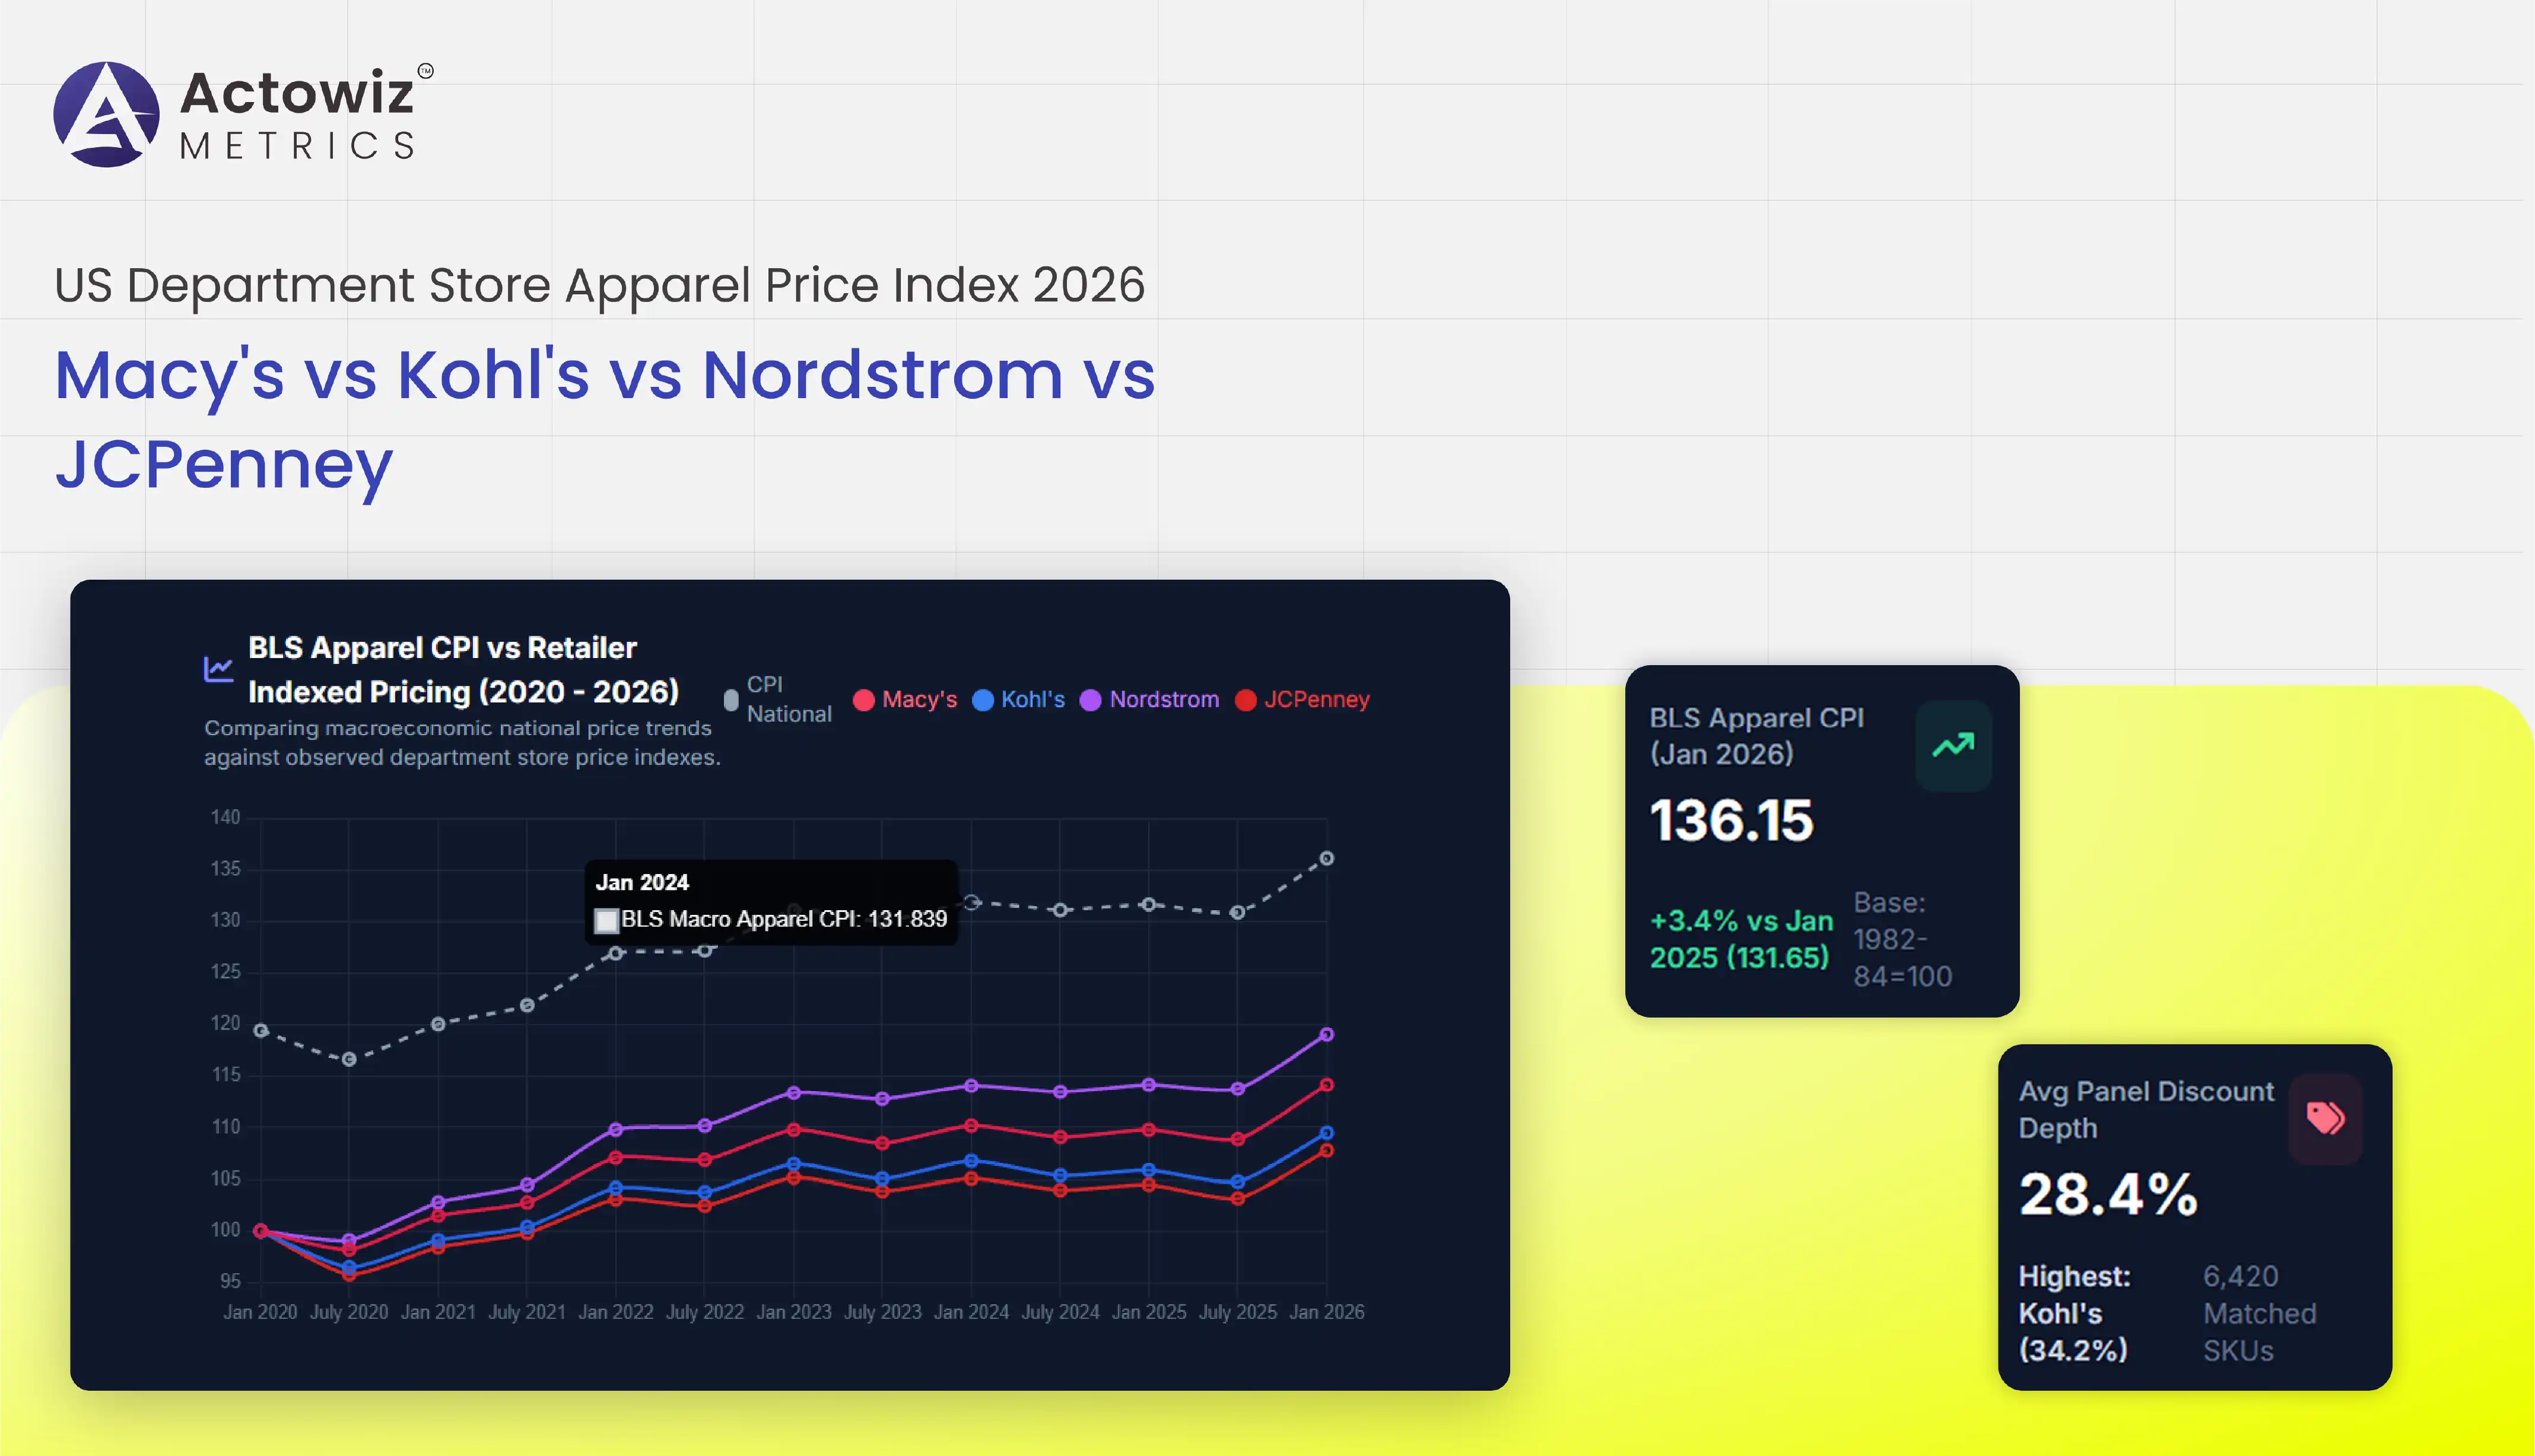
Actowiz Metrics can help brands, retailers, and market intelligence teams design a structured retail monitoring workflow around their business questions. For a department store apparel study, that means defining a comparable product basket, setting a consistent collection schedule, standardizing product attributes, and building reporting views that separate verified observations from uncertain matches.
A useful US scrape department store prices solution should focus on the quality and usability of the resulting data, not simply the volume of collected records. Buyers should be able to see the observation date, source, listed price, promotional price when available, and match status. Those details make the output easier to validate and safer to use in pricing discussions.
A practical engagement can include:
The scope and deliverables should be agreed in advance, including retailer coverage, product categories, refresh frequency, historical requirements, and reporting formats. Any claimed improvements in pricing accuracy, revenue, or operational efficiency should be measured against an agreed baseline rather than assumed before implementation.
A structured comparison of Myntra, AJIO, Nykaa Fashion, and Tata CLiQ can help fashion brands understand marketplace competition across pricing, discounts, assortment, search visibility, availability, and market trends. The public evidence in this report demonstrates the scale of Indian e-retail and provides selected platform-specific milestones, but it does not establish a universal price winner or a verified ranking of the four marketplaces. Such conclusions require comparable, timestamped product-level data.
Brand-Level Price & Discount Benchmarking can provide a useful foundation for identifying pricing differences, reviewing promotional conditions, and evaluating product positioning across online channels. To make the results dependable, businesses should use consistent product identifiers, preserve source timestamps, distinguish size-level availability from catalogue presence, and document limitations in the underlying data.
India Fashion Marketplace Comparison is most valuable when it combines credible market research with repeatable, transparent analysis. Brands can then use the findings to refine pricing strategies, assess category coverage, and prioritise further investigation without relying on unsupported assumptions.
Connect with Actowiz Metrics to explore fashion marketplace intelligence solutions for price monitoring, discount benchmarking, assortment analysis, and competitive retail insights!
Expert blogs, research reports and infographics — practical, data-driven reading across e-commerce and quick-commerce.
Most fields are optional — the more you share, the better your sample.
.webp "infographics")
.webp "infographics")