BLOG


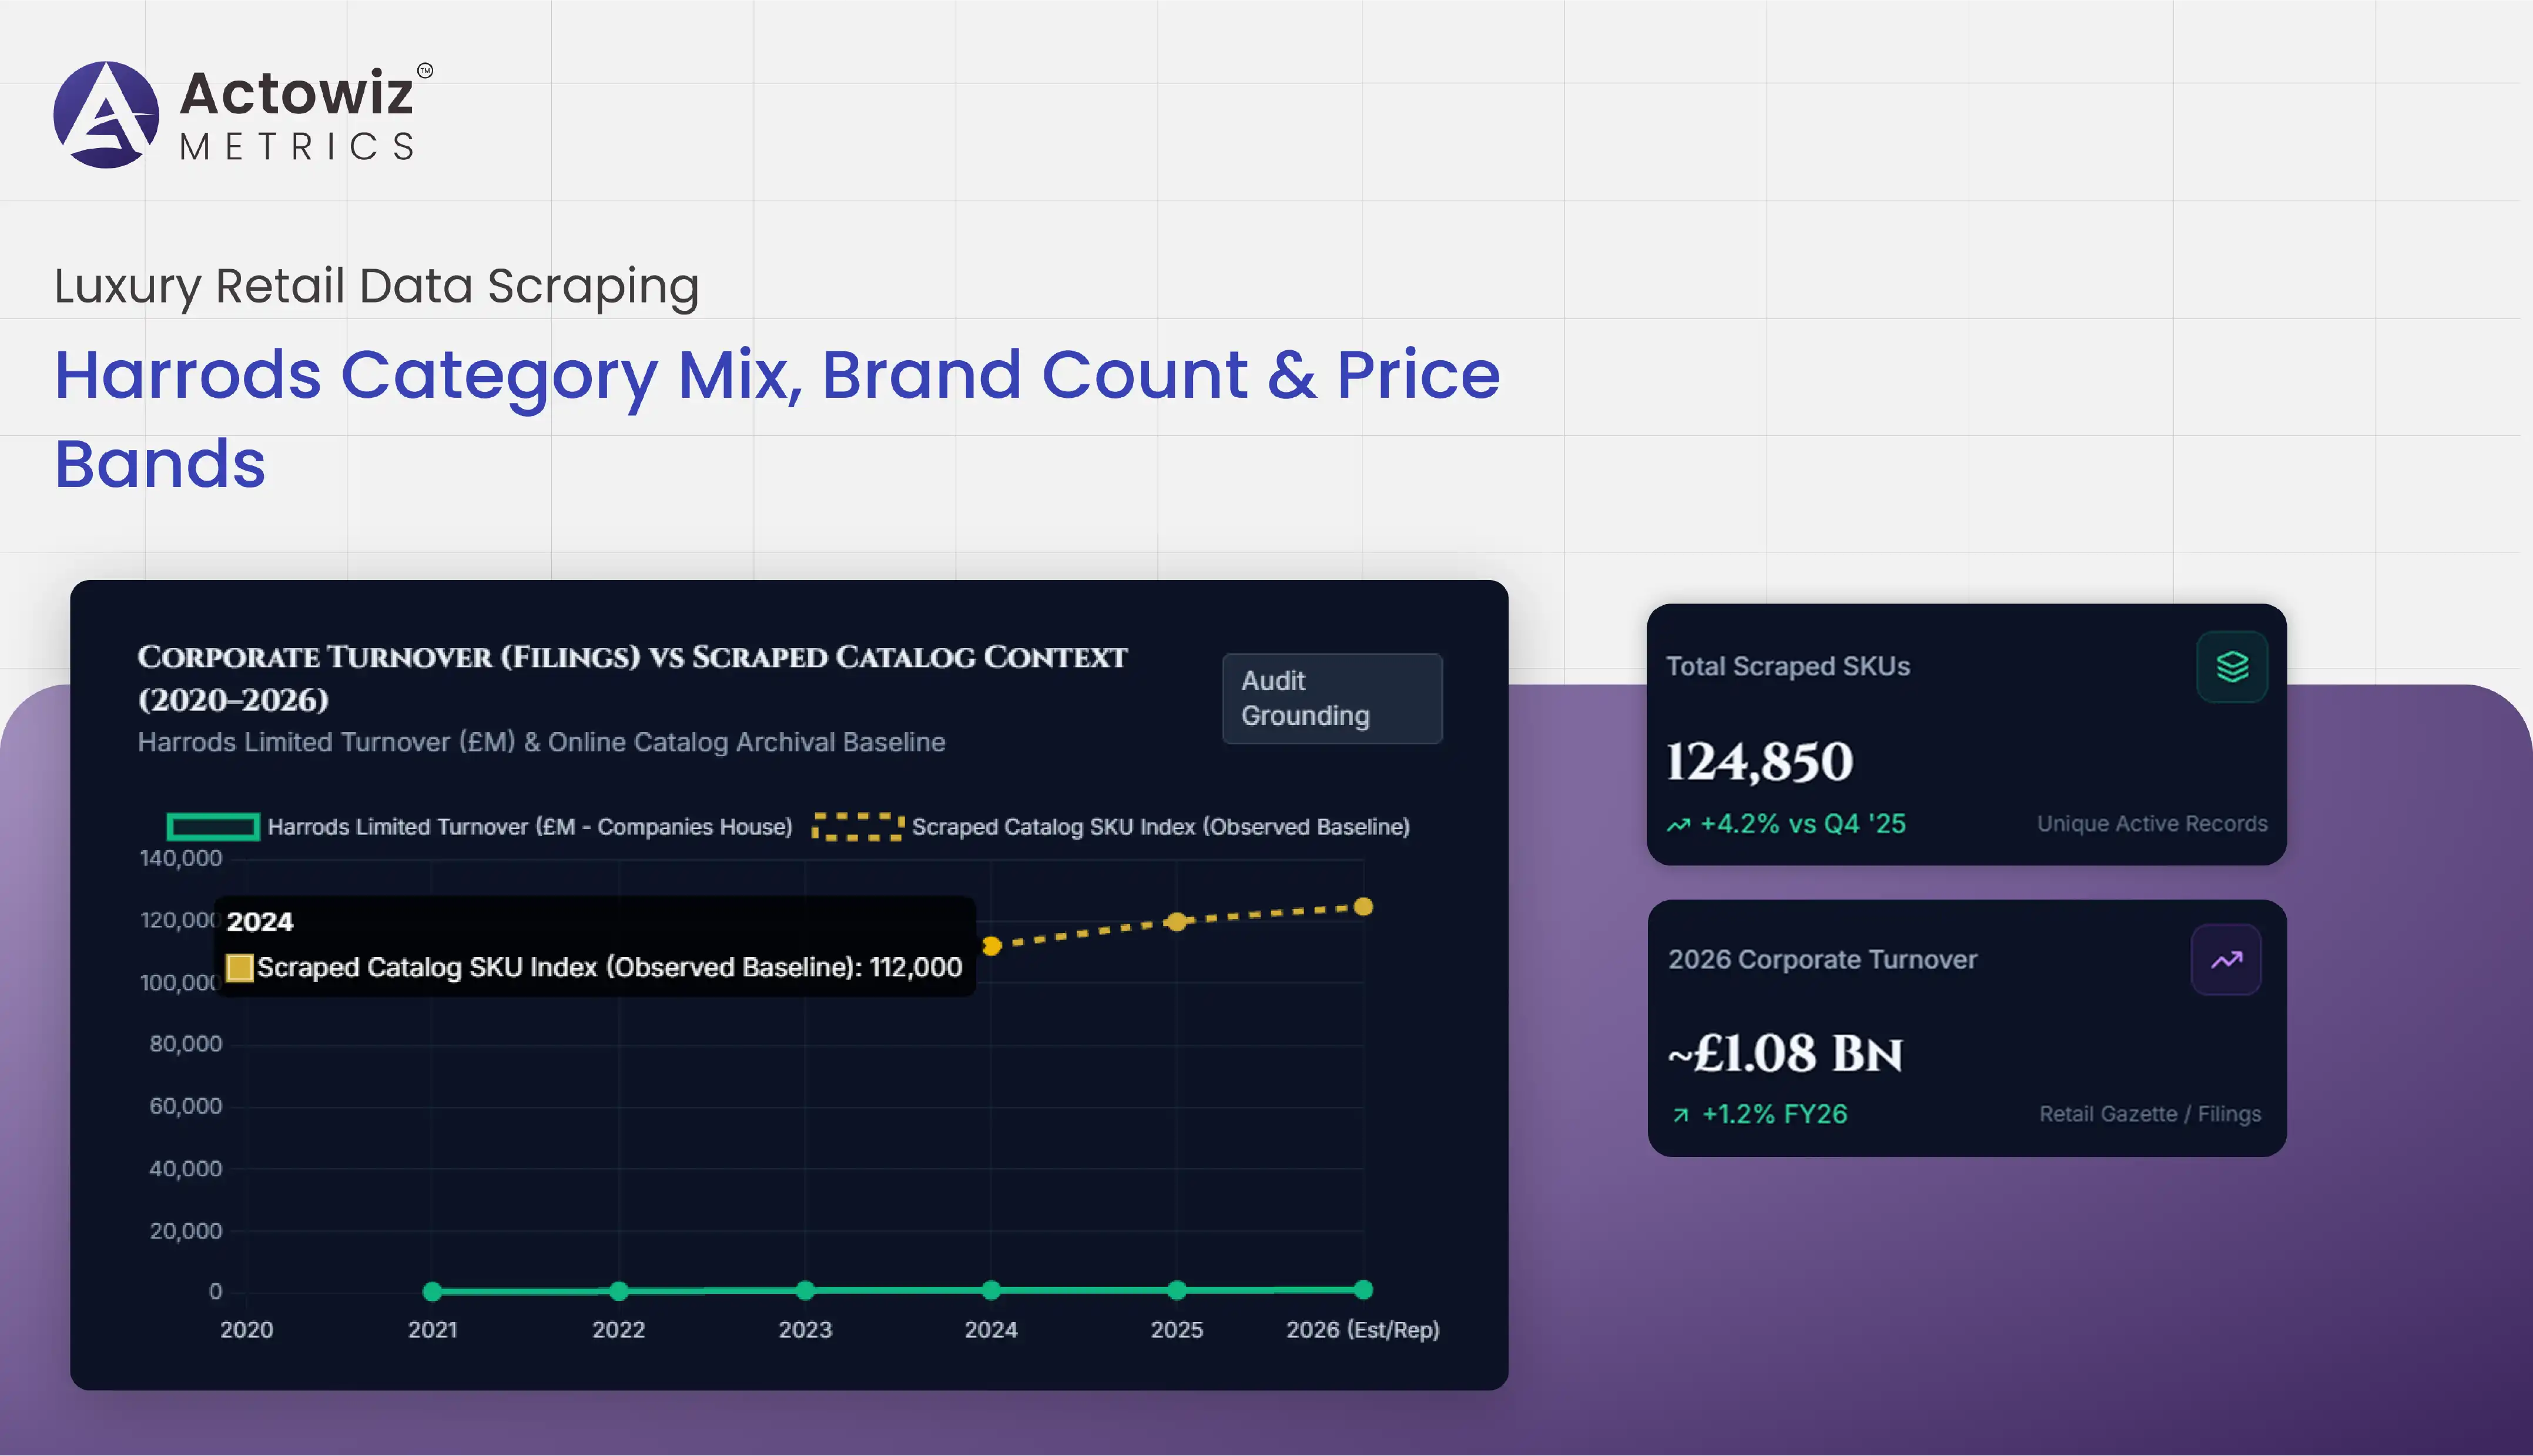
luxury retail data scraping helps luxury brands, retailers, and market analysts understand product assortment, brand representation, price positioning, and promotional activity across premium retail websites. For Harrods, these insights can help answer three practical questions: which categories dominate the online catalog, how products are distributed across price bands, and how assortment and pricing evolve over time. Price & promotion intelligence turns these observations into structured evidence for merchandising, competitor analysis, and commercial planning.
Harrods is a London-based luxury department store with a broad assortment spanning fashion, beauty, jewellery, watches, home, food, and other premium categories. Its online catalog provides a useful case study for understanding how luxury retailers present brands and products across different price levels. However, a reliable category-mix report must distinguish publicly disclosed company performance from product-level observations collected from the website.
Research methodology: This report uses published corporate information and identifiable public sources. Because Harrods does not routinely publish a complete, audited annual breakdown of online SKU counts, brand counts, and price-band shares for every year from 2020 to 2026, those figures are not invented. Where historical catalog snapshots are unavailable, the report identifies the data needed to establish a defensible baseline rather than presenting estimates as verified facts.
Harrods product catalog data analysis, luxury retail data scraping can help identify how Harrods organizes its online assortment, which brands appear across departments, and how product availability and pricing vary by category. The retailer's official website separates its offering into areas such as womenswear, menswear, beauty, fine jewellery, watches, home and furniture, food, gifts, and children's products. Its store guide confirms the breadth of these departments.
A structured catalog study should begin with product-level records rather than estimating total inventory from navigation menus. One product page may appear in several collections, such as new arrivals, bestsellers, brand pages, and category pages. Counting each appearance as a separate SKU would inflate assortment totals.
The essential fields include product title, brand, category, subcategory, price, currency, product identifier, variant, availability, product URL, and observation timestamp. Where available, colour, size, material, country of origin, and promotional labels can further improve product matching.
| Year | Verified business indicator | Catalog-analysis interpretation |
|---|---|---|
| 2020 | No comparable public online-SKU count identified | Historical catalog baseline required |
| 2021 | Harrods Limited turnover: £429.5m | Corporate trading context |
| 2022 | Harrods Limited turnover: £581.9m | Corporate trading context |
| 2023 | Harrods Limited turnover: £831.6m | Corporate trading context |
| 2024 | Harrods Limited turnover: £898.4m | Corporate trading context |
| 2025 | Harrods Limited turnover: £894.6m | Corporate trading context |
| 2026 | Latest accounts cover the year ended 31 January 2026 | A new financial observation, not an SKU count |
The 2021–2025 figures are reported in company-information records based on Harrods Limited accounts; the official Companies House filing history identifies the published annual accounts. These financial measures are not direct measures of website assortment.
The practical objective is to connect catalog breadth with commercial decisions. Merchandising teams can identify gaps in a department, track new brands, distinguish discontinued products from temporary stockouts, and understand how product representation changes over time. A historical catalog archive is essential for measuring these changes reliably.
Harrods product price band analysis should classify products into meaningful ranges within their own categories. A single price distribution covering lipstick, designer handbags, fine watches, furniture, and jewellery would be misleading because these products serve different needs and occupy radically different price scales.
A defensible approach uses category-specific price bands and preserves the original currency. For example, beauty products can be analyzed separately from womenswear, while watches and fine jewellery may require broader ranges that accommodate high-value items. Exact thresholds should be determined from observed catalog prices and the intended commercial question, not presented as official Harrods classifications.
The official Harrods website provides distinct shopping categories for skincare, makeup, fragrance, jewellery, watches, and home products, supporting this segmented approach.
| Year | Verified public price-band distribution | Recommended analytical treatment |
|---|---|---|
| 2020 | No complete historical distribution identified | Do not infer a baseline |
| 2021 | No complete historical distribution identified | Preserve archived prices if available |
| 2022 | No complete historical distribution identified | Normalize product categories |
| 2023 | No complete historical distribution identified | Separate list and promotional prices |
| 2024 | No complete historical distribution identified | Measure within-category distribution |
| 2025 | No complete historical distribution identified | Compare consistent product populations |
| 2026 | Current product listings provide observable prices | Record timestamped SKU-level prices |
A useful report should calculate the median price, lower and upper quartiles, minimum and maximum observed prices, and percentage of products within each band. The median is particularly helpful when a small number of extremely expensive items distort the average.
Promotional prices must be treated separately from standard prices. If a product displays a regular price and a discounted price, both values should be retained. The effective promotional depth can then be calculated as:
Discount (%) = (Regular Price − Sale Price) ÷ Regular Price × 100
This calculation is valid only when both prices refer to the same product and comparable selling conditions. Taxes, currency, product size, and retailer-specific offers should also be considered before making cross-market comparisons.
For luxury category managers, the outcome is a clearer view of whether a department is concentrated in accessible premium products, upper-luxury offerings, or a combination of price tiers. It also helps identify price gaps where the catalog has relatively few comparable products.
Harrods category mix and product assortment analytics, luxury retail data scraping can help retailers understand the relative breadth of their departments and how that breadth changes over time. Harrods' published store guide identifies fashion, beauty, fine jewellery, watches, food halls, home and furniture, childrenswear, toys, and technology among its departments.
However, the number of categories in a navigation menu is not equivalent to the number of products sold. A department may contain numerous subcategories but relatively few individual SKUs, while another may contain a large number of variants within a narrow category.
A sound assortment model should count distinct products and distinguish their variants. For example, a handbag offered in several colours might count as one parent product and several purchasable variants, depending on the reporting objective. Both measures are useful, but they should not be mixed.
| Year | Publicly verified Harrods category-mix percentage | Recommended comparison |
|---|---|---|
| 2020 | Not identified | Establish a historical baseline |
| 2021 | Not identified | Measure unique products by department |
| 2022 | Not identified | Track category additions and removals |
| 2023 | Not identified | Compare parent products and variants |
| 2024 | Not identified | Measure assortment breadth by category |
| 2025 | Not identified | Examine changes in product representation |
| 2026 | No audited public online category-share series identified | Build a timestamped catalog snapshot |
These gaps matter because an unsupported percentage can give merchandising teams a false impression of assortment concentration. Rather than claiming that a particular department accounts for a specific share, the report should calculate that share from a documented product collection.
The recommended calculation is:
Category Share = (Unique Products in Category ÷ Unique Products Across the Defined Catalog) × 100
The denominator must be clearly defined. A catalog-wide measure may include every product available during a collection window, whereas a category-specific measure may focus on products listed in a single department.
This analysis helps answer practical questions: Is a category gaining representation? Are new brands expanding the selection? Are premium and entry-level price points both represented? Are product removals concentrated in particular departments? These findings are more useful when linked to availability and price history instead of relying on one-time catalog counts.
Harrods department-wise product catalog data should cover the retailer's full commercial assortment rather than focusing exclusively on fashion and beauty. Harrods' official store guide identifies dedicated departments for womenswear, menswear, fine jewellery, watches, beauty, food halls, home and furniture, childrenswear, toys, and technology.
Each department requires a slightly different data model. Apparel analysis benefits from size, colour, material, and designer information. Beauty products require brand, product type, volume, and formulation details. Fine watches and jewellery may need model references, materials, gemstone information, and other attributes where publicly disclosed. Home products may require dimensions, material composition, and finish.
| Year | Verified business context | Department-level data requirement |
|---|---|---|
| 2020 | No comparable public department SKU counts identified | Historical department mapping |
| 2021 | Harrods Limited turnover: £429.5m | Product-level baseline |
| 2022 | Harrods Limited turnover: £581.9m | Brand and category normalization |
| 2023 | Harrods Limited turnover: £831.6m | Variant-level catalog analysis |
| 2024 | Harrods Limited turnover: £898.4m | Department-level trend tracking |
| 2025 | Harrods Limited turnover: £894.6m | Assortment change analysis |
| 2026 | Accounts for the year ended 31 January 2026 filed with Companies House | Compare financial context separately from online catalog metrics |
The turnover figures above are for Harrods Limited and should not be confused with the financial results of other Harrods group entities. The official >Companies House filing history provides the relevant company-account records.
For category managers, the main benefit of department-level collection is consistency. Each product should be assigned to a defined category hierarchy, with duplicate URLs and repeated product appearances handled through a documented deduplication process. This allows teams to answer practical questions: Which brands have entered a department? Which products have disappeared? Are new variants expanding assortment breadth? Are price movements concentrated in particular departments?
The resulting dataset can support buying decisions, assortment planning, competitive research, and catalog quality reviews. It should preserve the original source fields so that analysts can trace every reported count or price back to an observable product record.
Harrods product category share analysis, luxury retail data scraping requires a clearly defined catalog population, consistent category assignments, and a repeatable counting method. Without these controls, a department's reported share may reflect navigation structure or duplicate product appearances rather than its true representation in the observed online assortment.
Harrods publicly presents a broad product range across fashion, beauty, jewellery, watches, home, food, and other departments. Its website also separates collections such as new arrivals, bestsellers, exclusives, and special offers.
This distinction is important. A single product may appear in the main category, a brand page, a promotional collection, and a bestseller list. Counting each appearance as an independent product would overstate the total catalog and distort the category-share calculation.
| Year | Verified public category-share percentage | Appropriate next step |
|---|---|---|
| 2020 | Not identified | Recover dated catalog records |
| 2021 | Not identified | Standardize department definitions |
| 2022 | Not identified | Deduplicate product listings |
| 2023 | Not identified | Establish a consistent denominator |
| 2024 | Not identified | Compare like-for-like category snapshots |
| 2025 | Not identified | Preserve product and variant identifiers |
| 2026 | No audited public online category-share series identified | Calculate shares from a documented snapshot |
The calculation should be straightforward:
Category Share (%) = (Distinct Products in a Category ÷ Distinct Products in the Defined Catalog) × 100
The denominator should remain consistent across reporting periods. If the study covers only fashion and beauty, the results must not be described as shares of Harrods' entire online catalog.
Three complementary measurements are particularly useful:
These measures describe different aspects of assortment and should not be combined into a single percentage.
For example, a department may contain many brands but relatively few products per brand. Another department may contain fewer brands with extensive product ranges. Both could have similar product shares but very different brand shares.
The commercial value comes from comparing these measures with historical snapshots. Analysts can identify expanding departments, changing brand representation, and price-tier gaps without confusing catalog breadth with sales performance. Actual revenue contribution or product demand should only be reported when supported by suitable sales or demand data.
Digital shelf analytics connects product catalog observations with price, availability, assortment, and promotional history. For a luxury retailer, this creates a consistent view of how the online offer changes over time and where commercial teams may need to investigate.
Harrods' published website includes new arrivals, featured brands, exclusives, bestsellers, and selected promotional collections. Its store guide also documents its broad department structure. These public-facing features provide useful starting points for a structured catalog monitoring program.
The financial environment also reinforces the importance of distinguishing business performance from product-level indicators. Retail Gazette reported that Harrods' turnover reached approximately £1.08 billion for the year ended 31 January 2026, an increase of 1.2%, while pre-tax profit recovered to £84.9 million. It also reported continuing investment in the Knightsbridge flagship and its womenswear offer.
| Year | Verified company-level indicator | What it can and cannot establish |
|---|---|---|
| 2020 | No comparable public online catalog series identified | No direct SKU baseline |
| 2021 | Harrods Limited turnover: £429.5m | Corporate trading context only |
| 2022 | Harrods Limited turnover: £581.9m | Not a category-level sales measure |
| 2023 | Harrods Limited turnover: £831.6m | Not an online price index |
| 2024 | Harrods Limited turnover: £898.4m | Not an assortment share |
| 2025 | Harrods Limited turnover: £894.6m | Not a product availability measure |
| 2026 | Harrods reported approximately £1.08bn turnover for the year ended 31 January 2026 | Corporate performance, not catalog growth |
The 2021–2025 series refers to Harrods Limited, while the 2026 figure is reported in coverage of the latest Harrods results. Differences in reporting entities and periods should be checked before combining financial series.
A useful monitoring workflow should capture:
These observations should be stored historically so that analysts can compare a current snapshot against a prior period. A single collection can describe what was visible on that date; it cannot establish whether the same product was available throughout the year.
The most useful reporting layer converts these records into concise commercial outputs: price-band distributions, category-share tables, brand counts, assortment-change reports, and exception lists. This helps buying, merchandising, pricing, and e-commerce teams prioritize investigations instead of manually checking large numbers of product pages.
Actowiz Metrics can support luxury retailers, brand teams, and market researchers that need structured product intelligence across complex online catalogs. The objective is to establish a repeatable process for collecting, validating, categorizing, and analyzing public product information while preserving source context and historical observations.
E-commerce & D2C analytics, luxury retail data scraping workflows can be organized around specific commercial questions rather than raw collection volume. For a Harrods-focused study, this may include:
Data quality is particularly important in luxury retail. Product titles may differ across pages, variants can have separate listings, and the same item may appear in multiple collections. Without a clear methodology, brand counts and assortment totals can become unreliable.
Actowiz Metrics can help design a reporting framework that records collection dates, defines counting rules, and separates directly observed information from calculated metrics. Collection methods should respect applicable website terms, access controls, and data protection requirements.
The result is a more transparent basis for commercial decisions. Rather than relying on unverified assumptions about Harrods' category percentages or total online SKU count, teams can work from documented observations and clearly defined calculations.
Harrods offers a useful case study in luxury retail because its published catalog spans fashion, beauty, fine jewellery, watches, home, food, and other departments. Its official store guide confirms this breadth, while its published financial reporting provides context about the retailer's wider business performance.
However, company turnover cannot establish online SKU counts, brand counts, price-band distributions, or category shares. Those measures require dated product-level observations, consistent category definitions, and transparent calculations. Historical comparisons also require archived snapshots rather than estimates presented as verified facts.
For 2026, the most useful priorities are to establish a clean catalog baseline, measure distinct products and brands by department, segment prices within comparable categories, preserve promotional and availability history, and track changes through repeatable snapshots.
Ready to build a source-backed luxury catalog intelligence workflow? Contact Actowiz Metrics to discuss a tailored solution for product assortment analysis, brand counts, price-band monitoring, and category-level competitive intelligence through reliable luxury retail data scraping!
Expert blogs, research reports and infographics — practical, data-driven reading across e-commerce and quick-commerce.
Most fields are optional — the more you share, the better your sample.
.webp "infographics")
.webp "infographics")