BLOG
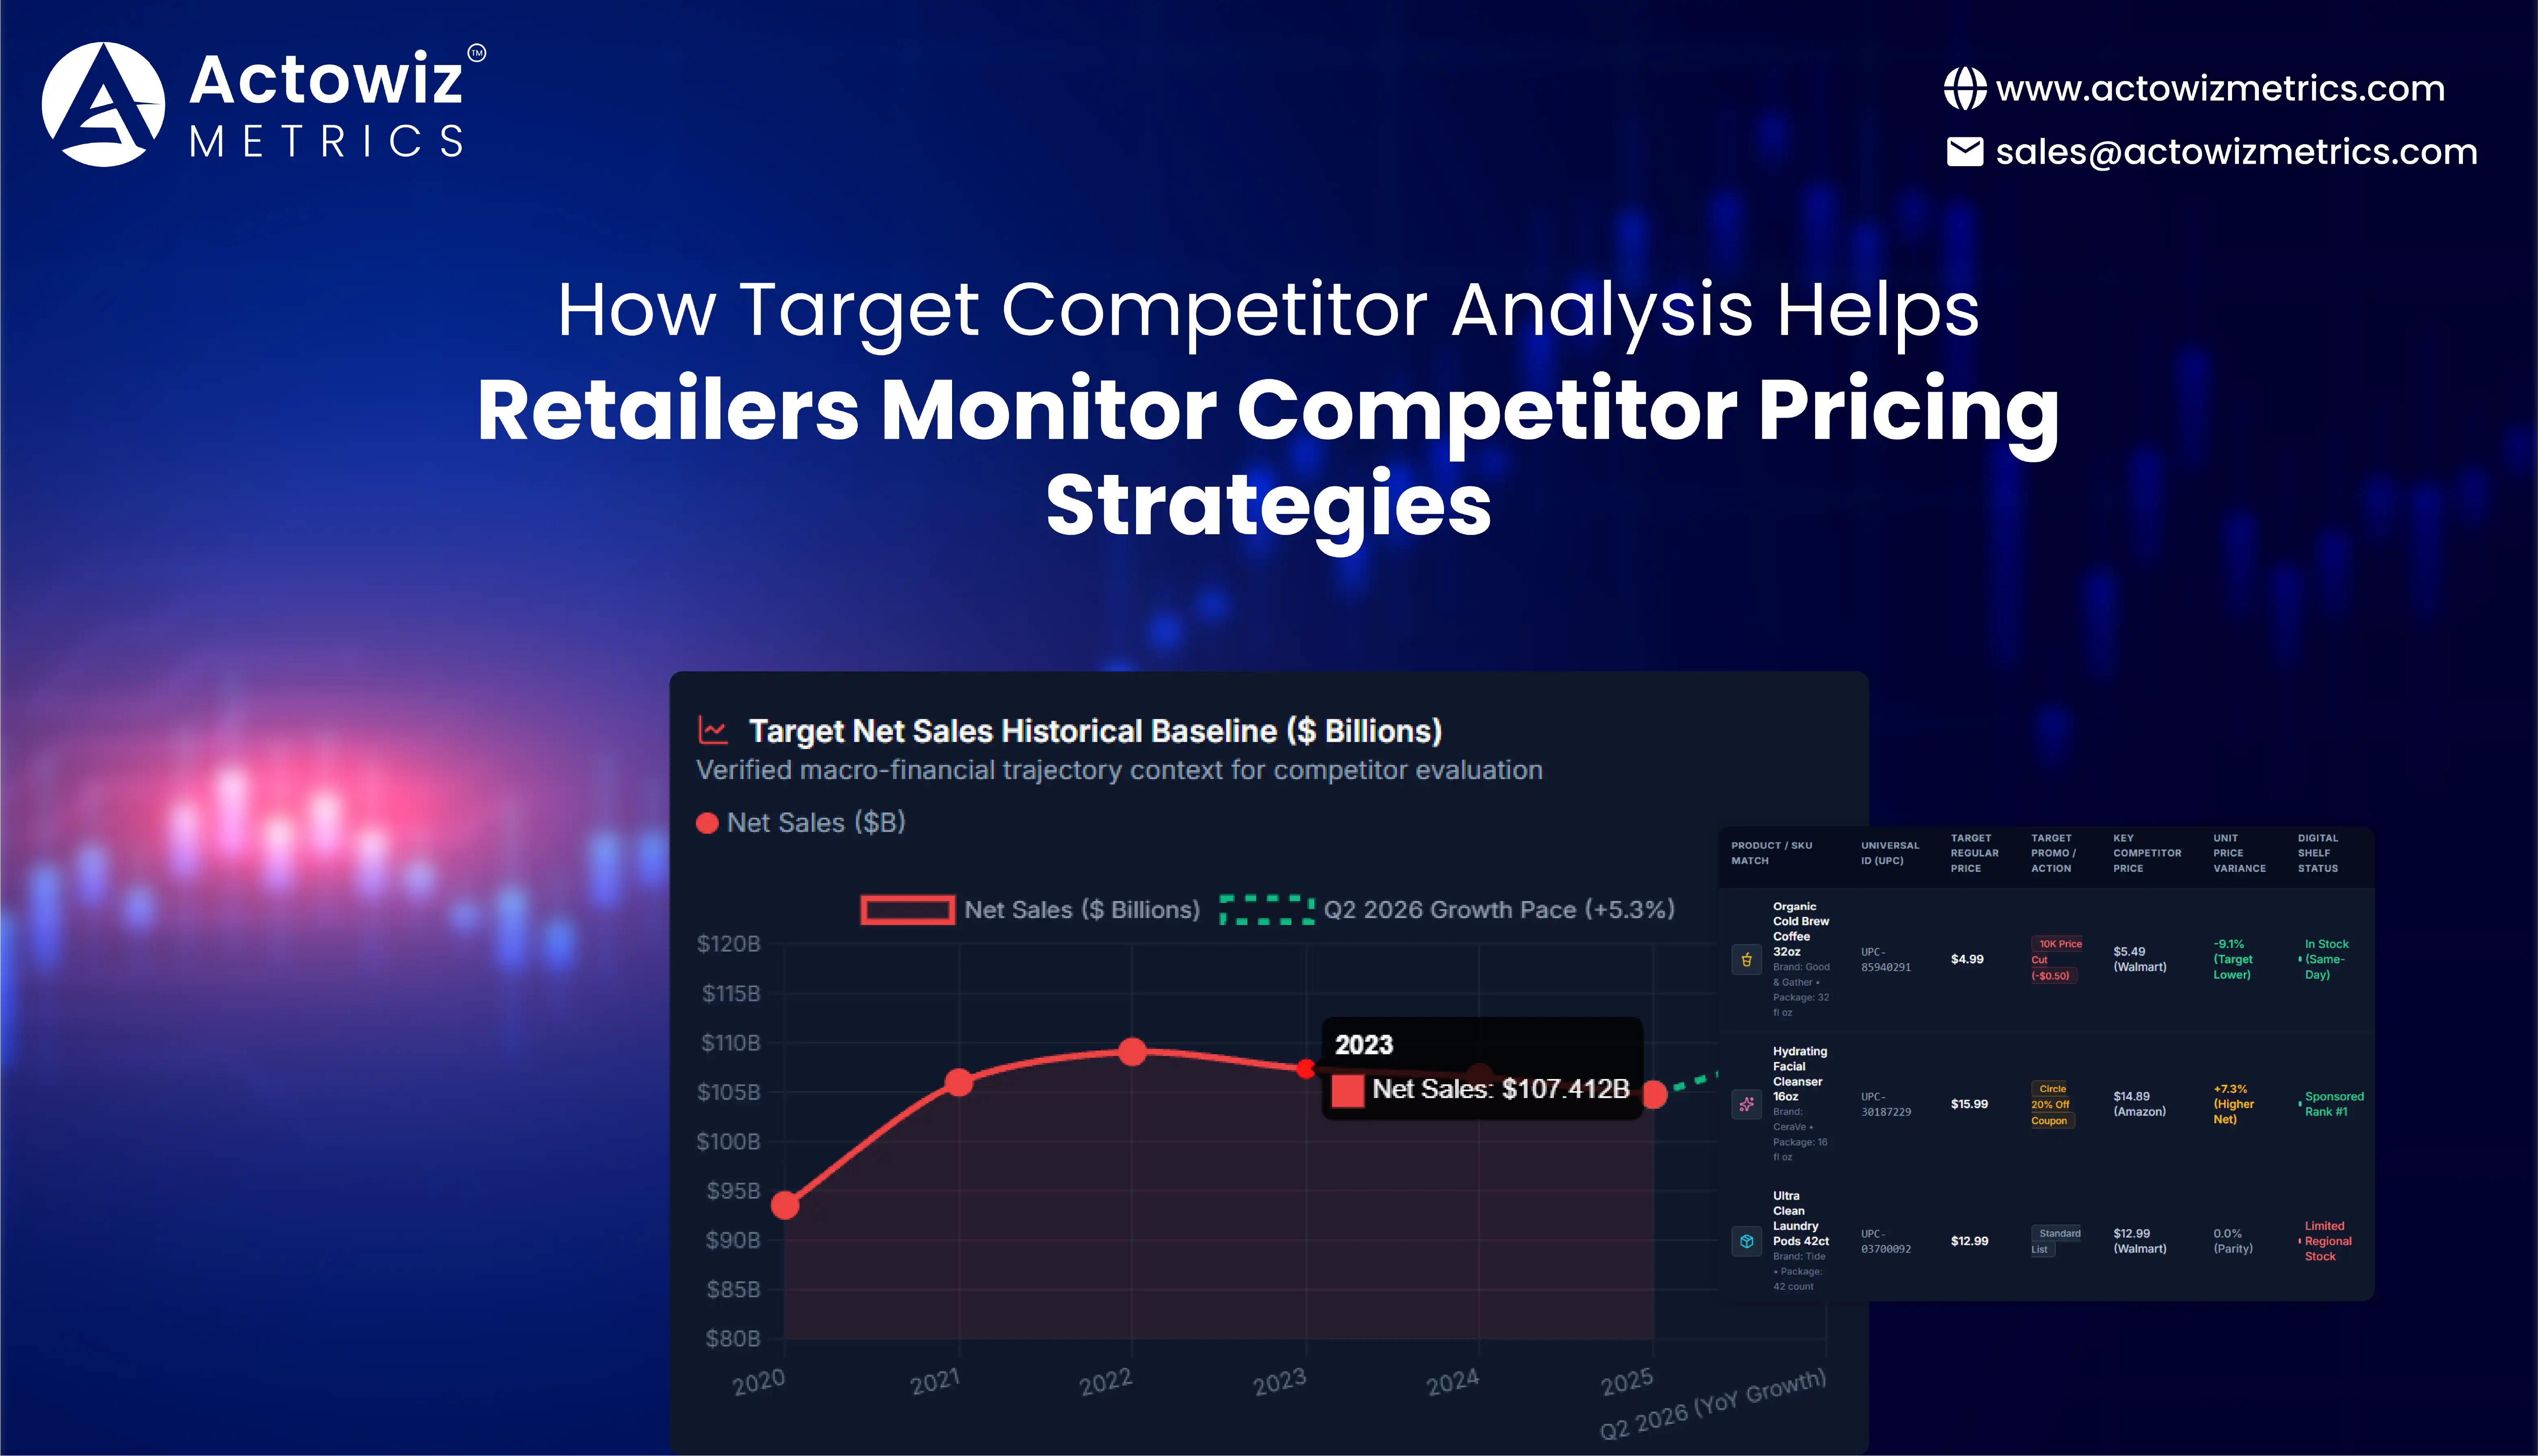


Grocery Ecommerce Trends 2026 are being shaped by rapid delivery, AI-powered product discovery, competitive pricing, retail media, and real-time inventory visibility. For grocery retailers and FMCG brands, success increasingly depends on understanding where products are available, how prices compare, and which digital factors influence customer purchases. Grocery Analytics helps businesses turn marketplace data into actionable decisions about assortment, promotions, availability, and competitive positioning.
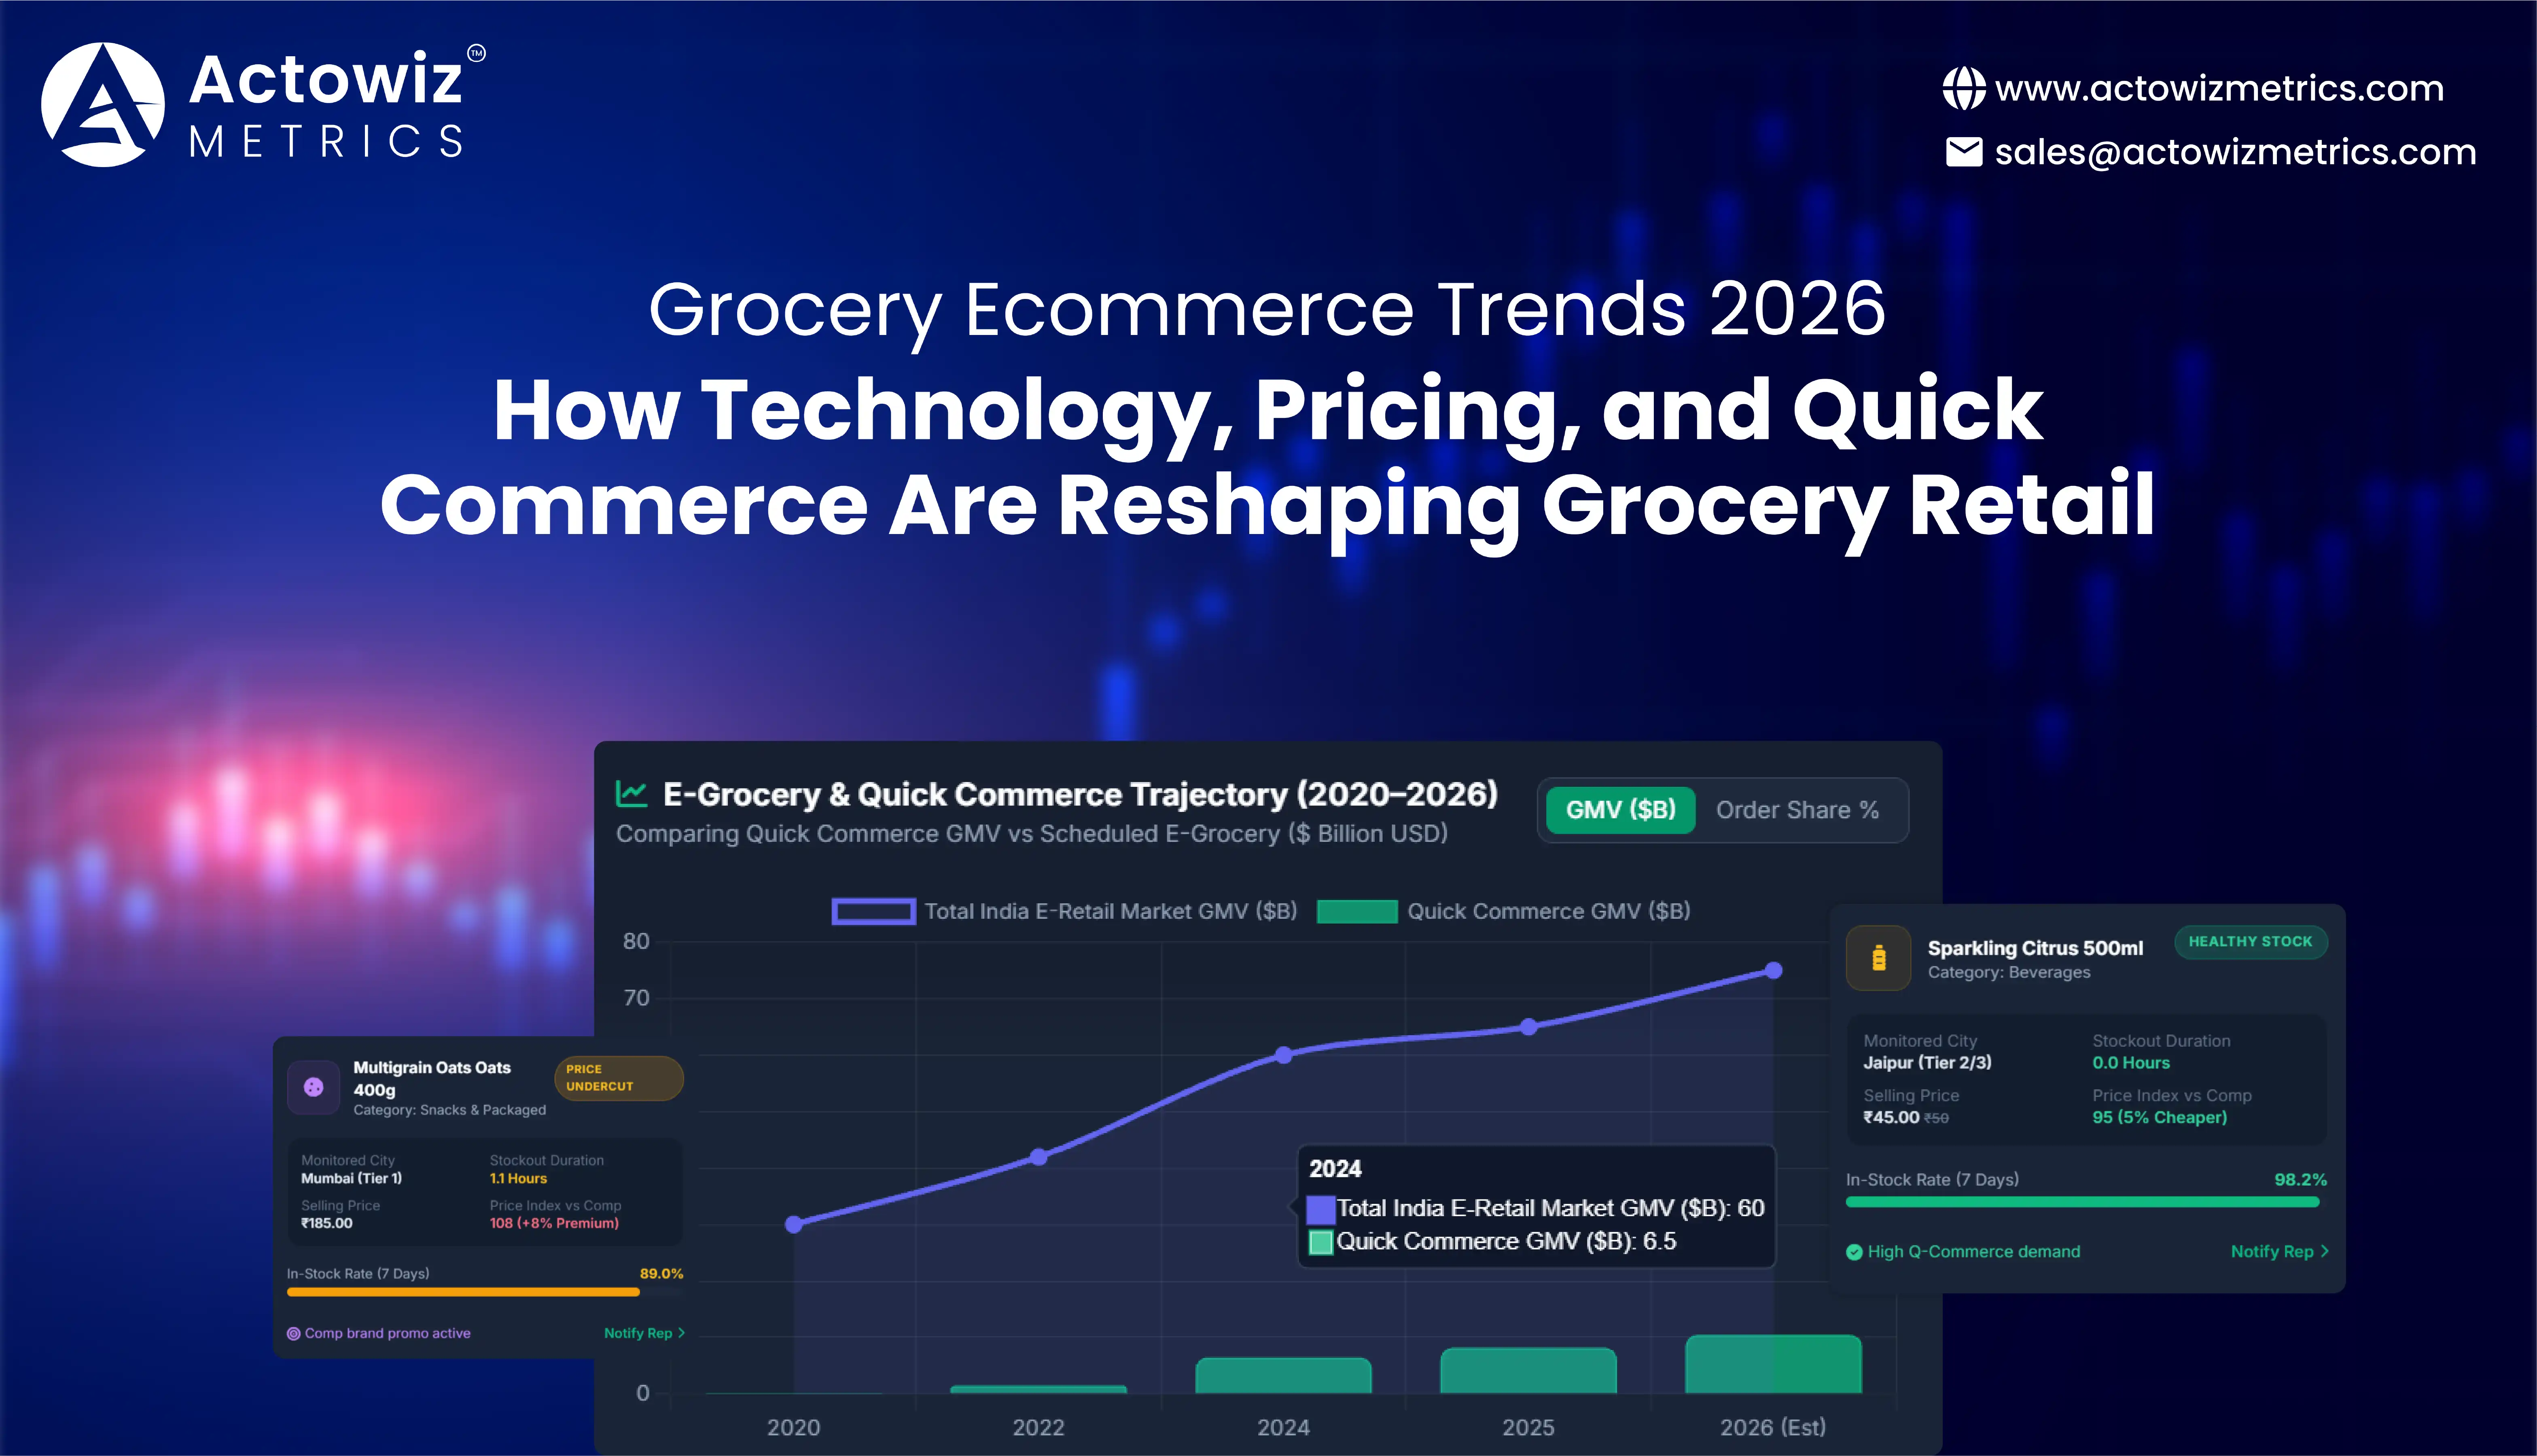
India is an important market to watch. Bain & Company and Flipkart reported that India's e-retail market reached approximately $60 billion in gross merchandise value in 2024, while quick commerce accounted for more than two-thirds of e-grocery orders. These developments show why brands need stronger digital shelf monitoring and a more localized understanding of online grocery demand. Source: Bain & Company and Flipkart's How India Shops Online 2025.
Online Grocery Shopping Trends in 2026 reflect a market in which consumers can choose between scheduled grocery delivery, store pickup, traditional e-commerce, and rapid delivery through quick-commerce apps. The most effective channel depends on the shopper's needs, location, basket size, product type, and delivery expectations.
Bain and Flipkart's 2025 report highlighted the growing importance of high-frequency categories, including grocery, lifestyle, and general merchandise, in India's online retail expansion. It also found that three in five new online shoppers since 2020 came from Tier-3 cities or smaller locations. This widening customer base creates opportunities for brands, but it also increases the importance of local assortment planning and regional availability.
For grocery businesses, monitoring only total sales is insufficient. Teams should evaluate product availability, displayed prices, pack sizes, ratings, promotional placements, and search visibility across relevant platforms. A product that performs well in one city may have limited visibility or availability in another.
What does the available market data show?
| Year | Verified market indicator | Business implication |
|---|---|---|
| 2020 onward | Three in five new Indian e-retail shoppers since 2020 came from Tier-3 cities or smaller locations. | Track demand and availability beyond major metropolitan areas. |
| 2022 | India's quick-commerce market was approximately $1.5 billion in gross merchandise value, according to the Bain–Flipkart report. | Rapid delivery was already becoming a distinct grocery channel. |
| 2024 | India's e-retail market reached approximately $60 billion in GMV, according to Bain and Flipkart. | Online competition extends across more categories and shopper segments. |
| 2025 | Bain and Flipkart's report identified quick commerce, trend-first commerce, and hyper-value commerce as major forces reshaping e-retail. | Brands need channel-specific assortment and pricing strategies. |
| 2026 | Bain's How India Shops Online 2026 update describes India's e-retail market as exceeding $65 billion in 2025 and highlights continued growth potential. | Use current marketplace observations to validate demand rather than relying on forecasts alone. |
Sources: Bain–Flipkart, How India Shops Online 2025 and Bain & Company's 2026 report summary. The years represent different published indicators, not a directly comparable annual grocery-sales series.
For category managers, the practical response is to create a marketplace scorecard that tracks stock status, selling price, promotion frequency, and product visibility by city and channel. This helps teams identify where shopper demand may be constrained by weak availability or uncompetitive offers.
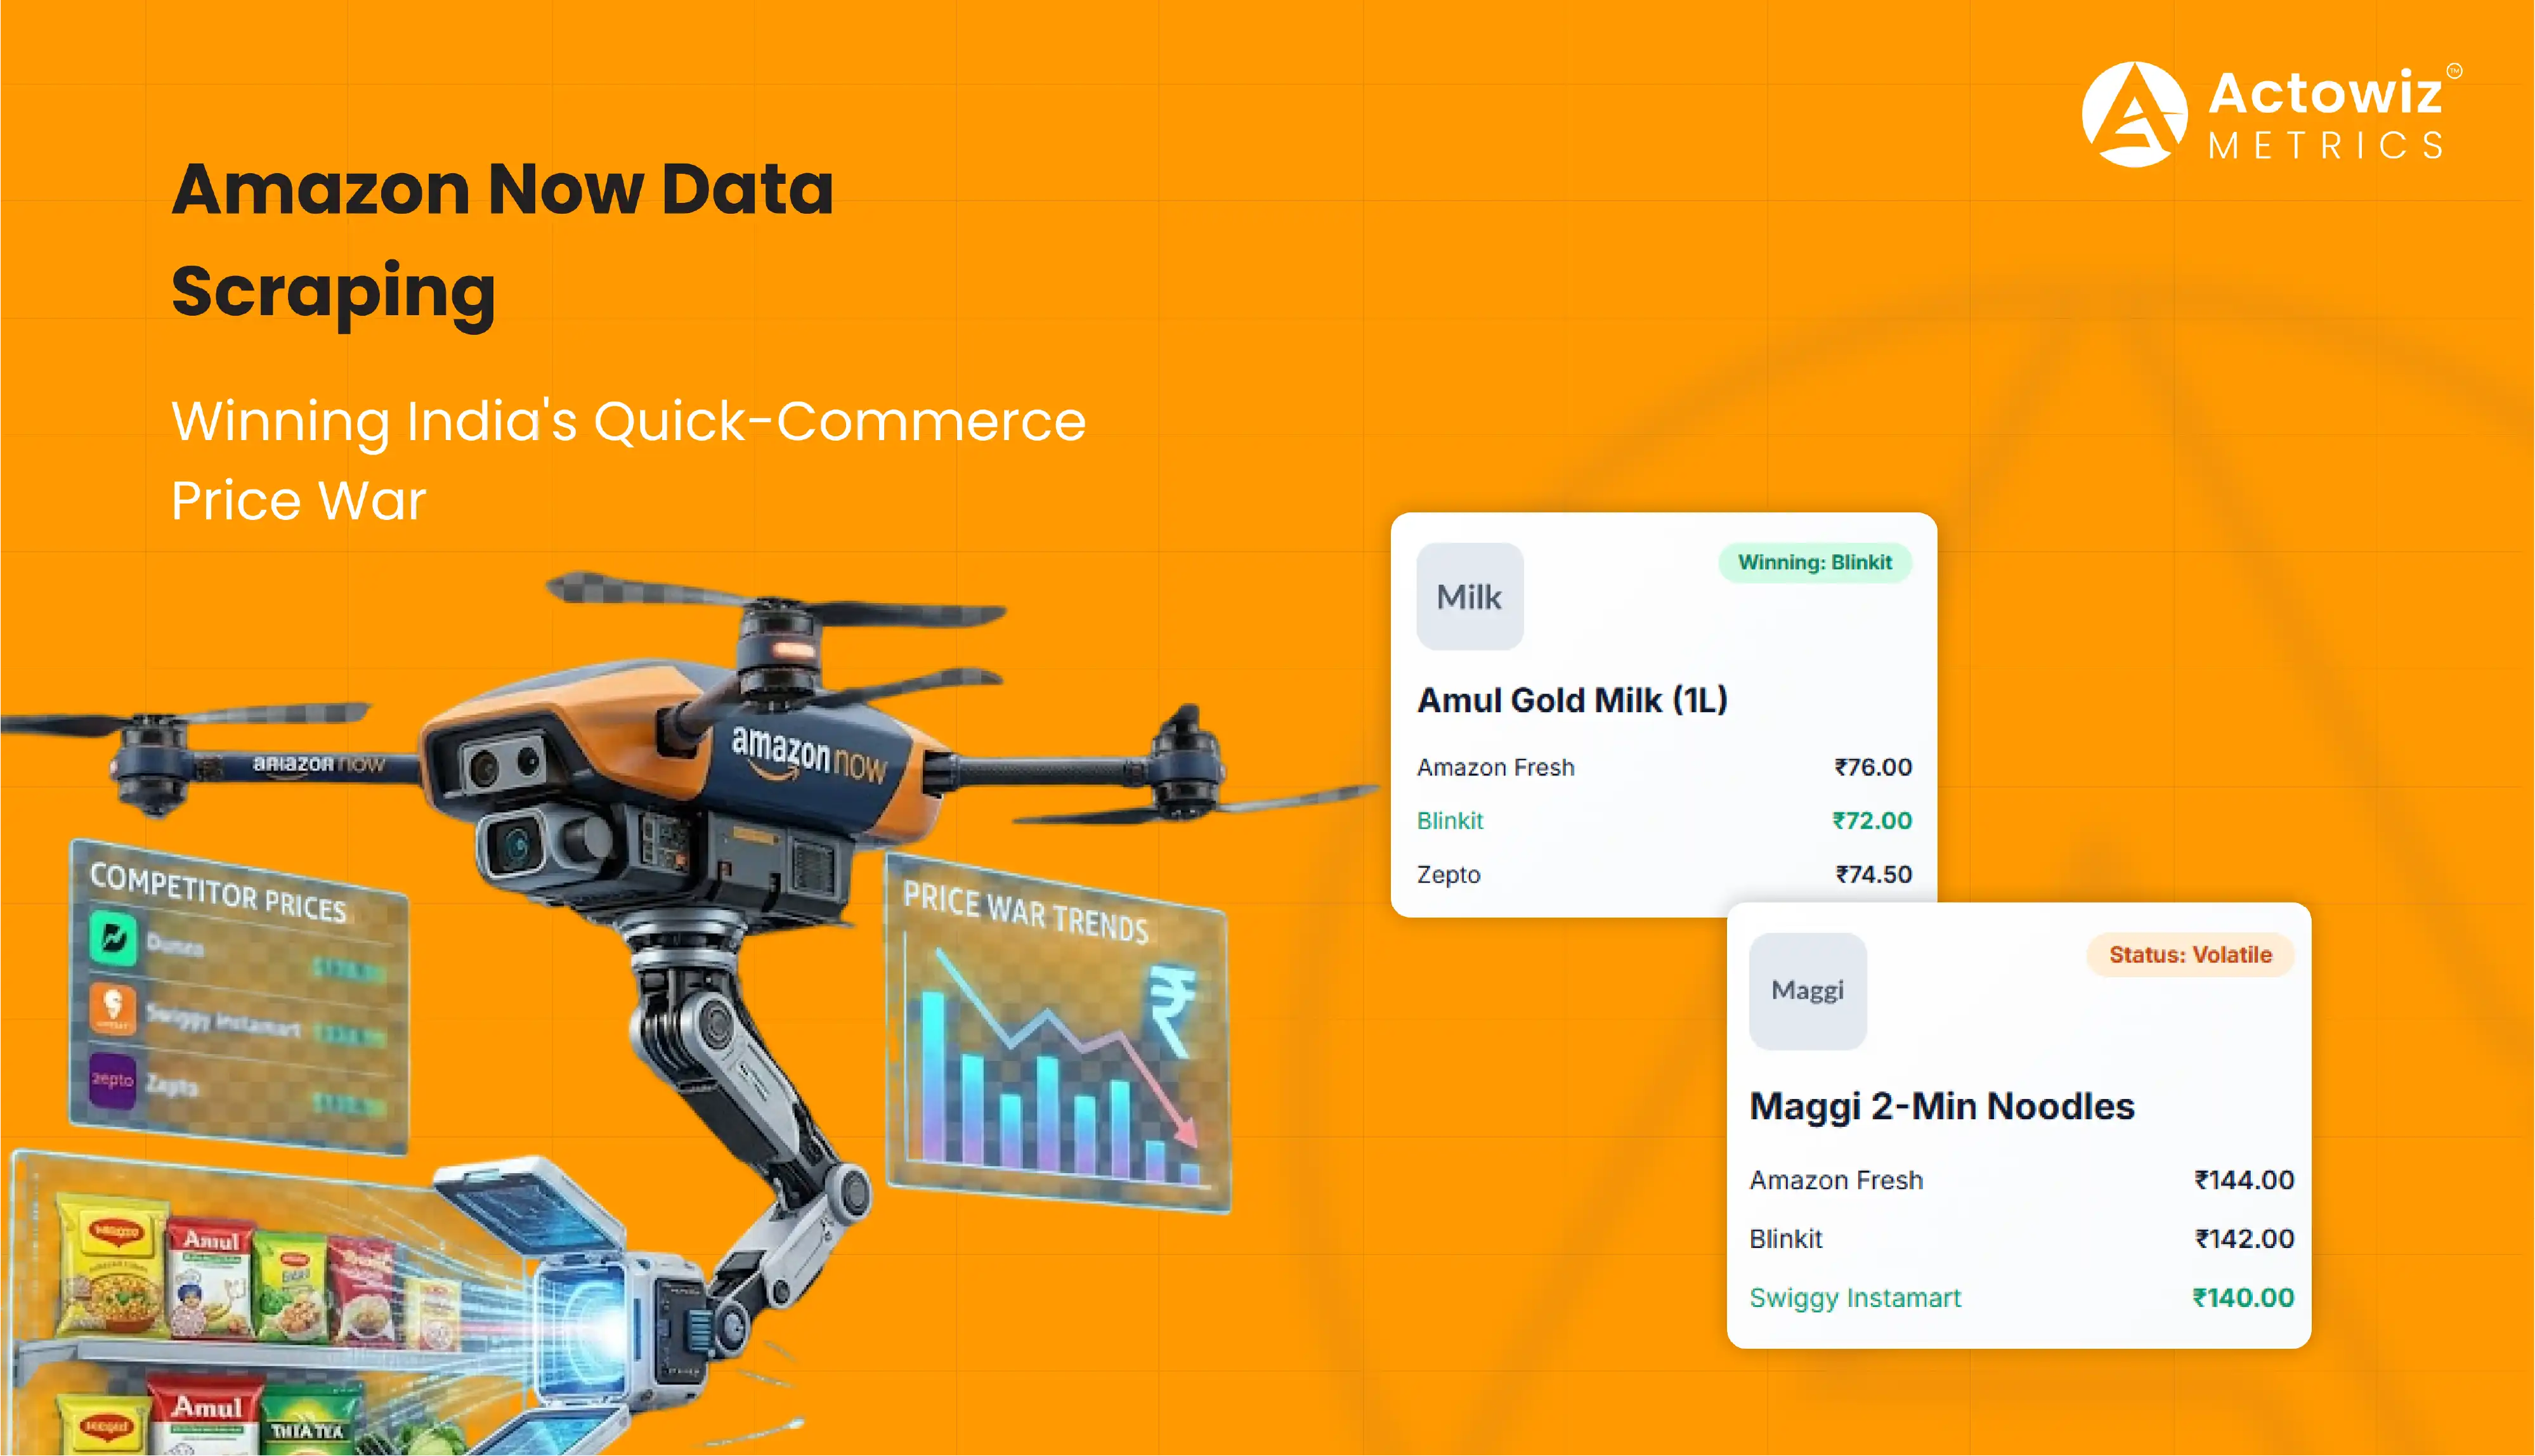
Quick Commerce Growth and Grocery Market Trends show how rapid delivery has moved from a convenience option to a major part of India's online grocery landscape. Quick-commerce services typically promise delivery within minutes, relying on localized inventory and fulfillment networks to serve nearby customers.
According to Bain and Flipkart's 2025 report, quick commerce accounted for more than two-thirds of India's e-grocery orders in 2024 and approximately one-tenth of total e-retail spending. The report estimated the segment's 2024 gross merchandise value at $6–7 billion, compared with around $1.5 billion in 2022. These figures illustrate the speed of the channel's expansion. Source: Bain–Flipkart report.
This growth changes how grocery brands compete. A product's availability in a warehouse or on a national marketplace does not guarantee that it can be ordered from a nearby quick-commerce store. Local stockouts, changing assortments, and regional pricing can affect the customer experience at a neighborhood level.
Brands should therefore monitor listings across platforms such as Blinkit, Zepto, and Swiggy Instamart where relevant to their distribution. Key metrics include listed assortment, in-stock status, price per unit, promotional activity, and differences between locations.
Retailers can use these signals to identify gaps between advertised availability and local execution. FMCG companies can also compare the availability of competing brands within the same category.
The main operational priority is to connect digital monitoring with replenishment and trade-marketing decisions. If a product repeatedly disappears from a high-demand location, teams should investigate stock allocation, replenishment frequency, and platform-level assortment before increasing promotional spending.
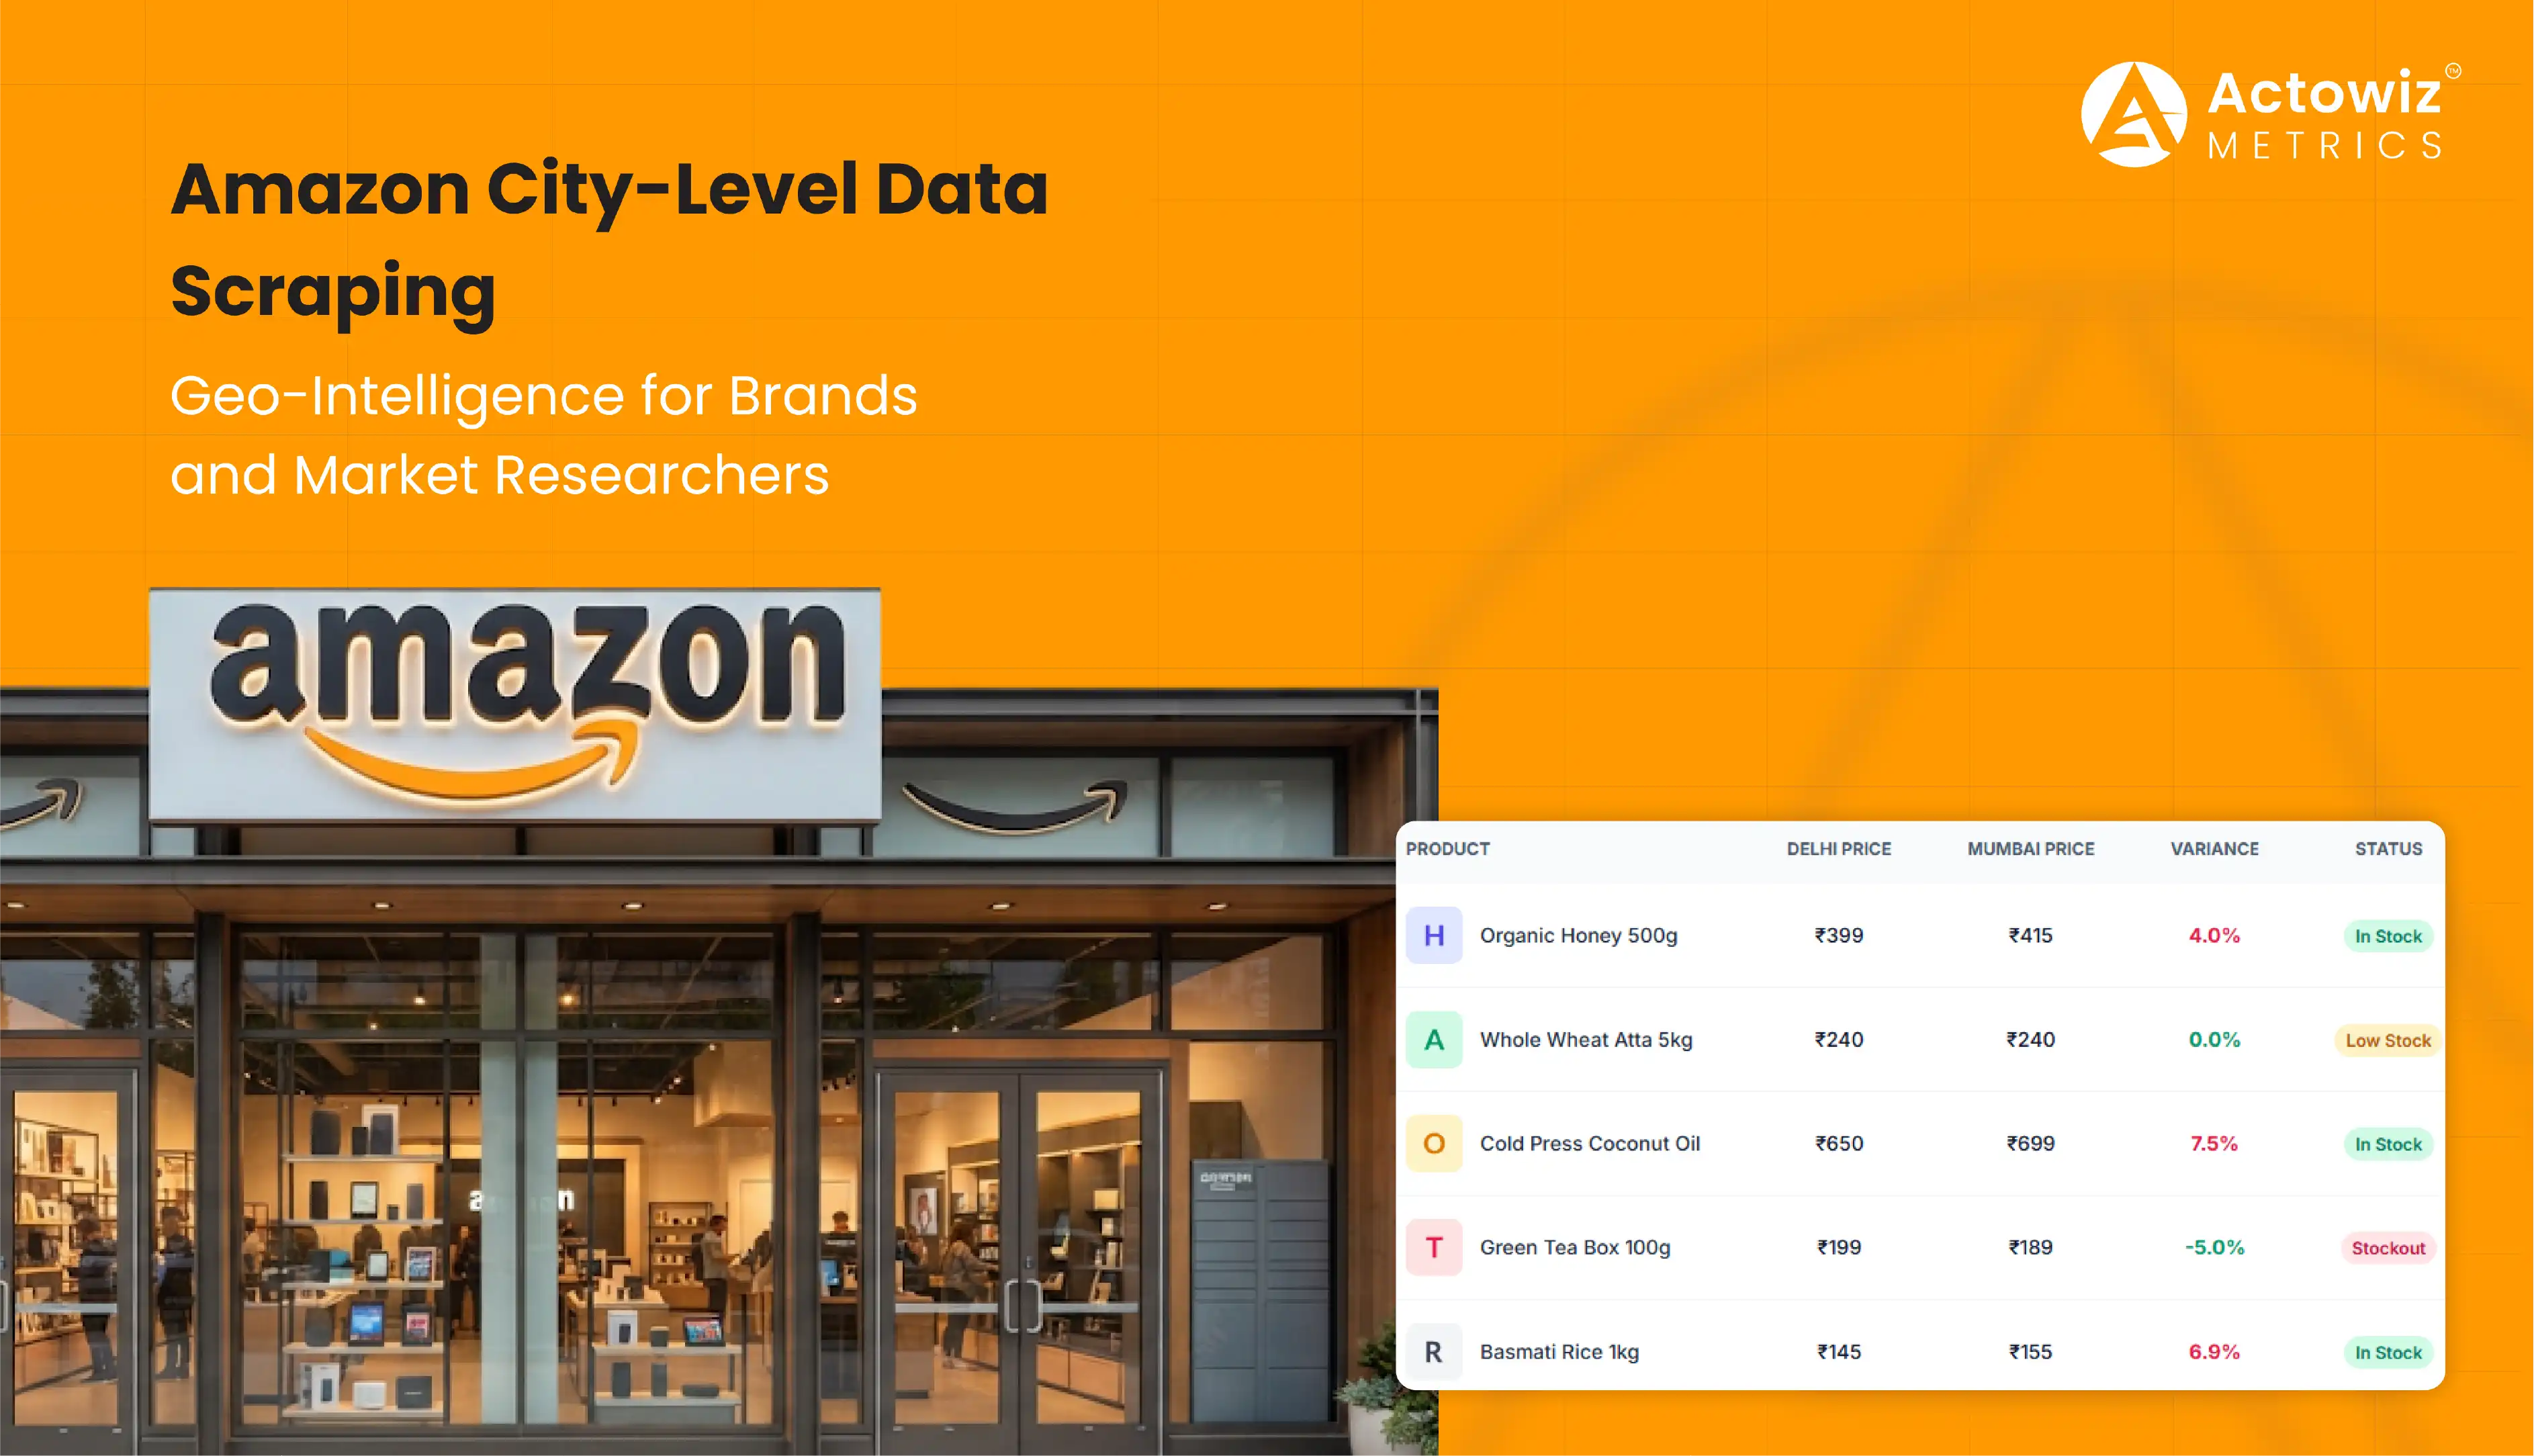
Hyperlocal Grocery Product Availability Monitoring helps retailers and FMCG brands understand whether products can actually be purchased in specific service areas. This matters because grocery fulfillment depends on local inventory, delivery coverage, and the assortment carried by individual stores or fulfillment centers.
A national availability report can hide important gaps. A product may appear online in one city but be unavailable in another, even when both locations belong to the same retail chain. For quick commerce, the relevant unit of analysis may be a delivery zone or a specific store catchment area.
Monitoring should capture product-level information, including listing status, stock indicators, pack size, price, promotions, and the time at which each observation was collected. Repeated observations can help teams distinguish persistent stock problems from short-lived availability changes.
What should an availability dashboard measure?
| Metric | What it reveals | Recommended action |
|---|---|---|
| In-stock rate | How often a product appears available across monitored observations | Identify recurring availability gaps. |
| Stockout duration | How long a product remains unavailable between observations | Prioritize replenishment and investigate fulfillment issues. |
| Location coverage | Which monitored areas carry the product | Find geographic assortment gaps. |
| Competitor availability | Whether competing products remain purchasable during a stockout | Assess potential lost visibility and competitive exposure. |
| Price and promotion status | Whether the current offer matches the intended commercial strategy | Review pricing execution and promotion consistency. |
These are recommended operational metrics, not published industry benchmarks. Businesses should define their own targets based on category characteristics, service-level commitments, and platform coverage.
The value of Grocery Ecommerce Trends 2026 analysis is the ability to connect these observations with decisions. For example, a persistent stockout in a priority service area may warrant a supply-chain investigation, while a missing product listing may require attention from the marketplace account team.
Brands should also validate whether the monitoring data reflects the shopper's actual delivery location. Availability can differ by postcode, time, and platform, so the geographic scope and timestamp of each observation should be retained.
Grocery Retail Media and Digital Shelf Trends reflect the growing relationship between product discovery, sponsored placements, promotions, and measurable online transactions. Grocery platforms can offer brands advertising opportunities close to the point of purchase, making digital shelf visibility an important part of commercial planning.
Instacart's 2024 annual report describes advertising products such as sponsored product ads, display ads, coupons, and brand pages. It also explains that its advertising offering uses transaction data to help brands measure performance and understand shopper behavior. Source: Instacart's 2024 Form 10-K.
For brands selling through multiple grocery retailers, advertising performance should be assessed alongside organic visibility, price competitiveness, and availability. A sponsored listing may attract attention, but an unavailable product or an uncompetitive offer can undermine the value of that exposure.
A practical digital shelf review should compare:
Retail media teams should evaluate whether increased visibility corresponds with meaningful commercial outcomes. A campaign review that considers impressions or clicks alone may miss the effects of stockouts, price changes, or assortment differences.
For category managers, the key is to coordinate advertising calendars with inventory readiness. Before increasing media investment, verify that the product is available in the targeted locations, the listing is accurate, and the offer is competitive. This reduces the risk of paying to promote a product that shoppers cannot readily purchase.
AI-Driven Grocery Product Discovery Trends are changing how shoppers search, compare, and select products. Search ranking, recommendations, personalized offers, and conversational shopping interfaces can influence which products customers encounter during their buying journey.
In February 2026, Meta and the Retailers Association of India reported that social media influenced 77% of retail purchase decisions in their study, with Meta's platforms driving 96% of social discovery. The findings cover retail broadly rather than grocery alone, so they should not be interpreted as grocery-specific conversion rates. Source: Meta and RAI, February 2026.
For grocery brands, AI-driven discovery increases the importance of structured product information. Accurate titles, relevant attributes, clear pack sizes, correct categories, and consistent product imagery help shoppers and digital systems interpret a listing.
Brands should monitor search visibility for high-intent queries such as product names, brands, sizes, and category terms. They should also check whether the displayed product information accurately communicates important distinctions, including variants, quantities, and dietary attributes where applicable.
AI can support internal analysis by grouping recurring stockout patterns, identifying unusual price changes, classifying competitor promotions, and summarizing changes across large product catalogs. However, teams should validate automated findings against source data, especially when decisions affect pricing, compliance, or product claims.
What should brands prioritize?
The practical opportunity is not simply to adopt AI. It is to combine automation with dependable marketplace data so that teams can identify issues faster and make better-informed decisions.
Online Grocery Competitor and Market Share Tracking helps brands assess their position across retailers, marketplaces, and quick-commerce platforms. It can reveal differences in assortment, pricing, promotions, availability, and digital visibility that are difficult to identify through occasional manual checks.
Market share requires particular care. A brand's share of monitored listings, search results, or available products is not the same as its share of sales. Reliable sales market-share calculations require a suitable sales or transaction dataset and a clearly defined market, period, and category.
When sales data is unavailable, brands can still develop useful competitive indicators. These may include assortment share, share of monitored search placements, relative price index, promotion frequency, and availability rate. Such indicators should be labeled clearly and should not be presented as sales market share.
For example, a brand may have fewer listed products than a competitor but maintain better availability across priority locations. Another brand may offer lower prices but receive less search visibility. These patterns can guide further investigation, although they do not establish a causal relationship with sales on their own.
A useful competitor-monitoring framework should cover the following:
For Grocery Ecommerce Trends 2026, brands should segment these indicators by platform, geography, product category, and observation date. This makes comparisons more actionable and reduces the risk of treating different retail environments as interchangeable.
Actowiz Metrics can support grocery and FMCG teams by helping them collect and analyze marketplace information for digital shelf monitoring, price benchmarking, product availability analysis, and competitor tracking. Grocery & FMCG Digital Shelf Analytics can help businesses organize these signals into a more consistent view of how their products appear across online channels.
Potential applications include:
These capabilities are most useful when data collection is aligned with a specific business decision. A revenue team may focus on price competitiveness, while supply-chain teams may prioritize stockout patterns and regional availability. Marketplace managers may need search visibility, listing accuracy, and promotional information.
Grocery Ecommerce Trends 2026 should be evaluated through the metrics that matter to each team, with clear definitions and consistent observation windows. Actowiz Metrics can help businesses build a structured approach to marketplace intelligence, subject to the selected platforms, data availability, and monitoring scope.
Quick Commerce Analytics and broader digital shelf intelligence can help grocery retailers and FMCG brands respond to changing customer expectations, faster delivery models, and increasingly competitive online shelves. The evidence from India points to the growing importance of quick commerce, while developments in retail media and AI-driven discovery reinforce the need for reliable product-level information.
For 2026, businesses should prioritize accurate listings, local availability, competitive pricing, promotion measurement, and consistent monitoring across relevant platforms. They should also distinguish operational indicators—such as assortment share and in-stock rate—from actual sales market share.
The goal is to turn marketplace observations into clear actions: resolve recurring stockouts, correct listing errors, improve price positioning, and align advertising with product availability.
Ready to strengthen your grocery market intelligence? Contact Actowiz Metrics to discuss your requirements for grocery product availability monitoring, competitor price tracking, and digital shelf analytics!
Expert blogs, research reports and infographics — practical, data-driven reading across e-commerce and quick-commerce.
Most fields are optional — the more you share, the better your sample.
.webp "infographics")
.webp "infographics")