BLOG
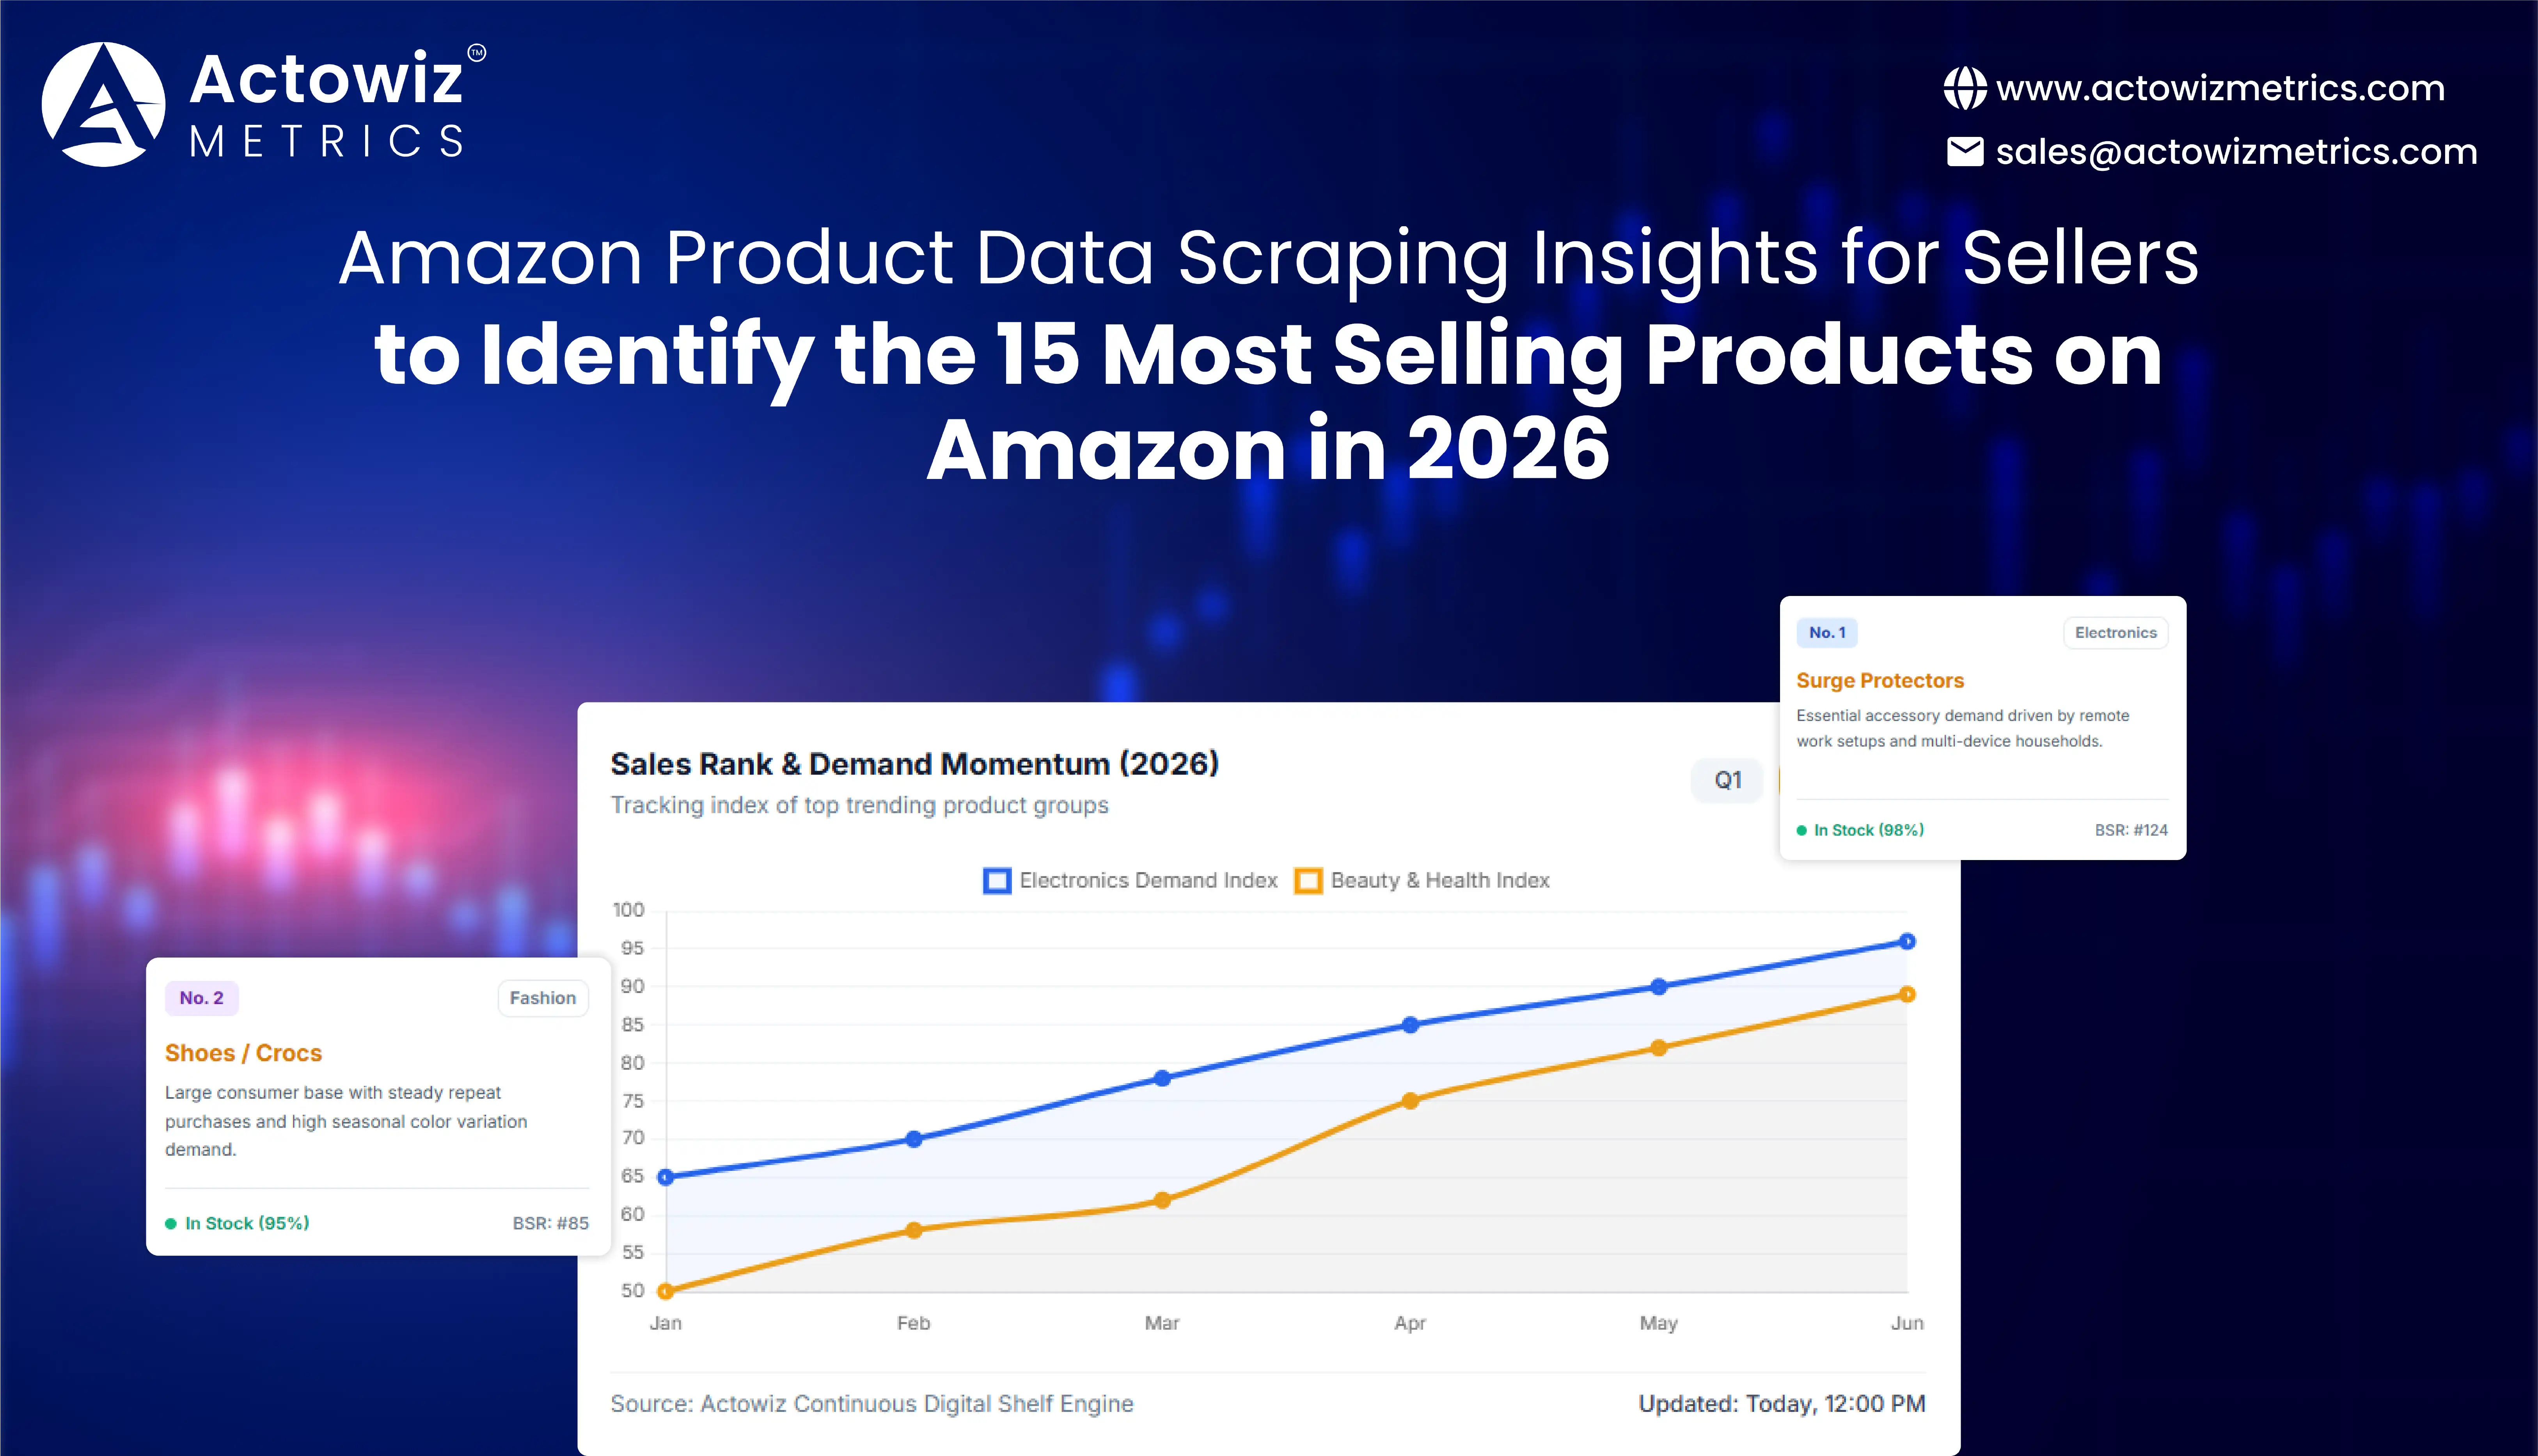




















Amazon Product Data Scraping Insights for Sellers helps brands move beyond guesswork by continuously tracking product rankings, prices, availability, reviews, categories, and competitive activity. In 2026, sellers need this intelligence to identify high-demand products, detect changes in customer preferences, and respond quickly to market movements.
Amazon itself recommends using Best Sellers lists, Best Sellers Rank, Movers & Shakers, Hot New Releases, and product research tools to identify promising opportunities. Its 2026 product guidance highlights demand across electronics, beauty, home and kitchen, health, toys, appliances, automotive, fashion, and other categories. (Sell on Amazon)
For sellers and brands, E-commerce & D2C analytics transforms this information into structured, comparable intelligence. Instead of manually checking hundreds of listings, businesses can monitor thousands of products and determine which products are gaining demand, which competitors are changing prices, and where availability gaps may create opportunities.
Amazon's 2026 guidance also emphasizes that best-selling products change frequently. Therefore, a product that performs strongly today may not hold the same position next month. Continuous data collection is more useful than one-time product research. (Sell on Amazon)
There is no single permanent global list of the "15 most selling products" because Amazon rankings vary by marketplace, category, time, and sales performance. Amazon's Best Sellers lists are updated frequently, while Movers & Shakers tracks changes in sales rank. (Sell on Amazon)
Based on Amazon's 2026 published high-demand product guidance, sellers should closely monitor product types such as:
| No. | Product/Product Type | Category | Why Sellers Should Monitor It |
|---|---|---|---|
| 1 | Surge Protectors | Electronics | Essential accessory demand |
| 2 | Shoes/Crocs | Fashion | Large consumer base |
| 3 | Acne Patches | Beauty | Strong trend-driven demand |
| 4 | Insulated Tumblers | Home & Kitchen | Lifestyle-driven purchases |
| 5 | Whey Protein | Health & Household | Repeat-purchase potential |
| 6 | Writing Tablets | Toys & Games | Educational and entertainment use |
| 7 | Ice Packs | Sports & Outdoors | Fitness and recovery demand |
| 8 | Baby Wipes | Baby | Recurring household demand |
| 9 | Cat Litter | Pet Supplies | Repeat-purchase category |
| 10 | Countertop Ice Makers | Appliances | Convenience-focused demand |
| 11 | Smartphone Screen Protectors | Cell Phone Accessories | High accessory penetration |
| 12 | USB-C Device Chargers | Computers & Accessories | Broad device compatibility |
| 13 | Gaming Headsets | Video Games | Gaming ecosystem demand |
| 14 | Wireless Lavalier Microphones | Musical Instruments | Creator and content demand |
| 15 | Under-Cabinet Lights | Home Improvement | Home-upgrade demand |
Amazon's January 2026 list identifies these product types among its high-demand and trending products, while its broader Best Sellers guidance also identifies products such as wireless earbuds, water bottles, beauty products, automotive accessories, hoodies, loafers, ice makers, and headsets. (Sell on Amazon)
The practical lesson for sellers is not simply to copy products from a list. The objective is to monitor the underlying signals: sales-rank movement, price changes, review velocity, availability, seller count, promotions, and demand seasonality.
Amazon bestseller product data collection 2026 enables sellers to create a repeatable process for identifying products with sustained or emerging demand. Instead of collecting product information manually, businesses can capture ASINs, product titles, categories, prices, ratings, reviews, availability, seller information, rankings, and promotional signals on a recurring schedule.
Amazon's own seller guidance recommends using Best Sellers lists to identify popular products and Best Sellers Rank to gauge demand. Movers & Shakers can additionally reveal products whose sales rank has changed significantly during the previous 24 hours. (Sell on Amazon)
| Data Point | Seller Use Case |
|---|---|
| Product title | Product identification |
| ASIN | SKU-level tracking |
| Category | Market segmentation |
| Best Sellers Rank | Demand benchmarking |
| Price | Competitive pricing |
| Discount | Promotion analysis |
| Rating | Customer perception |
| Review count | Market traction |
| Availability | Stock monitoring |
| Seller count | Competition measurement |
| Product position | Visibility tracking |
From 2020 onward, e-commerce sellers increasingly shifted from occasional product research toward continuous digital-market monitoring. During the pandemic period, online shopping accelerated and made product availability, pricing, and demand visibility more important. From 2021 to 2023, sellers increasingly competed across broader product catalogs and relied on structured marketplace information to identify emerging opportunities. In 2024 and 2025, automation, AI-assisted research, and richer seller analytics became increasingly important as marketplaces became more competitive. By 2026, Amazon's own seller resources emphasize recurring use of Best Sellers, Movers & Shakers, Hot New Releases, and Product Opportunity Explorer rather than relying on a one-time product search. Product Opportunity Explorer can analyze sales trends, customer reviews, return activity, search behavior, and purchasing behavior to help identify opportunities. (Sell on Amazon) For sellers, this evolution means product intelligence should operate as an ongoing data pipeline. A structured system can capture historical observations, compare changes across time, identify consistently strong products, and distinguish temporary spikes from sustained demand. The result is a more measurable approach to assortment planning and product discovery.
Amazon bestselling product availability monitoring helps sellers understand whether demand is being supported by consistent product availability. A product may have strong rankings and positive reviews, but frequent stockouts can create missed sales opportunities and allow competing listings to capture demand.
Availability data becomes especially valuable when combined with price and ranking information. For example, a seller can identify products where demand remains strong while competing listings repeatedly become unavailable.
| Signal | What It Can Reveal |
|---|---|
| In stock | Current selling opportunity |
| Out of stock | Potential demand gap |
| Limited availability | Supply pressure |
| Delivery-date change | Fulfillment changes |
| Seller availability | Competitive supply |
| Buy Box/Featured Offer changes | Offer visibility |
| Historical stock status | Recurring supply issues |
Amazon's 2026 product guidance notes that customer demand can change quickly and that best-selling products are not static. This makes historical availability data important when evaluating whether a product is consistently attractive. (Sell on Amazon)
Availability became a major e-commerce performance factor between 2020 and 2022 as supply-chain disruptions affected product inventories, delivery schedules, and consumer purchasing patterns. During 2023 and 2024, marketplace sellers increasingly focused on inventory forecasting and competitor availability because consumers could easily switch to alternative listings. In 2025, faster fulfillment and improved marketplace logistics made availability monitoring even more relevant for high-frequency categories. By 2026, the connection between demand signals and inventory decisions is increasingly data-driven. Amazon's India-focused materials also highlight the importance of fulfillment infrastructure and reliable delivery as online commerce expands beyond major metros. (Amazon Shipping India) Sellers can use historical availability observations to calculate stockout frequency, identify vulnerable competitors, and understand whether demand persists when supply changes. Combining availability with rank, price, reviews, and seller counts creates a fuller view of market conditions. This is particularly useful for FMCG, household, beauty, pet, baby, and accessory products where repeat purchasing can make consistent availability a meaningful competitive factor.
Amazon product competitor price tracking for sellers provides a structured way to understand how competitors position comparable products. Price monitoring can capture list prices, sale prices, discounts, coupons, and changes over time.
For sellers, the objective is not simply to become the cheapest listing. Instead, historical price data can reveal price ranges, promotional patterns, competitor reactions, and periods when market prices move significantly.
| Pricing Metric | Strategic Question |
|---|---|
| Current price | What does the market charge now? |
| Average price | What is the normal price range? |
| Minimum price | How aggressive is competition? |
| Maximum price | Is there premium positioning? |
| Discount percentage | How often are promotions used? |
| Price frequency | How often do competitors change prices? |
| Historical price | How has positioning changed? |
Amazon's 2026 seller resources identify pricing, competition, seasonality, average product price, and seller count as useful considerations when evaluating product opportunities. (Sell on Amazon)
Pricing intelligence evolved significantly from 2020 to 2026 as marketplace competition became more dynamic. In 2020 and 2021, rapid changes in online demand created large variations across categories, while sellers had to respond to supply constraints and changing customer behavior. From 2022 to 2024, competitive pricing became increasingly systematic as brands expanded their digital catalogs and monitored multiple sellers. In 2025 and 2026, sellers increasingly need historical price intelligence rather than isolated price snapshots. Amazon's current seller resources emphasize product price, sales trends, customer demand, competition, and seasonality when evaluating opportunities. (Sell on Amazon) A historical dataset allows sellers to identify whether a competitor consistently discounts, whether discounts occur around specific seasons, and whether price reductions correspond with ranking improvements. It can also help brands identify pricing gaps where their products are significantly above or below comparable listings. For D2C brands, this information supports pricing reviews, promotional planning, assortment decisions, and marketplace positioning. The strongest approach combines price observations with review volume, availability, ranking, and seller activity so that price is analyzed as one component of market performance rather than an isolated metric.
Amazon product sales trend data scraping gives sellers the historical context required to distinguish short-term popularity from sustained market demand. A single Best Sellers snapshot cannot explain whether a product is consistently performing well or simply experiencing a temporary spike.
The main Amazon Product Data Scraping Insights for Sellers opportunity is therefore longitudinal analysis. Sellers can track ranking movements, reviews, pricing, availability, and seller activity across weeks or months.
| Trend Signal | Possible Interpretation |
|---|---|
| Improving rank | Increasing sales momentum |
| Falling rank | Weakening relative demand |
| Rapid review growth | Growing customer adoption |
| Stable high ranking | Sustained demand |
| Repeated seasonal spikes | Seasonal opportunity |
| Increasing seller count | Rising competition |
| Falling price | Competitive pressure |
Amazon explains that Movers & Shakers is updated hourly and shows products with the biggest sales-rank gains over the previous 24 hours. (Sell on Amazon)
The transition from static product research to trend intelligence accelerated throughout 2020–2026. In 2020, sellers frequently focused on immediate demand and inventory availability because consumer behavior was changing rapidly. Between 2021 and 2023, historical product information became increasingly useful for identifying post-pandemic demand normalization and category shifts. From 2024 onward, sellers had access to more sophisticated marketplace research tools and increasingly automated workflows. In 2025 and 2026, Amazon's own Product Opportunity Explorer and Best Sellers ecosystem demonstrate the growing importance of sales trends, purchasing behavior, reviews, seasonality, average units sold, average prices, and seller counts. (Sell on Amazon) This means sellers can move from asking "What is selling today?" to asking "What is gaining momentum, how consistently is it performing, and what competitive conditions surround it?" Historical datasets also allow businesses to create trend scores, detect product acceleration, compare categories, and identify early signals before a product becomes saturated. For brands launching new products, this approach can support market validation and help prioritize categories with measurable customer activity.
Amazon bestseller product analytics for e-commerce sellers converts raw marketplace observations into measurable business intelligence. Instead of maintaining a spreadsheet of product URLs, sellers can create dashboards that show product momentum, pricing, availability, reviews, and competitive intensity.
A useful analytics framework can score products across multiple dimensions:
| Analytics Dimension | Example KPI |
|---|---|
| Demand | Rank movement |
| Customer interest | Review growth |
| Pricing | Average selling price |
| Competition | Seller count |
| Availability | Stockout frequency |
| Promotion | Discount frequency |
| Product maturity | Review-to-sales trend |
| Seasonality | Monthly performance |
Amazon's Product Opportunity Explorer provides insights into customer purchasing behavior, reviews, seasonality, search volume and growth, average units sold, average price, and the number of sellers within a niche. (Sell on Amazon)
E-commerce analytics moved from descriptive reporting toward predictive and decision-oriented intelligence between 2020 and 2026. Early marketplace reporting primarily answered questions such as what products were listed and what prices were displayed. As competition intensified from 2021 onward, businesses began combining pricing, reviews, availability, and ranking data. Between 2023 and 2025, AI and automated analytics increasingly helped sellers identify relationships across large datasets. By 2026, marketplace opportunity analysis can incorporate sales trends, search behavior, customer purchasing behavior, seasonality, reviews, returns, prices, and seller counts. Amazon's Product Opportunity Explorer specifically brings several of these signals together to help sellers identify high-potential opportunities and lower research risk. (Sell on Amazon) For sellers, the important change is that raw data becomes useful only after it is organized around business questions. A dashboard can identify products with improving demand but limited competition, products experiencing frequent stockouts, or categories where competitors are repeatedly discounting. These insights can inform sourcing, pricing, inventory planning, advertising, and product launches. A well-designed analytics layer also makes it easier for teams to compare thousands of ASINs without manually reviewing individual listings.
Amazon analytics helps businesses connect individual product observations with broader marketplace patterns. Sellers can analyze categories, brands, ASINs, price bands, reviews, seller counts, availability, and ranking changes together.
The objective is to create a decision framework that answers five practical questions:
| Business Decision | Supporting Data |
|---|---|
| Product selection | Demand + competition |
| Pricing | Competitor price history |
| Inventory | Availability + demand |
| Promotions | Price + rank movement |
| Product launch | Category + trend data |
| Competitive strategy | Seller + product data |
Amazon Product Data Scraping Insights for Sellers becomes especially valuable when these datasets are maintained historically rather than collected only once.
Marketplace analytics has developed from basic catalog monitoring into a broader intelligence function. In 2020, sellers were primarily concerned with product visibility, availability, and immediate customer demand. During 2021 and 2022, changing consumer behavior increased the need for category and product-level monitoring. Between 2023 and 2025, businesses increasingly integrated competitive pricing, customer reviews, ranking signals, and seller information into decision-making workflows. In 2026, Amazon's seller ecosystem explicitly supports more advanced product research through Best Sellers, Movers & Shakers, Hot New Releases, and Product Opportunity Explorer. (Sell on Amazon) At the broader India market level, e-commerce is also expanding rapidly, with IBEF reporting that India's e-commerce market was valued at approximately US$125 billion in 2024 and is projected to reach about US$345 billion by 2030. (India Brand Equity Foundation) For sellers, this expanding market increases both opportunity and competitive complexity. A structured analytics system helps businesses convert marketplace changes into measurable signals. Historical datasets can then support category expansion, competitor benchmarking, product discovery, promotional planning, and inventory decisions.
Actowiz Metrics can help sellers build structured marketplace datasets that bring product, pricing, availability, ranking, review, and competitive information into one analytics-ready environment.
With Digital shelf analytics, businesses can monitor how products appear and perform across the digital marketplace. This can support:
Amazon Product Data Scraping Insights for Sellers can be incorporated into recurring data pipelines so teams receive structured observations rather than relying on manual product checks.
A Practical Data Workflow
1. Define the product universe: Identify categories, ASINs, brands, keywords, and competitors.
2. Collect marketplace data: Capture product attributes, prices, rankings, ratings, reviews, availability, and seller information.
3. Normalize the dataset: Standardize product identifiers, categories, prices, and timestamps.
4. Validate the information: Remove duplicates, identify missing values, and verify data consistency.
5. Build historical datasets: Store recurring observations to identify trends rather than relying on snapshots.
6. Create dashboards: Convert raw records into product, category, competitor, and pricing insights.
7. Trigger business actions: Use measurable signals to support assortment, pricing, promotion, and inventory decisions.
This workflow is particularly useful for sellers managing large catalogs where manual monitoring becomes difficult to scale.
The most effective approach to identifying high-demand Amazon products is continuous monitoring rather than relying on a one-time list. Amazon's 2026 resources show that Best Sellers, Movers & Shakers, product rankings, pricing, reviews, seasonality, demand, and competition can all contribute to product opportunity analysis. (Sell on Amazon)
For sellers, Price & promotion intelligence can complement product, availability, ranking, and review data to create a broader view of marketplace conditions.
The 15 product types highlighted in this article—from surge protectors and shoes to acne patches, tumblers, whey protein, baby wipes, chargers, gaming headsets, and home-improvement products—should be treated as market signals rather than permanent rankings. Amazon itself notes that top-selling products can change over time. (Sell on Amazon)
Want to identify emerging products, monitor competitors, track pricing, and build historical Amazon marketplace intelligence? Connect with Actowiz Metrics to create scalable product data pipelines and turn marketplace data into actionable seller insights!
Expert blogs, research reports and infographics — practical, data-driven reading across e-commerce and quick-commerce.
Most fields are optional — the more you share, the better your sample.

.webp "infographics")
.webp "infographics")