BLOG




















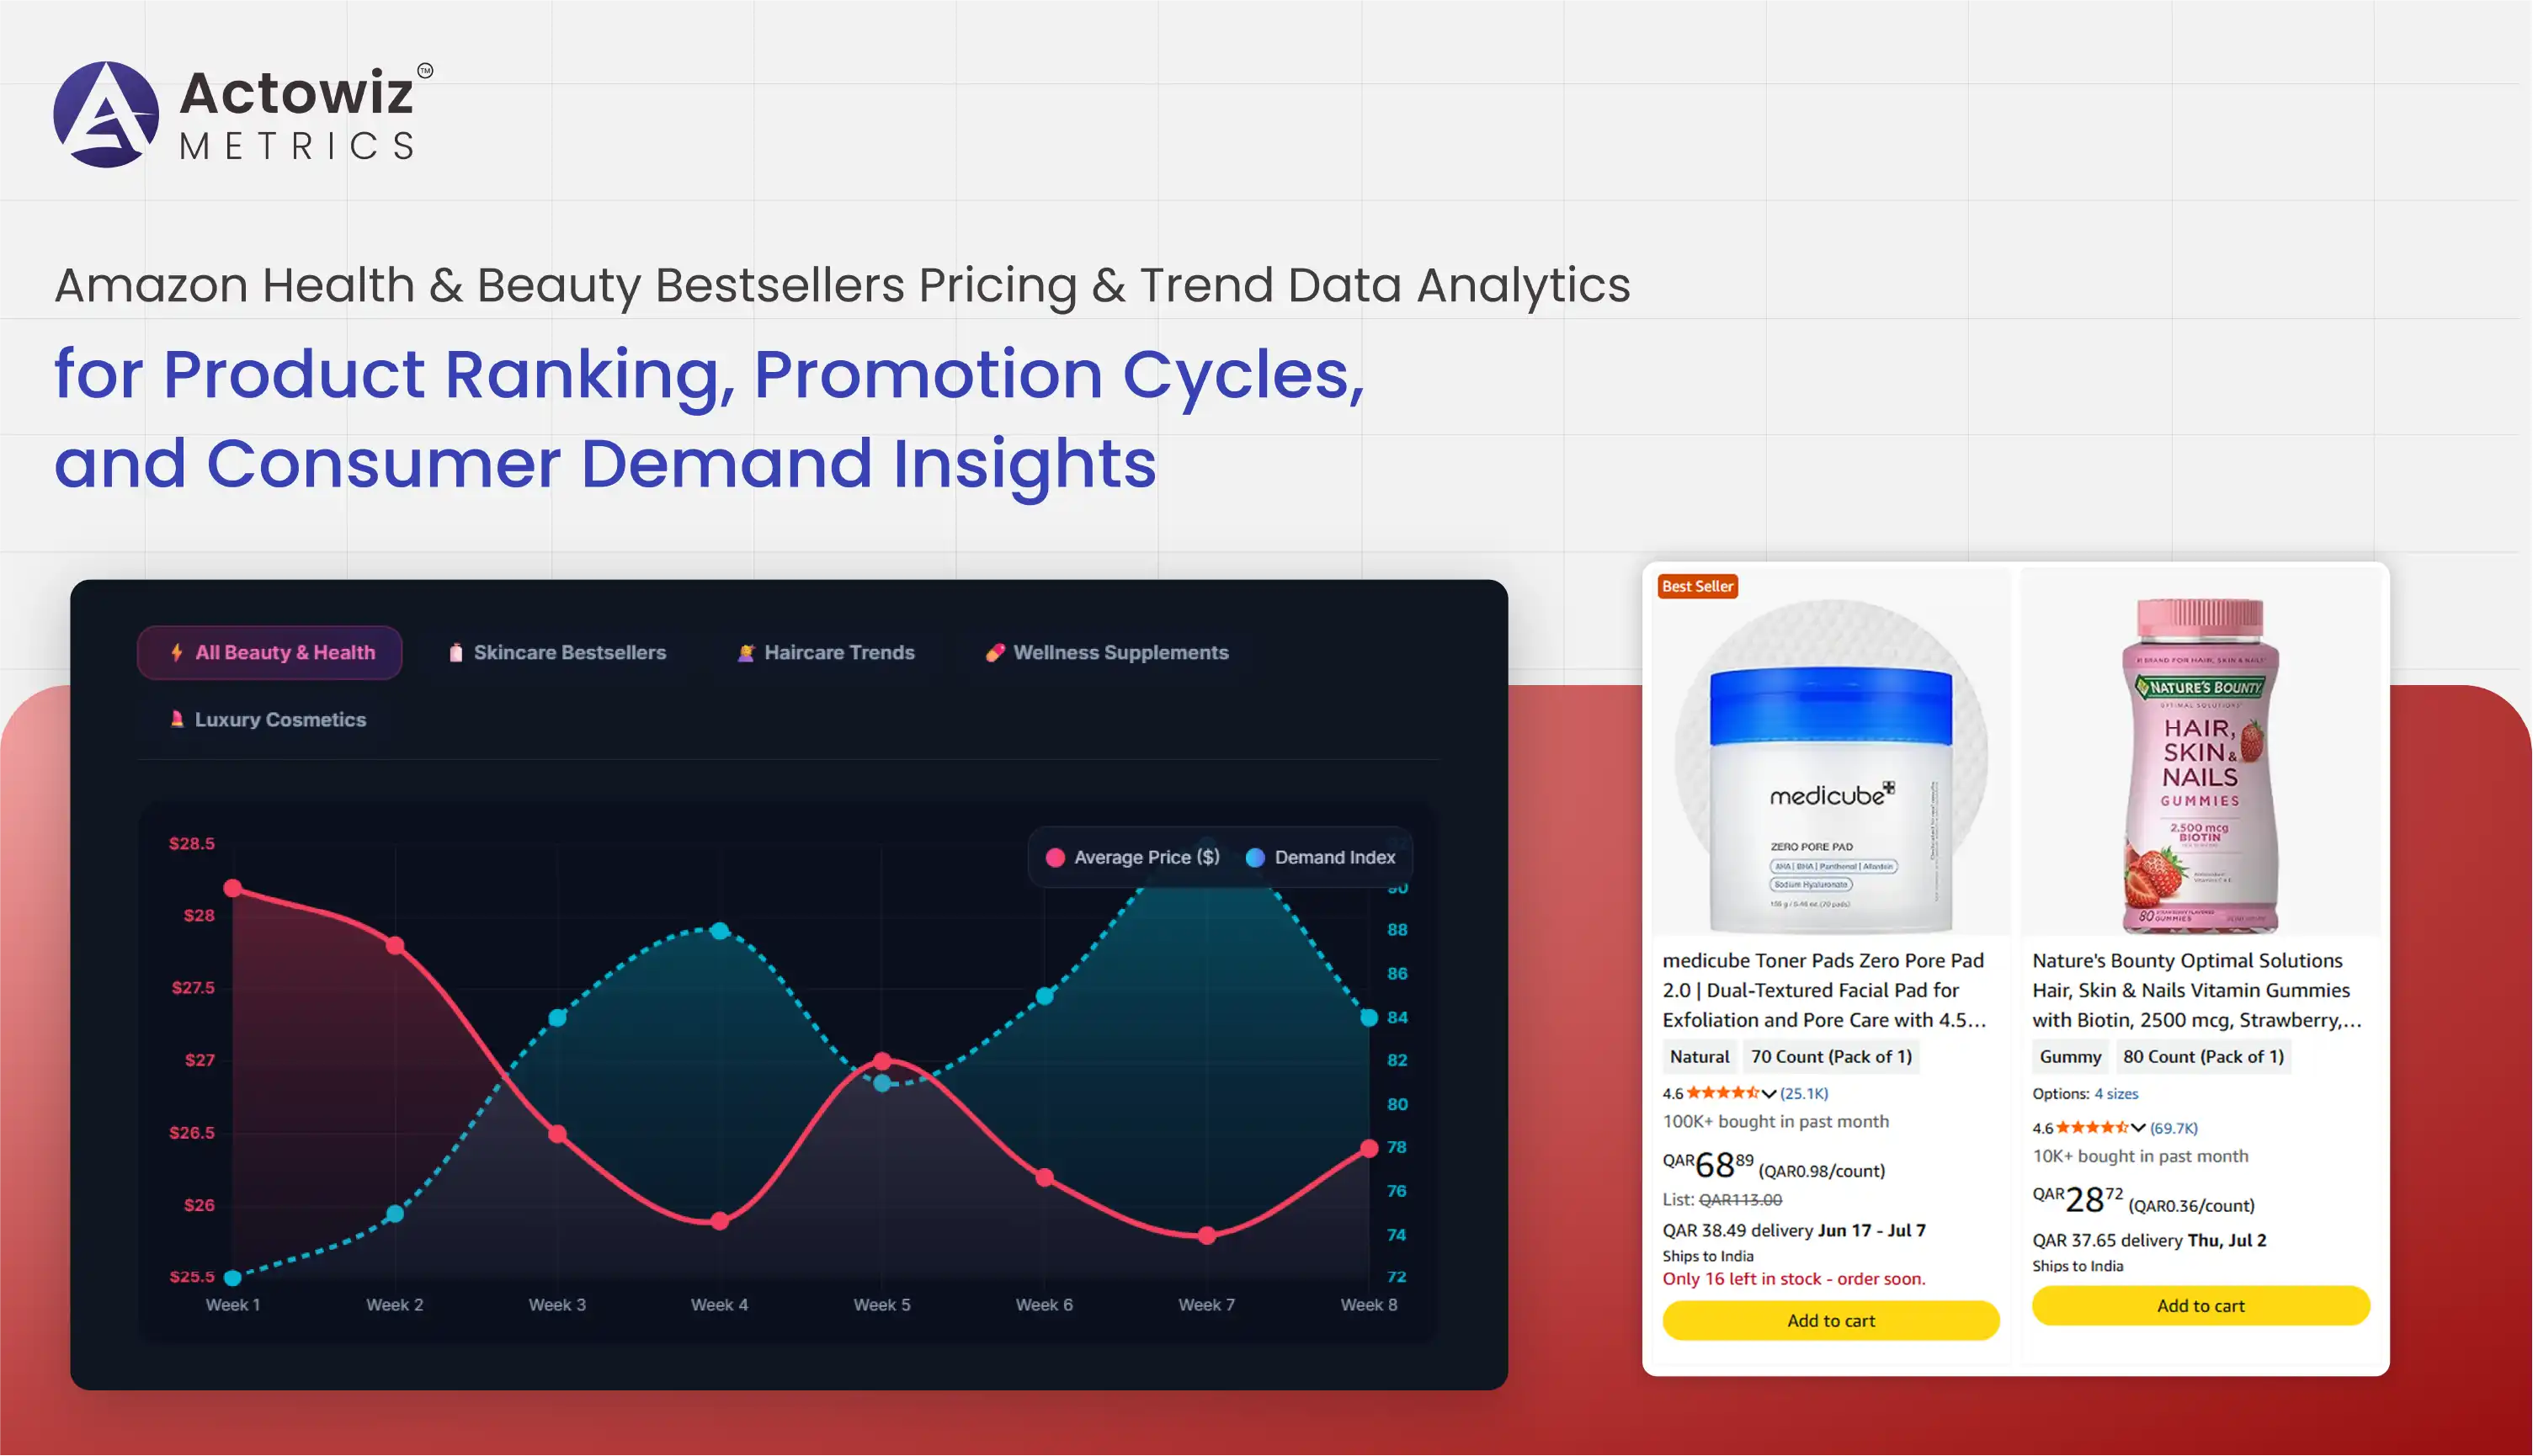
The Amazon Health & Beauty ecosystem has evolved into one of the most competitive and data-intensive retail environments in global eCommerce. With thousands of brands competing across skincare, cosmetics, personal care, grooming, and wellness segments, marketplace success is no longer driven by product quality alone. Instead, it is determined by pricing efficiency, promotional timing, search visibility, inventory stability, and consumer sentiment signals.
In this environment, Amazon Health & Beauty Bestsellers Pricing & Trend Data Analytics plays a central role in helping brands understand how products move across ranking positions, how pricing fluctuations impact conversion behavior, and how consumer demand shifts across seasonal cycles. Between 2020 and 2026, Amazon Health & Beauty grew significantly due to rising wellness awareness, increased skincare adoption, and accelerated digital purchasing behavior in post-pandemic consumer markets.
Simultaneously, Amazon Bestselling Beauty Brands Analytics has become essential for decoding competitive positioning, identifying SKU-level performance gaps, and evaluating category-level dominance. The increasing use of real-time retail intelligence platforms has enabled brands to move from static reporting to continuous marketplace monitoring.
This report presents a deep analytical breakdown of Amazon Health & Beauty performance using structured marketplace intelligence, statistical trend modeling, and category-level benchmarking across pricing, ranking, reviews, and promotional cycles.
The Health & Beauty category on Amazon demonstrates one of the fastest-growing digital shelf expansions across all consumer segments. Product listings are highly fragmented, with thousands of SKUs competing across similar functional use cases such as hydration, acne treatment, anti-aging, hair repair, and personal hygiene.
To manage this complexity, brands increasingly rely on Health & Beauty Brands Data Scraping on Amazon to extract structured SKU-level intelligence, enabling visibility tracking and performance benchmarking across multiple subcategories.
Between 2020 and 2026, Amazon Health & Beauty experienced exponential SKU growth driven by private labels, D2C brands, and global cosmetic manufacturers expanding aggressively into online retail channels.
| Year | Total SKUs | Active Brands | Bestseller SKUs | Digital Shelf Coverage Index |
|---|---|---|---|---|
| 2020 | 210,000+ | 5,800 | 8,500 | 42% |
| 2021 | 245,000+ | 6,300 | 9,300 | 46% |
| 2022 | 280,000+ | 7,100 | 10,800 | 51% |
| 2023 | 320,000+ | 7,900 | 12,400 | 56% |
| 2024 | 360,000+ | 8,700 | 14,200 | 61% |
| 2025 | 400,000+ | 9,500 | 15,600 | 66% |
| 2026 | 440,000+ | 10,200 | 17,300 | 71% |
Key Insights:
This reinforces the importance of structured Scrape Amazon Beauty Product Data pipelines for extracting consistent product-level insights across rapidly expanding listings.
Product-level intelligence is a key driver of performance in Health & Beauty categories. Consumers rely heavily on ingredient transparency, dermatological claims, product usage clarity, and visual presentation before making purchasing decisions.
Using Scrape Amazon Beauty Product Data, brands extract detailed structured attributes such as ingredient lists, product claims, packaging variations, pricing tiers, and customer sentiment patterns.
| Metric | 2020 | 2023 | 2026 |
|---|---|---|---|
| Avg Product Price (USD) | 12.6 | 16.2 | 19.4 |
| Avg SKU Rating | 4.0 | 4.2 | 4.4 |
| Avg Reviews per SKU | 3,100 | 6,000 | 9,200 |
| Conversion Rate | 3.6% | 5.3% | 6.7% |
| CTR (Click-Through Rate) | 8.4% | 11.9% | 14.6% |
Key Insights:
SKU-level intelligence also directly supports Amazon Health & Beauty Ratings and Reviews Analysis, helping brands connect product features with customer sentiment outcomes.
Competition in the Health & Beauty category is highly fragmented, with premium global brands, mid-tier regional players, and rapidly growing private-label products competing for visibility.
To evaluate competition dynamics, companies rely on Beauty Category Brand Competition Analysis on amazon, which enables benchmarking across pricing tiers, promotional activity, and ranking distribution.
| Brand Tier | Market Share | Avg Discount Rate | Visibility Share | Conversion Efficiency |
|---|---|---|---|---|
| Premium Brands | 36% | 10–14% | 42% | High |
| Mid-Tier Brands | 44% | 16–22% | 41% | Medium-High |
| Private Labels | 20% | 24–32% | 17% | Fastest Growth |
Key Insights:
Competitive intelligence frameworks also support Amazon Bestselling Health Brands Analytics, which tracks SKU-level dominance and category leadership patterns.
Pricing is one of the strongest ranking and conversion drivers in Amazon Health & Beauty. The category is highly sensitive to discounts, bundles, flash sales, and seasonal promotions.
Brands increasingly adopt Real-Time Health Products Price Monitoring to track competitor pricing changes and optimize promotional timing dynamically.
| Year | Avg Discount % | Price Volatility Index | Promo Conversion Lift | Flash Sale Contribution |
|---|---|---|---|---|
| 2020 | 14% | Low | 19% | 22% |
| 2021 | 16% | Medium | 24% | 26% |
| 2022 | 19% | Medium | 29% | 31% |
| 2023 | 22% | High | 34% | 37% |
| 2024 | 25% | High | 39% | 41% |
| 2025 | 28% | Very High | 44% | 46% |
| 2026 | 31% | Very High | 48% | 52% |
Key Insights:
Pricing intelligence strongly depends on Amazon Health & Beauty Bestsellers Pricing & Trend Data Analytics, which helps track elasticity across subcategories.
Customer sentiment is one of the most critical ranking signals in Health & Beauty. Ratings influence trust, conversion rates, and search placement across Amazon's algorithm.
Brands use Amazon Health & Beauty Ratings and Reviews Analysis to monitor sentiment trends and identify product improvement opportunities.
| Year | Avg Rating | Avg Reviews per SKU | Conversion Impact | Negative Review Impact |
|---|---|---|---|---|
| 2020 | 4.0 | 2,800 | 21% | -18% |
| 2021 | 4.1 | 3,900 | 25% | -19% |
| 2022 | 4.2 | 5,300 | 30% | -20% |
| 2023 | 4.2 | 6,700 | 34% | -22% |
| 2024 | 4.3 | 7,600 | 38% | -23% |
| 2025 | 4.3 | 8,500 | 42% | -24% |
| 2026 | 4.4 | 9,400 | 46% | -25% |
Key Insights:
Amazon Health & Beauty bestsellers demonstrate strong concentration behavior where a small percentage of SKUs dominate visibility and revenue.
| Segment | SKU Share | Revenue Share | Visibility Share |
|---|---|---|---|
| Top 10% SKUs | 60% | 68% | 72% |
| Mid SKUs | 30% | 25% | 22% |
| Long-tail SKUs | 10% | 7% | 6% |
Key Insights:
This structure aligns with Amazon Bestselling Health Brands Analytics, which tracks SKU dominance and brand performance concentration.
Search visibility plays a central role in determining marketplace success. Brands increasingly rely on keyword intelligence and ranking analytics to optimize discoverability.
| Year | CTR Improvement | Organic Ranking Strength | Mobile Search Share |
|---|---|---|---|
| 2020 | 12% | Low | 62% |
| 2021 | 17% | Medium | 65% |
| 2022 | 23% | Medium | 68% |
| 2023 | 29% | High | 71% |
| 2024 | 34% | High | 74% |
| 2025 | 39% | Very High | 77% |
| 2026 | 44% | Very High | 80% |
Key Insights:
Search intelligence is closely tied to Amazon Health & Beauty Bestsellers Pricing & Trend Data Analytics, influencing visibility and conversion simultaneously.
Actowiz Metrics delivers advanced retail intelligence solutions designed to help global brands optimize pricing, visibility, and conversion performance across Amazon's Health & Beauty ecosystem.
Our solutions powered by Ecommerce Brands Analytics enable organizations to track SKU performance, pricing volatility, and category-level demand patterns with high accuracy.
We also specialize in Amazon Health & Beauty Bestsellers Pricing & Trend Data Analytics, enabling real-time decision-making through structured marketplace intelligence and predictive analytics.
The Amazon Health & Beauty ecosystem is driven by rapid SKU expansion, aggressive pricing cycles, and highly competitive ranking dynamics. Success in this category depends on the ability to interpret pricing elasticity, sentiment signals, search visibility, and inventory stability in real time.
Through MAP Monitoring, Amazon Health & Beauty Bestsellers Pricing & Trend Data Analytics, brands can identify pricing inefficiencies, optimize promotional cycles, and improve overall marketplace performance.
As competition intensifies, data-driven intelligence will remain the foundation of sustained growth in the Health & Beauty eCommerce landscape.
To unlock advanced marketplace analytics and real-time retail intelligence, connect with Actowiz Metrics for enterprise-grade data solutions tailored to your brand growth!
Expert blogs, research reports and infographics — practical, data-driven reading across e-commerce and quick-commerce.
Most fields are optional — the more you share, the better your sample.

.webp "infographics")
.webp "infographics")