BLOG




















Customer reviews have evolved from simple post-purchase feedback into a large-scale source of market intelligence. Retailers now receive thousands or millions of ratings, written comments, product complaints, delivery observations, and service experiences across marketplaces, retailer websites, social platforms, and quick-commerce channels. The challenge is no longer collecting feedback — it is identifying patterns quickly enough to act on them.
AI-Powered Customer Review Analysis Across Retailers helps businesses convert this unstructured feedback into structured intelligence around sentiment, product attributes, customer expectations, recurring complaints, emerging trends, and competitor performance. Instead of manually reading reviews, AI models can classify large volumes of text, identify topics, detect sentiment, and surface changes over time.
The commercial relevance is clear. PowerReviews reported that 99.5% of shoppers in its 2023 U.S. research researched purchases online at least sometimes, while 93% said ratings and reviews influence whether they purchase a product. The same study found that 45% of shoppers would not purchase a product if ratings and reviews were unavailable. (PowerReviews)
The importance of feedback has also grown across the review ecosystem. BrightLocal found that 97% of consumers read reviews for local businesses in its 2026 survey, while 41% said they always read reviews when browsing for businesses. (BrightLocal)
For retailers, the opportunity is to move beyond knowing whether customers are happy or unhappy. AI can help answer why customers feel that way, which product attributes drive the sentiment, where competitors perform differently, and which problems require immediate attention.
Retail review data is inherently messy. A single review can contain comments about product quality, packaging, delivery, customer support, pricing, sizing, availability, and value. A five-star review may still mention a serious product problem, while a two-star review may praise the product but criticize late delivery.
This makes simple average ratings insufficient for decision-making.
Marketplace and Q-Commerce Review analysis creates a broader intelligence layer by combining review text with product, category, seller, marketplace, location, rating, timestamp, and SKU-level information. For example, an FMCG brand could discover that reviews are generally positive for taste but increasingly negative for packaging leakage. A fashion retailer might identify repeated complaints about sizing despite an overall rating above four stars.
The analytical workflow typically includes:
The result is a shift from "What rating did customers give us?" to "What specific customer experiences are changing, where are they changing, and what business action should follow?"
Traditional review reporting often relies on average star ratings. While useful, an average rating can hide important details. A product with a 4.2-star average might have thousands of positive reviews but a rapidly increasing number of complaints about delivery or product durability.
AI-based sentiment classification can categorize reviews as positive, neutral, or negative and can be expanded into more granular labels such as highly positive, mixed, or highly negative.
For retailers, sentiment should ideally be analyzed at multiple levels:
| Analytical Level | Example Insight |
|---|---|
| Overall sentiment | 78% positive reviews |
| Product sentiment | Quality sentiment declining |
| Service sentiment | Delivery complaints increasing |
| Seller sentiment | Seller communication receiving negative feedback |
| Category sentiment | Customer satisfaction falling across a category |
| Time-based sentiment | Negative mentions rising after a product change |
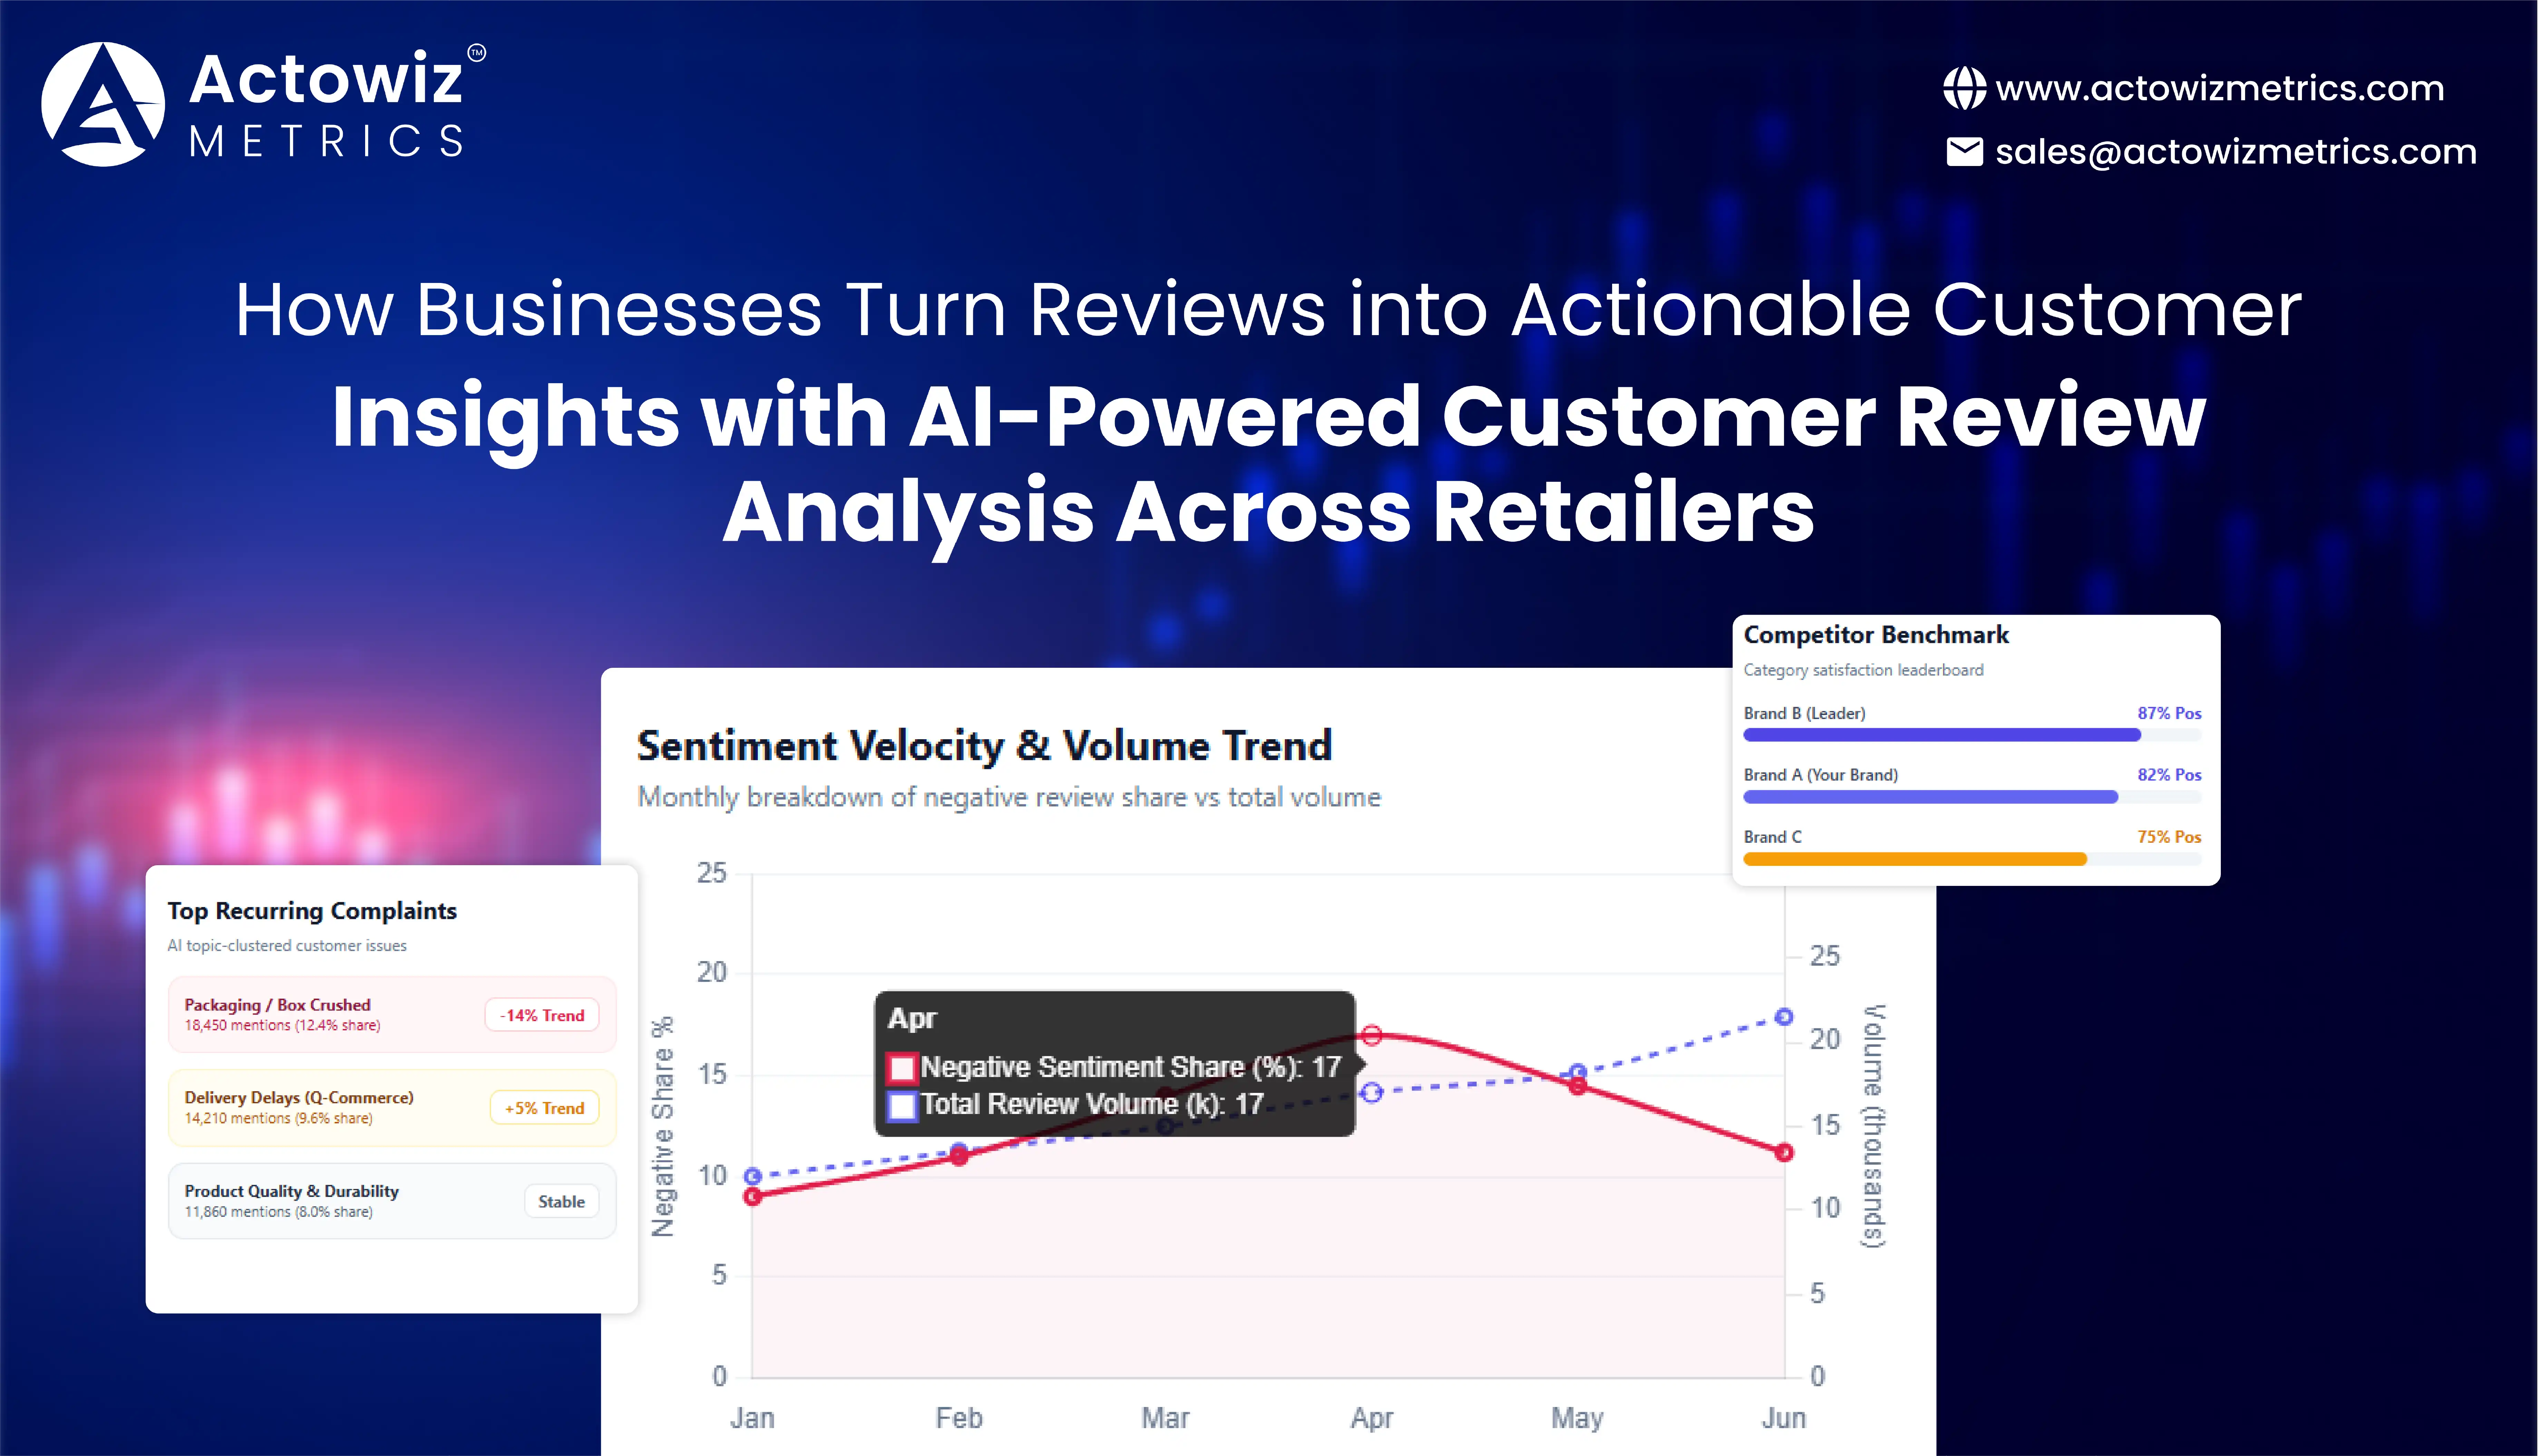
A particularly useful application is sentiment velocity. Instead of looking only at the percentage of negative reviews, retailers can track how quickly negative mentions are increasing.
For example, assume a beauty brand records:
| Month | Reviews | Negative Reviews | Negative Share |
|---|---|---|---|
| January | 12,000 | 1,080 | 9.0% |
| February | 13,500 | 1,485 | 11.0% |
| March | 15,000 | 2,100 | 14.0% |
| April | 17,000 | 2,890 | 17.0% |
The important insight is not simply that April contains 2,890 negative reviews. Negative sentiment nearly doubled as a proportion of reviews from January to April. That pattern could trigger an investigation into a formulation change, supplier issue, packaging problem, or fulfillment disruption.
Between 2020 and 2026, review intelligence has moved from basic reputation tracking toward automated interpretation. In 2020, BrightLocal reported that 87% of consumers read online reviews for local businesses, while 80% said they believed they had encountered a fake review during the previous year. (BrightLocal) By 2021, PowerReviews found that more than 99.9% of consumers read reviews when shopping online at least sometimes and 98% considered reviews an essential purchase resource. (PowerReviews) By 2023, PowerReviews reported that 93% of consumers said ratings and reviews affected whether they purchased a product. (PowerReviews) In 2025, BrightLocal documented growing consumer use of AI-generated review summaries, while its 2026 research found that 82% of consumers read AI review summaries, with many using summaries as a starting point before examining ratings or individual reviews. (BrightLocal) This progression illustrates why retailers increasingly need machine-assisted interpretation rather than simple review counting.
A major weakness of conventional sentiment analysis is that it treats an entire review as one sentiment unit.
Consider this review:
"The headphones sound excellent and the battery lasts all day, but the ear cushions are uncomfortable and the charging case feels cheap."
Overall, the review is mixed. However, it contains at least four separate product signals:
Aspect-based analysis separates these components.
For a consumer electronics retailer, the resulting dataset could look like this:
| Product Aspect | Positive | Negative | Neutral/Mixed |
|---|---|---|---|
| Sound quality | 82% | 11% | 7% |
| Battery life | 79% | 13% | 8% |
| Comfort | 51% | 39% | 10% |
| Build quality | 55% | 34% | 11% |
| Packaging | 68% | 24% | 8% |
The product's 4.3-star average rating might initially look healthy. Aspect analysis, however, reveals that comfort and build quality are substantially weaker than other attributes.
This can directly support product development. A brand could prioritize cushion redesign, material improvements, or packaging changes rather than making broad and expensive product modifications.
Aspect-level analysis is especially valuable in:
The 2020-2026 period demonstrates why individual review components matter increasingly. In 2020, BrightLocal reported that star rating was the most influential review factor among surveyed consumers, followed by review legitimacy, recency, sentiment, and quantity. (BrightLocal) PowerReviews' 2021 research found that 52% of consumers did not trust star ratings without accompanying review content, reinforcing the importance of understanding written feedback rather than relying on scores alone. (PowerReviews) Its 2023 study similarly found that 56% of shoppers did not trust star ratings alone as much as ratings accompanied by written reviews. (PowerReviews) By 2025-2026, AI-generated summaries were increasingly helping consumers process review content without reading every comment. BrightLocal's 2026 findings show that 82% of consumers read AI-generated review summaries. (BrightLocal) For businesses, this increases the value of accurately identifying the underlying aspects and themes that feed those summaries.
AI analysis is only as reliable as the underlying dataset.
Retailers often have review information distributed across their own websites, marketplaces, retailer platforms, regional stores, and Q-commerce applications. Each source can use different fields, formats, rating scales, pagination structures, review dates, product identifiers, and customer terminology.
A scalable review-data pipeline can standardize information into a common structure:
| Field | Example |
|---|---|
| Product ID | SKU-45891 |
| Product Name | Wireless Earbuds X |
| Brand | Brand A |
| Category | Electronics |
| Rating | 4.2 |
| Review Text | Battery lasts longer than expected |
| Sentiment | Positive |
| Aspect | Battery |
| Review Date | 2026-08-21 |
| Marketplace | Retailer A |
| Seller | Seller 24 |
| Verified Status | Verified |
| Location | United States |
This structure enables businesses to combine raw review text with product and marketplace attributes.
A useful pipeline may include:
Collection → Validation → Deduplication → Normalization → Enrichment → AI Classification → Aggregation → Dashboard → Alerts
For example, if the same SKU is sold across three marketplaces, the system can consolidate reviews by product identifier while retaining marketplace-specific information.
That makes it possible to determine whether a product problem is universal or isolated to one channel.
Review-data requirements became increasingly sophisticated during 2020-2026. BrightLocal's 2020 survey showed that 72% of consumers had written a review for a local business, while 96% of review readers also read business responses. (BrightLocal) PowerReviews reported in 2021 that 79% of consumers specifically sought websites with product reviews, compared with 63% in 2018. (PowerReviews) Its 2023 research found that 77% of shoppers specifically sought websites with ratings and reviews, while 99.75% read reviews at least sometimes. (PowerReviews) Review recency also matters: PowerReviews found that 97% of consumers consider review recency at least somewhat important, and 62% would not purchase a product if the only reviews available were a year or older. (PowerReviews) These findings make recurring, structured data collection more valuable than occasional manual exports.
Thousands of reviews can contain hundreds of ways to describe the same issue.
For example:
Humans may recognize these as related. Automated topic clustering can group them under a common theme such as Packaging Damage.
A retailer can then quantify the issue.
| Topic | Review Mentions | Share of Reviews | Sentiment |
|---|---|---|---|
| Packaging | 18,450 | 12.4% | Negative |
| Delivery delays | 14,210 | 9.6% | Negative |
| Product quality | 11,860 | 8.0% | Mixed |
| Value for money | 9,430 | 6.3% | Mixed |
| Ease of use | 8,920 | 6.0% | Positive |
| Product size | 6,710 | 4.5% | Mixed |
Topic clustering also helps identify emerging problems.
Suppose packaging complaints represent 5% of reviews for several months and suddenly rise to 12%. The change may correspond to a new fulfillment partner, packaging supplier, warehouse process, or shipping route.
The same method can uncover positive themes. A sudden increase in comments about "easy installation" could provide useful marketing content or product positioning.
From 2020 onward, review datasets have become increasingly useful as continuous customer-feedback streams rather than static reputation snapshots. BrightLocal's 2020 research found that 73% of consumers considered reviews from the last month important to their decisions, and 86% considered reviews from the last three months. (BrightLocal) PowerReviews later found that 97% of consumers considered review recency at least somewhat important and 44% ideally wanted reviews from within the past month. (PowerReviews) By 2023, 74% of consumers in PowerReviews' survey said ratings and reviews were a key way they learned about products they had not purchased before. (PowerReviews) The 2025-2026 shift toward AI-generated summaries adds another layer: review clusters and recurring themes can now be transformed into concise summaries for consumers and internal teams. BrightLocal reported in 2025 that 48% of consumers would read an AI review summary and then examine a variety of positive and negative reviews. (BrightLocal)
A brand can receive substantially different customer feedback across sales channels.
For example, a product may have:
| Channel | Reviews | Avg. Rating | Negative Sentiment |
|---|---|---|---|
| Marketplace A | 25,000 | 4.4 | 8.2% |
| Marketplace B | 13,500 | 4.1 | 13.6% |
| Retailer Website | 8,700 | 4.5 | 6.9% |
| Q-Commerce Platform | 5,400 | 3.8 | 18.7% |
A simple average across all channels could hide the Q-commerce problem.
Channel-level monitoring can reveal whether negative feedback originates from:
This distinction is particularly important in quick commerce because customer expectations are strongly linked to fulfillment speed and product availability.
For instance, a grocery brand may receive positive feedback about freshness on traditional marketplaces but negative reviews on a Q-commerce channel because customers receive damaged packaging or substitutions.
Without channel segmentation, the brand could incorrectly assume that the product itself has deteriorated.
The review environment expanded from individual websites toward a multi-platform ecosystem during 2020-2026. BrightLocal's 2020 research found that 72% of consumers believed it was important for businesses to appear on multiple review sites. (BrightLocal) In its 2023 research, BrightLocal reported that 87% of consumers used Google to evaluate local businesses in 2022, while 46% used Facebook, demonstrating changes in platform behavior. (BrightLocal) PowerReviews' 2023 study showed that consumers commonly read reviews across Amazon, retail websites, search engines, and brand websites, rather than relying on one source. (PowerReviews) BrightLocal's 2026 survey found that the average consumer uses six different review sites when choosing businesses and that Google, Facebook, and AI tools such as ChatGPT are among the commonly used sources. (BrightLocal) For retailers, this reinforces the value of a unified monitoring framework across marketplaces, retailer websites, and emerging commerce channels.
Customer reviews can provide information about competitors that is difficult to obtain through traditional market research.
A competitor review benchmark can compare:
Consider a category with three competing products:
| Metric | Brand A | Brand B | Brand C |
|---|---|---|---|
| Average Rating | 4.3 | 4.5 | 4.1 |
| Review Volume | 42,000 | 28,500 | 51,000 |
| Quality Sentiment | 82% positive | 87% positive | 75% positive |
| Value Sentiment | 69% positive | 73% positive | 61% positive |
| Packaging Sentiment | 76% positive | 84% positive | 64% positive |
The value is not simply identifying which brand has a higher rating. Instead, brands can understand why customers praise or criticize competitors.
If competitor customers repeatedly praise battery life, faster delivery, packaging, or durability, these themes can become inputs into product development and positioning discussions.
Competitor review analysis can also identify whitespace.
For example, if customers across a category repeatedly complain about:
"Good product, but difficult to assemble."
a brand developing an easier installation process may have an opportunity to differentiate its product experience.
Review benchmarking became more important as consumers increasingly used ratings and written feedback during product discovery. PowerReviews found in 2021 that ratings and reviews had become a leading purchase consideration, while 79% of consumers specifically sought websites containing product reviews. (PowerReviews) In its 2023 study of more than 8,000 U.S. consumers, PowerReviews found that 90% considered customer ratings and reviews when making purchase decisions and 93% said this content affected whether they purchased a product. (PowerReviews) Review volume also influences perception: PowerReviews found that 64% of consumers were more likely to purchase a product with more than 1,000 reviews than one with 100 reviews when average ratings were the same. (PowerReviews) In 2026, BrightLocal reported that 85% of consumers were more likely to use a business after reading positive reviews, while 77% said negative reviews deterred them. (BrightLocal) These patterns make competitor review datasets useful for understanding not just ratings but the customer experiences behind them.
Actowiz Metrics can help retailers build a structured review intelligence pipeline that converts large volumes of customer feedback into usable business datasets.
The process can combine review collection, data cleaning, sentiment classification, aspect extraction, topic clustering, competitor comparison, and historical trend analysis.
A typical output can include:
| Data Layer | Business Use |
|---|---|
| Product reviews | Understand product experience |
| Ratings | Track customer perception |
| Sentiment | Measure positive/negative trends |
| Product aspects | Identify strengths and weaknesses |
| Topics | Discover recurring customer concerns |
| Marketplace | Compare channel performance |
| Competitors | Benchmark customer experience |
| Review dates | Track emerging trends |
| SKU/product ID | Connect feedback to products |
| Location | Identify regional patterns |
The resulting dataset can be delivered in analytics-ready formats and connected with BI environments for dashboards and recurring monitoring.
For enterprise retailers, the key benefit is scalability. Instead of manually reviewing hundreds of comments, teams can analyze thousands or millions of records through structured workflows.
AI-Powered Customer Review Analysis Across Retailers can therefore become part of a wider customer intelligence framework, connecting customer voice data with pricing, product, availability, seller, and marketplace intelligence.
The approach can support several departments simultaneously:
Product teams: identify recurring product defects and feature requests.
Marketing teams: discover positive product attributes and customer language.
Customer experience teams: detect recurring service problems.
Category managers: compare customer expectations across products.
Competitive intelligence teams: monitor competitor strengths and weaknesses.
Executives: track customer sentiment and emerging risks through dashboards.
The emphasis should be on turning raw feedback into measurable signals that can be monitored continuously rather than analyzed only during periodic research projects.
Customer reviews represent a continuously expanding source of consumer intelligence. The challenge for modern retailers is not simply collecting more reviews but extracting structured meaning from them.
Research demonstrates how deeply reviews are embedded in consumer decision-making. PowerReviews found that 98% of consumers considered reviews an essential purchase resource in 2021, while its 2023 research found that 93% said ratings and reviews affected whether they purchased a product. (PowerReviews) At the same time, review recency, volume, written content, sentiment, and platform coverage all influence how consumers interpret feedback. (PowerReviews)
For businesses, Consumer Sentiment Analysis provides the foundation for understanding what customers are saying, while aspect-level and topic-level analysis explains why they are saying it.
AI-Powered Customer Review Analysis Across Retailers can help transform fragmented customer comments into structured intelligence covering products, categories, marketplaces, competitors, and emerging customer expectations.
Turn your customer review data into actionable retail intelligence with Actowiz Metrics—connect review data, AI analysis, and business insights at scale!
Expert blogs, research reports and infographics — practical, data-driven reading across e-commerce and quick-commerce.
Most fields are optional — the more you share, the better your sample.
.webp "infographics")
.webp "infographics")