BLOG


The global beauty and personal care industry has experienced significant growth over the past decade, driven by evolving consumer preferences, digital retail expansion, and increased demand for skincare and cosmetic products. As one of the largest retailers in the world, Walmart plays a critical role in shaping beauty product trends through its online and in-store bestseller categories. Businesses looking to understand product performance and market demand increasingly rely on Walmart Bestsellers Beauty Product Data Analytics to gain actionable insights into consumer purchasing patterns.
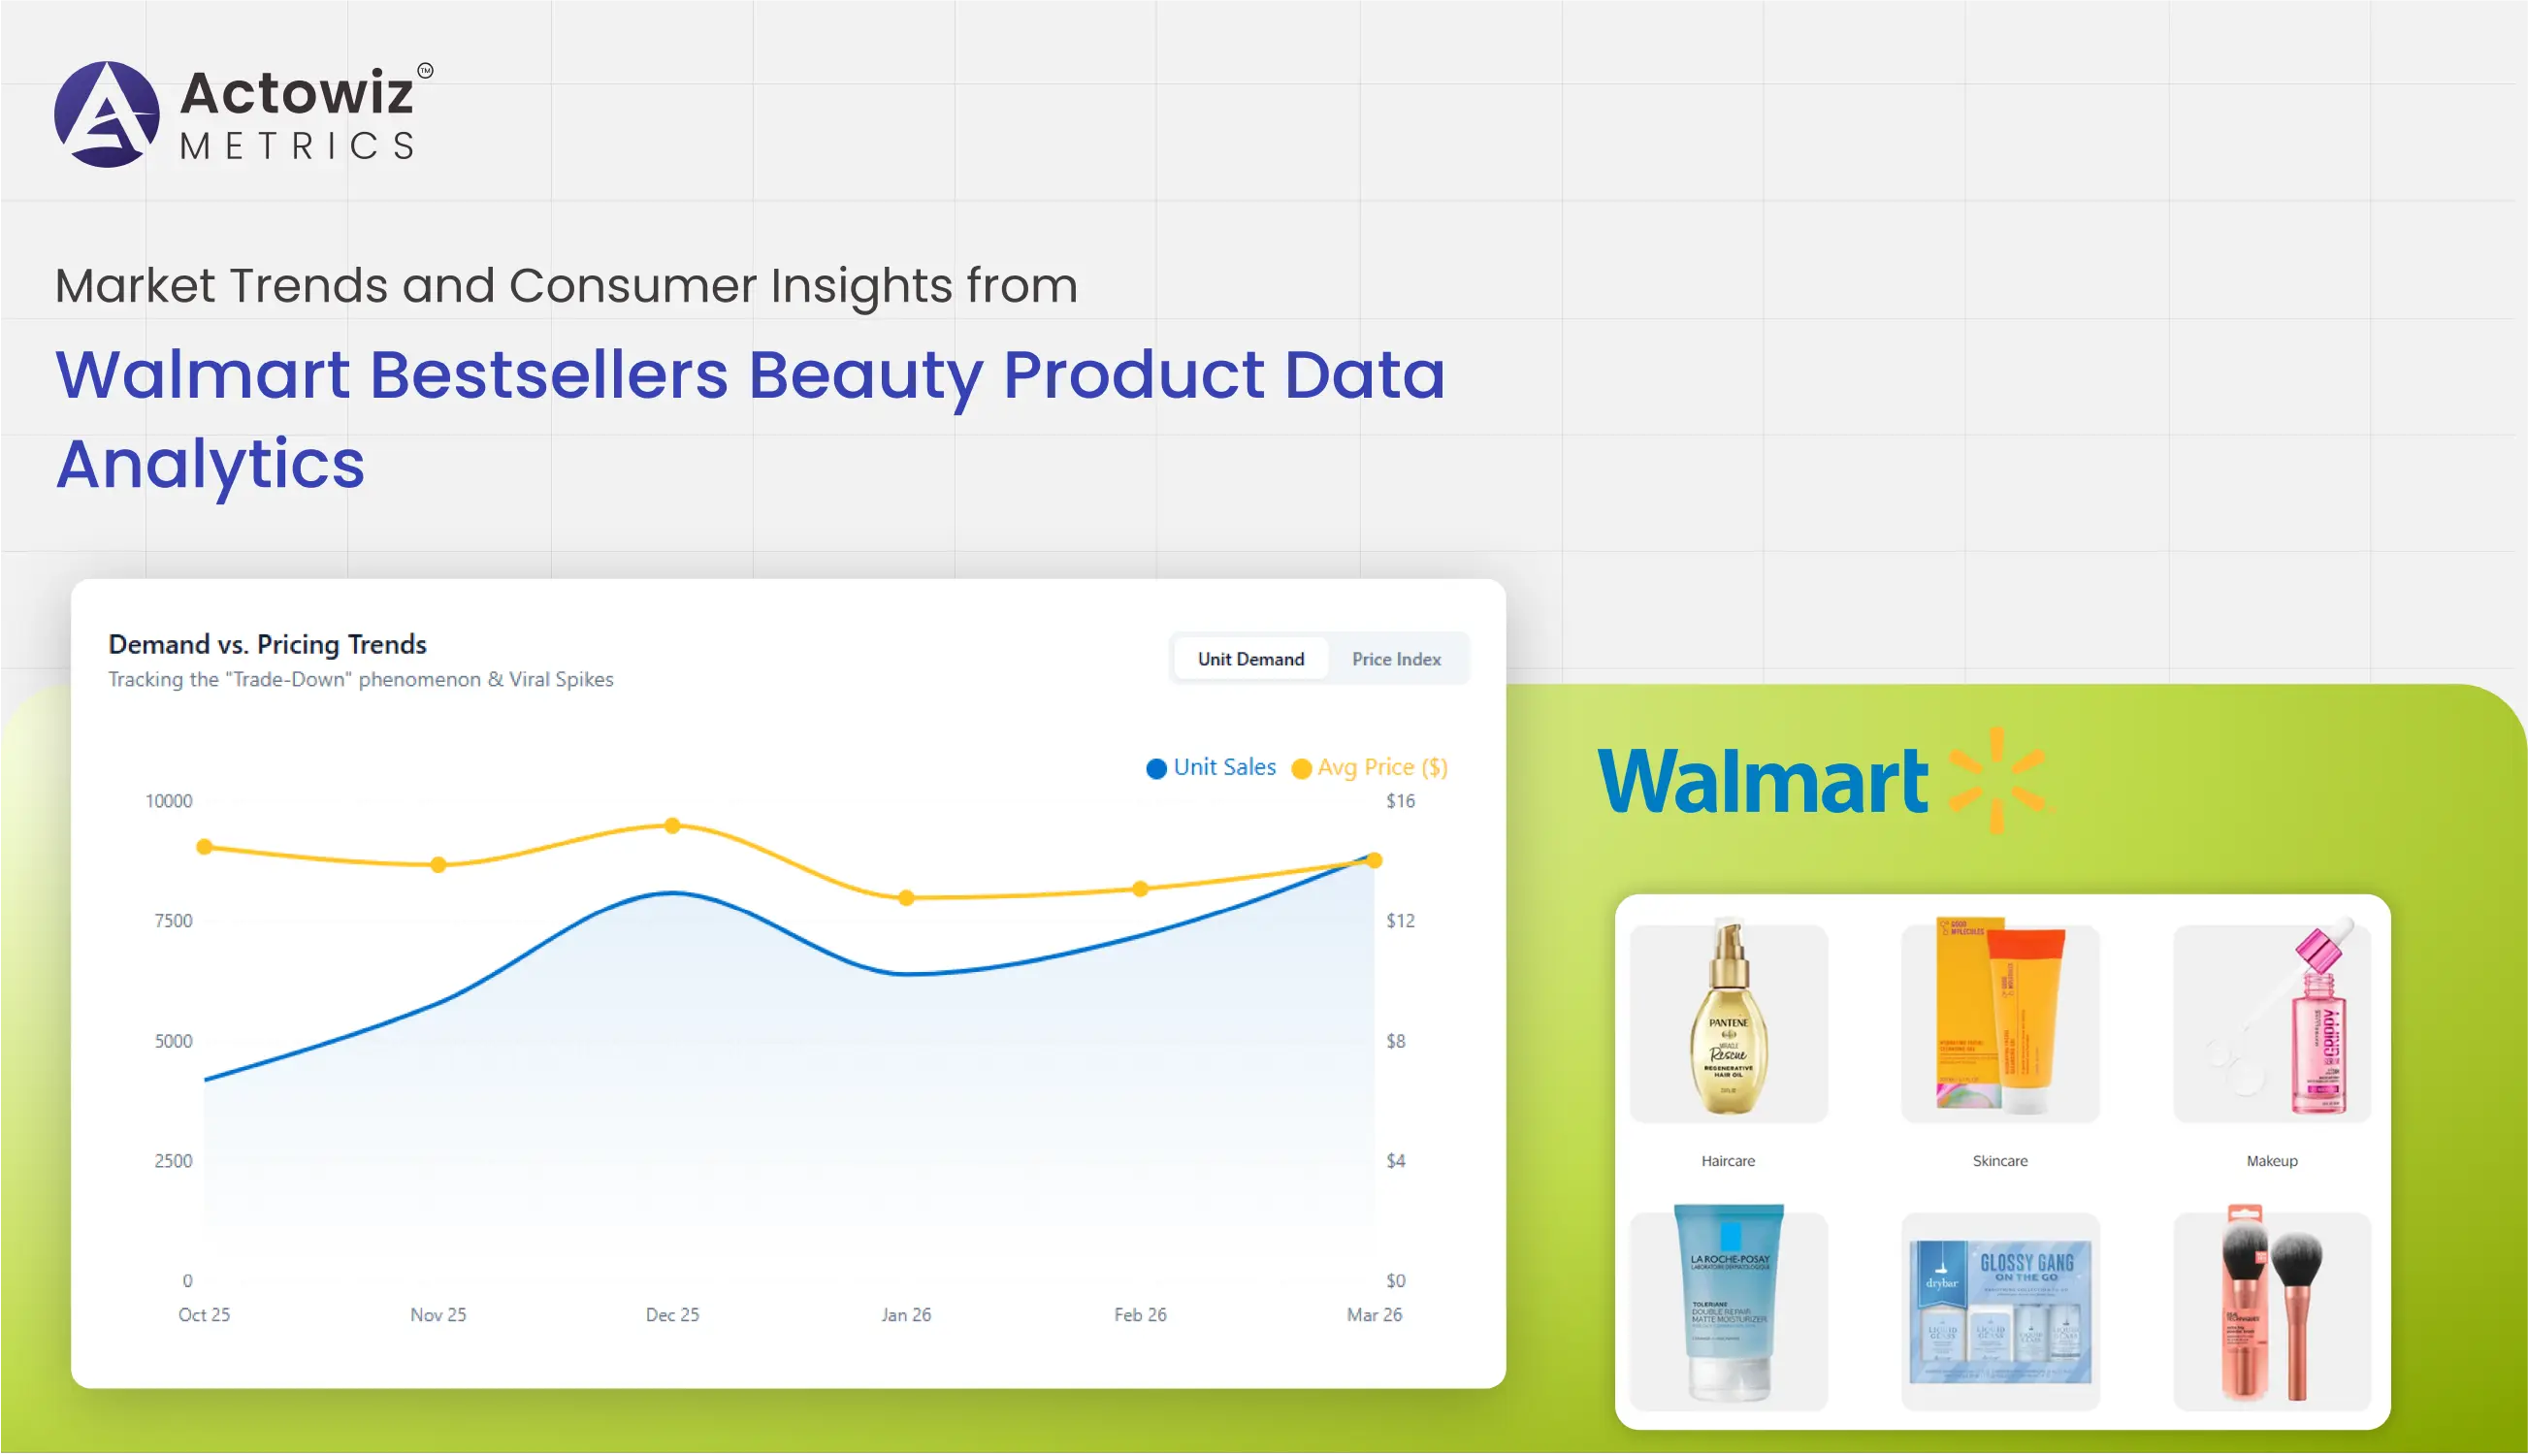
Through advanced retail intelligence and Price Benchmarking, brands and market analysts can evaluate how beauty products perform across Walmart’s digital shelves. This includes analyzing bestseller rankings, product pricing, consumer ratings, promotional campaigns, and category performance across skincare, cosmetics, and personal care segments.
Between 2020 and 2026, the beauty industry has seen strong growth due to increased online shopping and the rise of influencer-driven product discovery. Walmart’s digital platform has become an important marketplace where brands compete for visibility and ranking in bestseller lists.
Analyzing bestseller data allows businesses to identify emerging product trends, track price fluctuations, and evaluate the competitive landscape. By extracting and analyzing this data, retailers can understand which products resonate most with consumers and how pricing strategies influence product popularity.
For beauty brands and market researchers, data-driven insights from Walmart’s bestseller categories provide a powerful foundation for understanding consumer demand and optimizing retail strategies.
The growth of online beauty retail has transformed the way consumers discover and purchase skincare and cosmetic products. With increasing digital adoption, Walmart’s online marketplace has become a major destination for beauty shoppers.
Through Walmart Beauty Bestsellers Data Extraction, companies can gather structured data related to bestseller rankings, product details, pricing trends, and customer engagement metrics. This data enables continuous Product Data Tracking, allowing analysts to monitor how products move within bestseller lists over time.
| Year | Global Beauty E-commerce Sales ($ Billion) | Walmart Beauty Category Growth |
|---|---|---|
| 2020 | 75 | 12% |
| 2021 | 82 | 14% |
| 2022 | 90 | 15% |
| 2023 | 98 | 16% |
| 2024 | 108 | 17% |
| 2025 | 118 | 18% |
| 2026 | 130 | 19% |
This growth reflects the increasing popularity of online beauty shopping, where consumers compare products, read reviews, and discover trending items through digital platforms.
Bestseller rankings on Walmart’s website often change due to several factors:
By tracking bestseller data continuously, brands can identify the factors that influence product visibility and sales performance.
Additionally, bestseller rankings help emerging beauty brands compete with established global companies. Many niche brands have gained popularity by entering Walmart’s top-selling categories through strong product reviews and competitive pricing strategies.
Pricing strategies play a crucial role in determining the success of beauty products within Walmart’s marketplace. Brands must carefully balance affordability, quality perception, and promotional campaigns to remain competitive.
Through Walmart Skincare And Makeup Price Monitoring, analysts can observe pricing patterns across multiple product categories and track how brands adjust their pricing in response to market competition.
| Year | Average Skincare Product Price ($) | Average Makeup Product Price ($) |
|---|---|---|
| 2020 | 15 | 12 |
| 2021 | 16 | 13 |
| 2022 | 17 | 14 |
| 2023 | 18 | 15 |
| 2024 | 19 | 16 |
| 2025 | 20 | 17 |
| 2026 | 21 | 18 |
Several factors influence price fluctuations in the beauty industry:
Price monitoring allows retailers and brands to evaluate how competitor pricing strategies impact product demand. For example, mid-range skincare products priced between $15 and $25 have shown the highest conversion rates among Walmart shoppers.
Additionally, the rise of affordable luxury beauty products has created a new segment where brands offer high-quality formulations at competitive prices. This trend has led to increased competition within Walmart’s beauty bestseller categories.
Analyzing product performance at the SKU level provides deeper insights into how individual product variations perform across Walmart’s beauty catalog. Through Walmart Beauty SKU-Level Data Tracking, companies can evaluate product attributes such as size variations, color shades, and packaging formats.
SKU-level analysis helps identify which product variants generate the highest sales and customer engagement. This information is valuable for inventory management and product development.
Additionally, brands often implement pricing policies to maintain consistency across retailers. Through automated Map Monitoring, companies can ensure that sellers comply with Minimum Advertised Price (MAP) guidelines.
| Product Category | Average SKUs per Product | Top-Selling Variant |
|---|---|---|
| Skincare | 12 | Moisturizing Cream |
| Makeup | 18 | Liquid Foundation |
| Hair Care | 10 | Repair Shampoo |
| Personal Care | 8 | Body Lotion |
SKU-level insights also reveal interesting consumer behavior patterns. For example:
These insights enable brands to optimize their product portfolios and focus on variants that drive the highest demand.
Promotions and discounts are major drivers of product visibility within Walmart’s beauty bestseller lists. Brands frequently launch promotional campaigns to increase product exposure and encourage customer purchases.
Using Walmart Beauty Product Discount And Promotion Scraping, analysts can track promotional campaigns and measure their effectiveness in driving sales performance. This data supports detailed Brand Competition Analysis, helping companies understand how competitors attract customers.
| Year | Percentage of Beauty Products on Discount |
|---|---|
| 2020 | 22% |
| 2021 | 25% |
| 2022 | 27% |
| 2023 | 30% |
| 2024 | 32% |
| 2025 | 35% |
| 2026 | 38% |
Discount campaigns often occur during major retail events such as:
Brands that effectively use promotions can significantly increase their product visibility and improve their chances of entering bestseller rankings.
However, excessive discounting may reduce perceived brand value. Therefore, companies must carefully balance promotional strategies with long-term brand positioning.
Analyzing category listings provides valuable insights into consumer preferences and emerging beauty trends. Through Scrape Walmart Bestsellers Beauty Category Listings, analysts can monitor which product categories dominate bestseller rankings over time.
| Category | Share of Bestseller Listings |
|---|---|
| Skincare | 32% |
| Makeup | 28% |
| Hair Care | 20% |
| Personal Care | 12% |
| Beauty Tools | 8% |
Skincare products currently dominate Walmart’s beauty bestseller categories due to rising consumer interest in skincare routines and dermatologically tested formulations.
Another major trend is the increasing popularity of clean beauty products that contain natural ingredients and environmentally friendly packaging.
Additionally, beauty tools such as facial rollers and makeup brushes have seen growing demand, driven by social media beauty tutorials and influencer recommendations.
By analyzing bestseller category data, brands can identify high-growth segments and align their product strategies accordingly.
In today’s competitive e-commerce environment, brands must continuously monitor how their products appear on digital retail platforms. Through Walmart Beauty Bestselling Products Analysis, companies can evaluate product rankings, customer reviews, and pricing trends.
This process is often supported by Digital Shelf Analytics, which helps brands understand their visibility and competitiveness across Walmart’s online marketplace.
| Metric | Importance |
|---|---|
| Product Ranking | Determines visibility |
| Review Rating | Influences purchase decisions |
| Price Positioning | Affects competitiveness |
| Product Availability | Impacts conversion rates |
Digital shelf insights allow brands to optimize product listings, improve product descriptions, and maintain competitive pricing strategies.
Companies that actively monitor digital shelf performance often achieve higher conversion rates and stronger brand recognition.
Retail analytics requires advanced technology and large-scale data processing capabilities. Actowiz Metrics provides powerful data intelligence solutions that help businesses extract valuable insights from e-commerce marketplaces.
Through advanced Walmart Bestselling Brands Analytics, companies can monitor brand performance, identify trending beauty products, and evaluate competitive strategies within Walmart’s digital marketplace.
Using Walmart Bestsellers Beauty Product Data Analytics, Actowiz Metrics enables organizations to track product rankings, monitor pricing trends, and analyze consumer sentiment across beauty categories.
Key capabilities include:
These solutions empower beauty brands and retailers to make smarter decisions based on accurate and comprehensive marketplace data.
The beauty retail landscape continues to evolve as digital commerce, influencer marketing, and consumer preferences reshape product demand across global marketplaces. Walmart’s online platform serves as a major hub for beauty product discovery, where bestseller rankings reveal important insights into consumer purchasing behavior.
Through Walmart Bestsellers Beauty Product Data Analytics, companies can track product performance, analyze pricing strategies, and monitor promotional campaigns across Walmart’s digital shelves.
By integrating advanced E-commerce Analytics, brands and retailers gain the ability to understand market trends, optimize pricing strategies, and improve digital shelf visibility.
Businesses that leverage data-driven insights can identify emerging beauty trends, enhance product positioning, and maintain a competitive advantage in the rapidly growing online beauty market.
Partner with Actowiz Metrics today to unlock powerful retail intelligence and transform your beauty market strategy with data-driven insights!
Expert blogs, research reports and infographics — practical, data-driven reading across e-commerce and quick-commerce.
Most fields are optional — the more you share, the better your sample.


.webp "infographics")
.webp "infographics")


