BLOG




















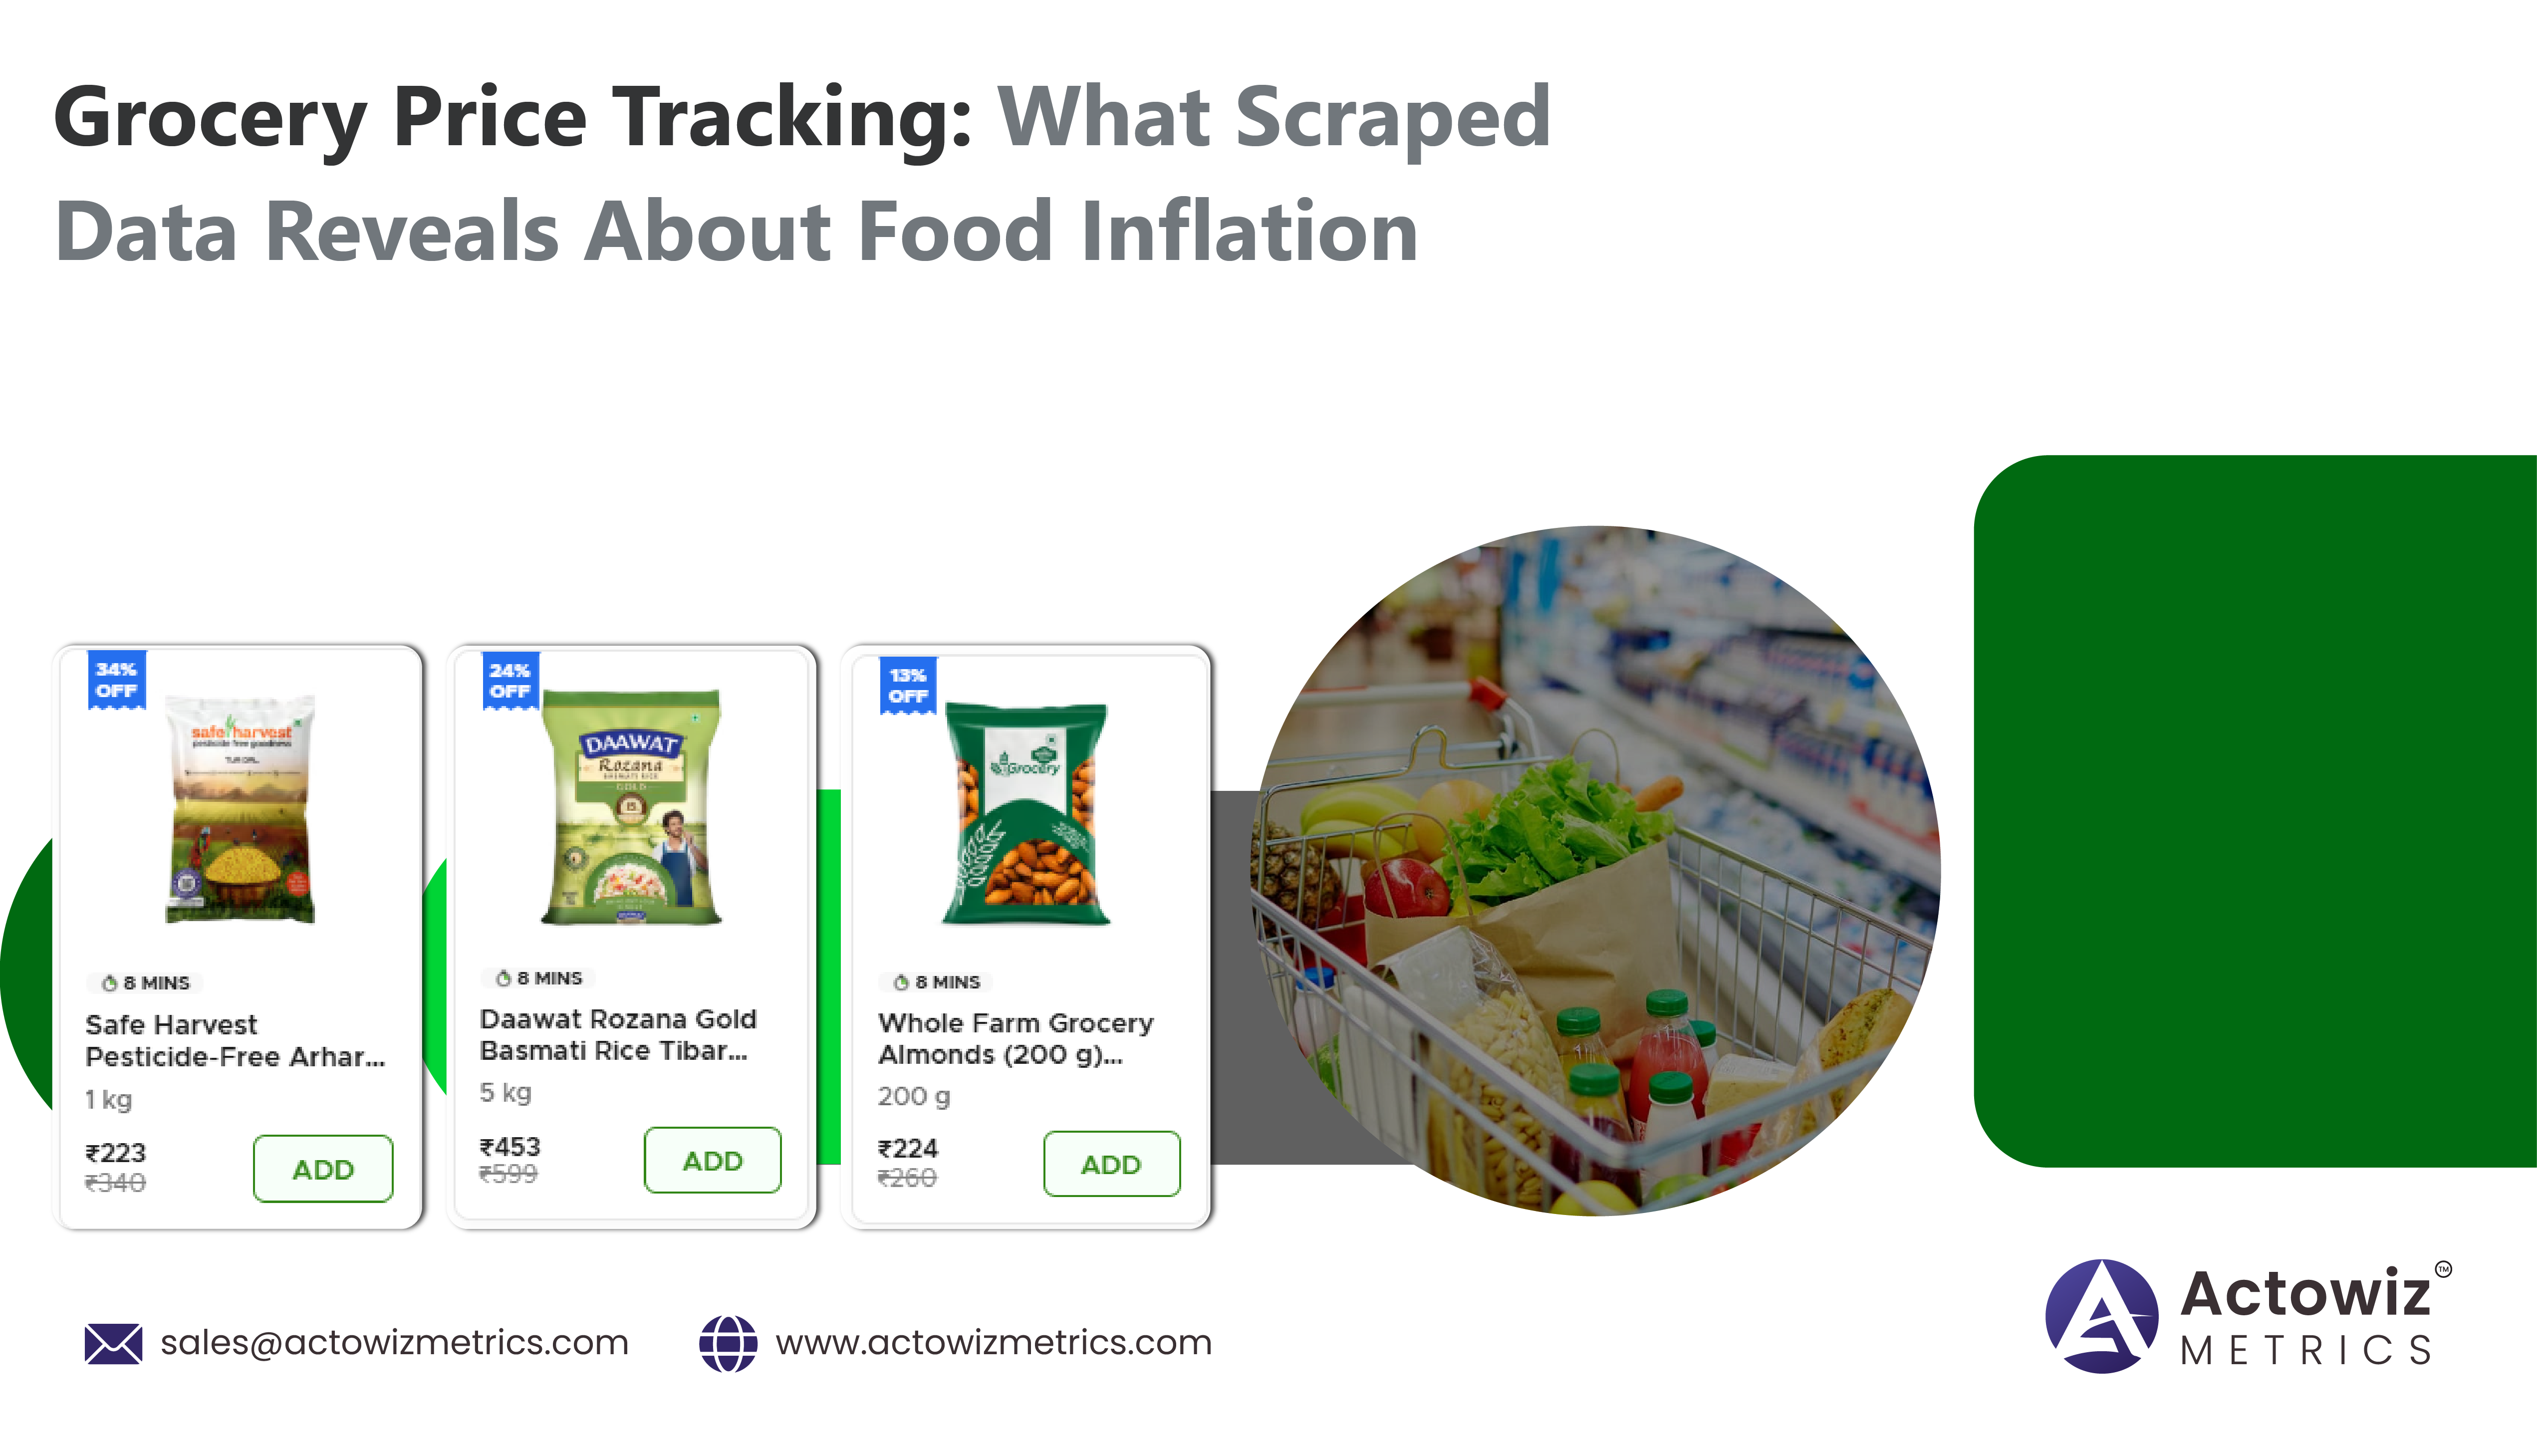
Few economic numbers affect more people than the price of food, yet the official statistics that describe it arrive weeks after the fact and describe averages rather than the shelf a shopper actually faces. Meanwhile, every supermarket and grocery app publishes its current prices openly, updated continuously. Grocery price tracking — systematically collecting those published prices and analysing them over time — closes that gap, producing a picture of food inflation that is faster, more granular, and more actionable than traditional reporting.
This is not merely an academic exercise. Retailers use it to position themselves against competitors, brands use it to understand how their products are priced on the shelf, and analysts, journalists, and researchers use it to see where prices are moving before official figures confirm it. This article explains how grocery price tracking works, what it reveals that official statistics cannot, who uses it, and how to do it in a way that produces reliable conclusions.
The premise is simple: the information already exists in public, updated continuously, and the only barrier is that nobody can read thousands of prices by hand. Removing that barrier changes what questions can be asked about food prices — from "what happened last quarter" to "what is happening this week, in this category, at this retailer."
Official price statistics are carefully constructed and authoritative, but they are built for consistency rather than speed. Data is collected on a periodic cycle, processed, and published weeks later, describing a period that has already passed. By the time a figure is released, prices have moved on. For anyone making a commercial decision — a retailer setting prices, a brand planning a promotion — that lag is the difference between acting and reacting.
Aggregation is the second limitation. A national food inflation number averages across regions, retailers, and products, which is exactly what makes it useful as a summary and useless as a guide to any specific shelf. Within that single figure, some categories may be rising sharply while others fall, and one retailer may be holding prices while another raises them. Those differences are invisible in the headline, yet they are precisely what commercial decisions depend on.
Collecting published prices directly resolves both limitations. Because the data is gathered continuously from the retailers themselves, it reflects the current shelf rather than a past period, and because every observation is tied to a specific product and retailer, it can be broken down as finely as the question requires. A brand can see how its own products are priced against competitors, category by category, retailer by retailer, week by week.
This granularity reveals dynamics a headline number cannot. It shows which categories are driving an overall movement, whether a rise reflects genuine base-price increases or simply fewer promotions, and how different retailers are responding to the same cost pressure. Promotion depth is especially revealing: an unchanged list price with shallower discounts is an effective price rise that never appears as one, and only continuous tracking of both base and promotional prices exposes it.
One of the clearest findings from tracked price data is that a national inflation figure rarely describes any particular shopper's experience. Retailers respond differently to the same cost pressures — one may hold headline prices while trimming promotions, another may raise prices selectively in less price-sensitive categories — and these strategies produce meaningfully different baskets for their respective customers.
Regional variation adds another layer. Prices for the same product can differ between locations within a single chain, reflecting local competition, logistics, and demand. For a brand, this means its products may be well positioned in one market and poorly positioned in another under the same national pricing strategy, a discrepancy invisible without location-aware collection.
| Category | Avg Price (this month) | 3 months ago | Change | Driver |
|---|---|---|---|---|
| Staples & grains | Index 108.2 | Index 100.0 | +8.2% | Base price increases |
| Dairy | Index 104.6 | Index 100.0 | +4.6% | Reduced promotions |
| Fresh produce | Index 97.4 | Index 100.0 | −2.6% | Seasonal supply |
| Packaged snacks | Index 102.1 | Index 100.0 | +2.1% | Pack-size changes |
Illustrative sample — a tracked basket broken down by category shows not just that prices moved, but which categories drove it and why.
The audience for this data is broader than it first appears, because food prices sit at the intersection of commerce, economics, and public interest.
In each case the appeal is the same: a current, detailed, evidence-based view of prices that can be interrogated rather than merely quoted.
Turning collected prices into trustworthy conclusions requires methodological care, and this is where amateur efforts usually fall short. The first requirement is a stable basket: the same products, in the same pack sizes, tracked consistently over time. If the basket changes between periods, the comparison measures the change in basket rather than the change in prices.
The second is careful handling of product matching and pack sizes, since a shift from one pack size to another can disguise a price change entirely. The third is capturing both list and promotional prices, so that changes in discount depth are visible rather than hidden. The fourth is consistent frequency, because irregular collection introduces gaps that distort trends. Attending to these turns a pile of prices into a defensible index; ignoring them produces numbers that look precise but mislead.
A few mistakes recur often enough to be worth naming. Comparing prices across retailers without accounting for pack size or unit measure produces meaningless differences. Ignoring promotions overstates stability, since much real-world price movement happens through discounting rather than list prices. Sampling too few products makes an index volatile and unreliable. And collecting from a single retailer describes that retailer rather than the market.
The underlying lesson is that grocery price tracking is only as good as its method. The collection itself is the straightforward part; the discipline lies in constructing a stable, representative basket and measuring it consistently. Done well, the result is a genuinely valuable read on where food prices are heading, often weeks before official confirmation.
For commercial users, the value of a price index lies in what it prompts. A retailer seeing its basket drift above competitors can adjust selectively rather than across the board, protecting margin while restoring perception. A brand seeing its products discounted more deeply at one chain than another can address the inconsistency with its retail partners. And any user seeing a category move sharply can investigate the cause while there is still time to respond.
This is the practical difference between tracking prices and merely reporting them. An index that only describes the past is interesting; one that surfaces movement early enough to act on is valuable. Building the tracking around the decisions it should inform — the right basket, the right retailers, the right cadence — is what determines which of the two a brand ends up with.
Collection frequency should follow how quickly prices in a category actually move. Grocery staples change less often than fresh produce, and promotional cycles typically run on weekly rhythms, so weekly collection is sufficient for many baskets while more volatile categories benefit from daily capture. The important thing is not maximum frequency but consistency — a weekly series collected reliably is far more useful than an irregular mixture of daily and monthly observations.
Consistency also matters within each collection. Prices gathered at the same point in a promotional week are comparable; prices gathered at different points are not, because a mid-week promotional launch can shift a basket materially. Establishing a fixed cadence and holding to it is one of the least glamorous and most decisive choices in building a credible price series.
Price data is unusually easy to misrepresent, so how results are presented matters nearly as much as how they are collected. Stating the basket, the retailers covered, the period, and whether promotional prices are included allows anyone reading a figure to understand what it does and does not describe. A number offered without that context invites misinterpretation, however carefully it was derived.
Indexing is generally clearer than quoting averages in currency, because it shows movement without implying that a typical shopper pays a particular amount. Breaking the headline into category contributions is more useful still, since it answers the natural follow-up question of what is driving the change. The aim throughout is to let the data support a conclusion transparently rather than to compress it into a single figure that hides its own assumptions.
Visualising the series helps as well. A chart of a basket index over several months communicates direction far more effectively than a percentage quoted in isolation, and it makes anomalies visible so they can be explained rather than quietly averaged away. Where the audience extends beyond analysts, this clarity is often what determines whether the work influences decisions at all.
Finally, it is worth stating what a tracked index is not. It measures published shelf prices, not what any household actually spends, which depends on what they buy and where. Being precise about that boundary strengthens rather than weakens the work, because it directs attention to the questions the data genuinely answers.
Grocery price tracking works with information retailers publish openly to shoppers — the prices displayed on their websites and apps. Collecting this public retail data responsibly and transparently, without touching personal information, keeps the practice on firm footing. It is worth being explicit about this, because the credibility of any price index depends as much on how the data was gathered as on how it was analysed.
Expert blogs, research reports and infographics — practical, data-driven reading across e-commerce and quick-commerce.
Most fields are optional — the more you share, the better your sample.

.webp "infographics")
.webp "infographics")