BLOG
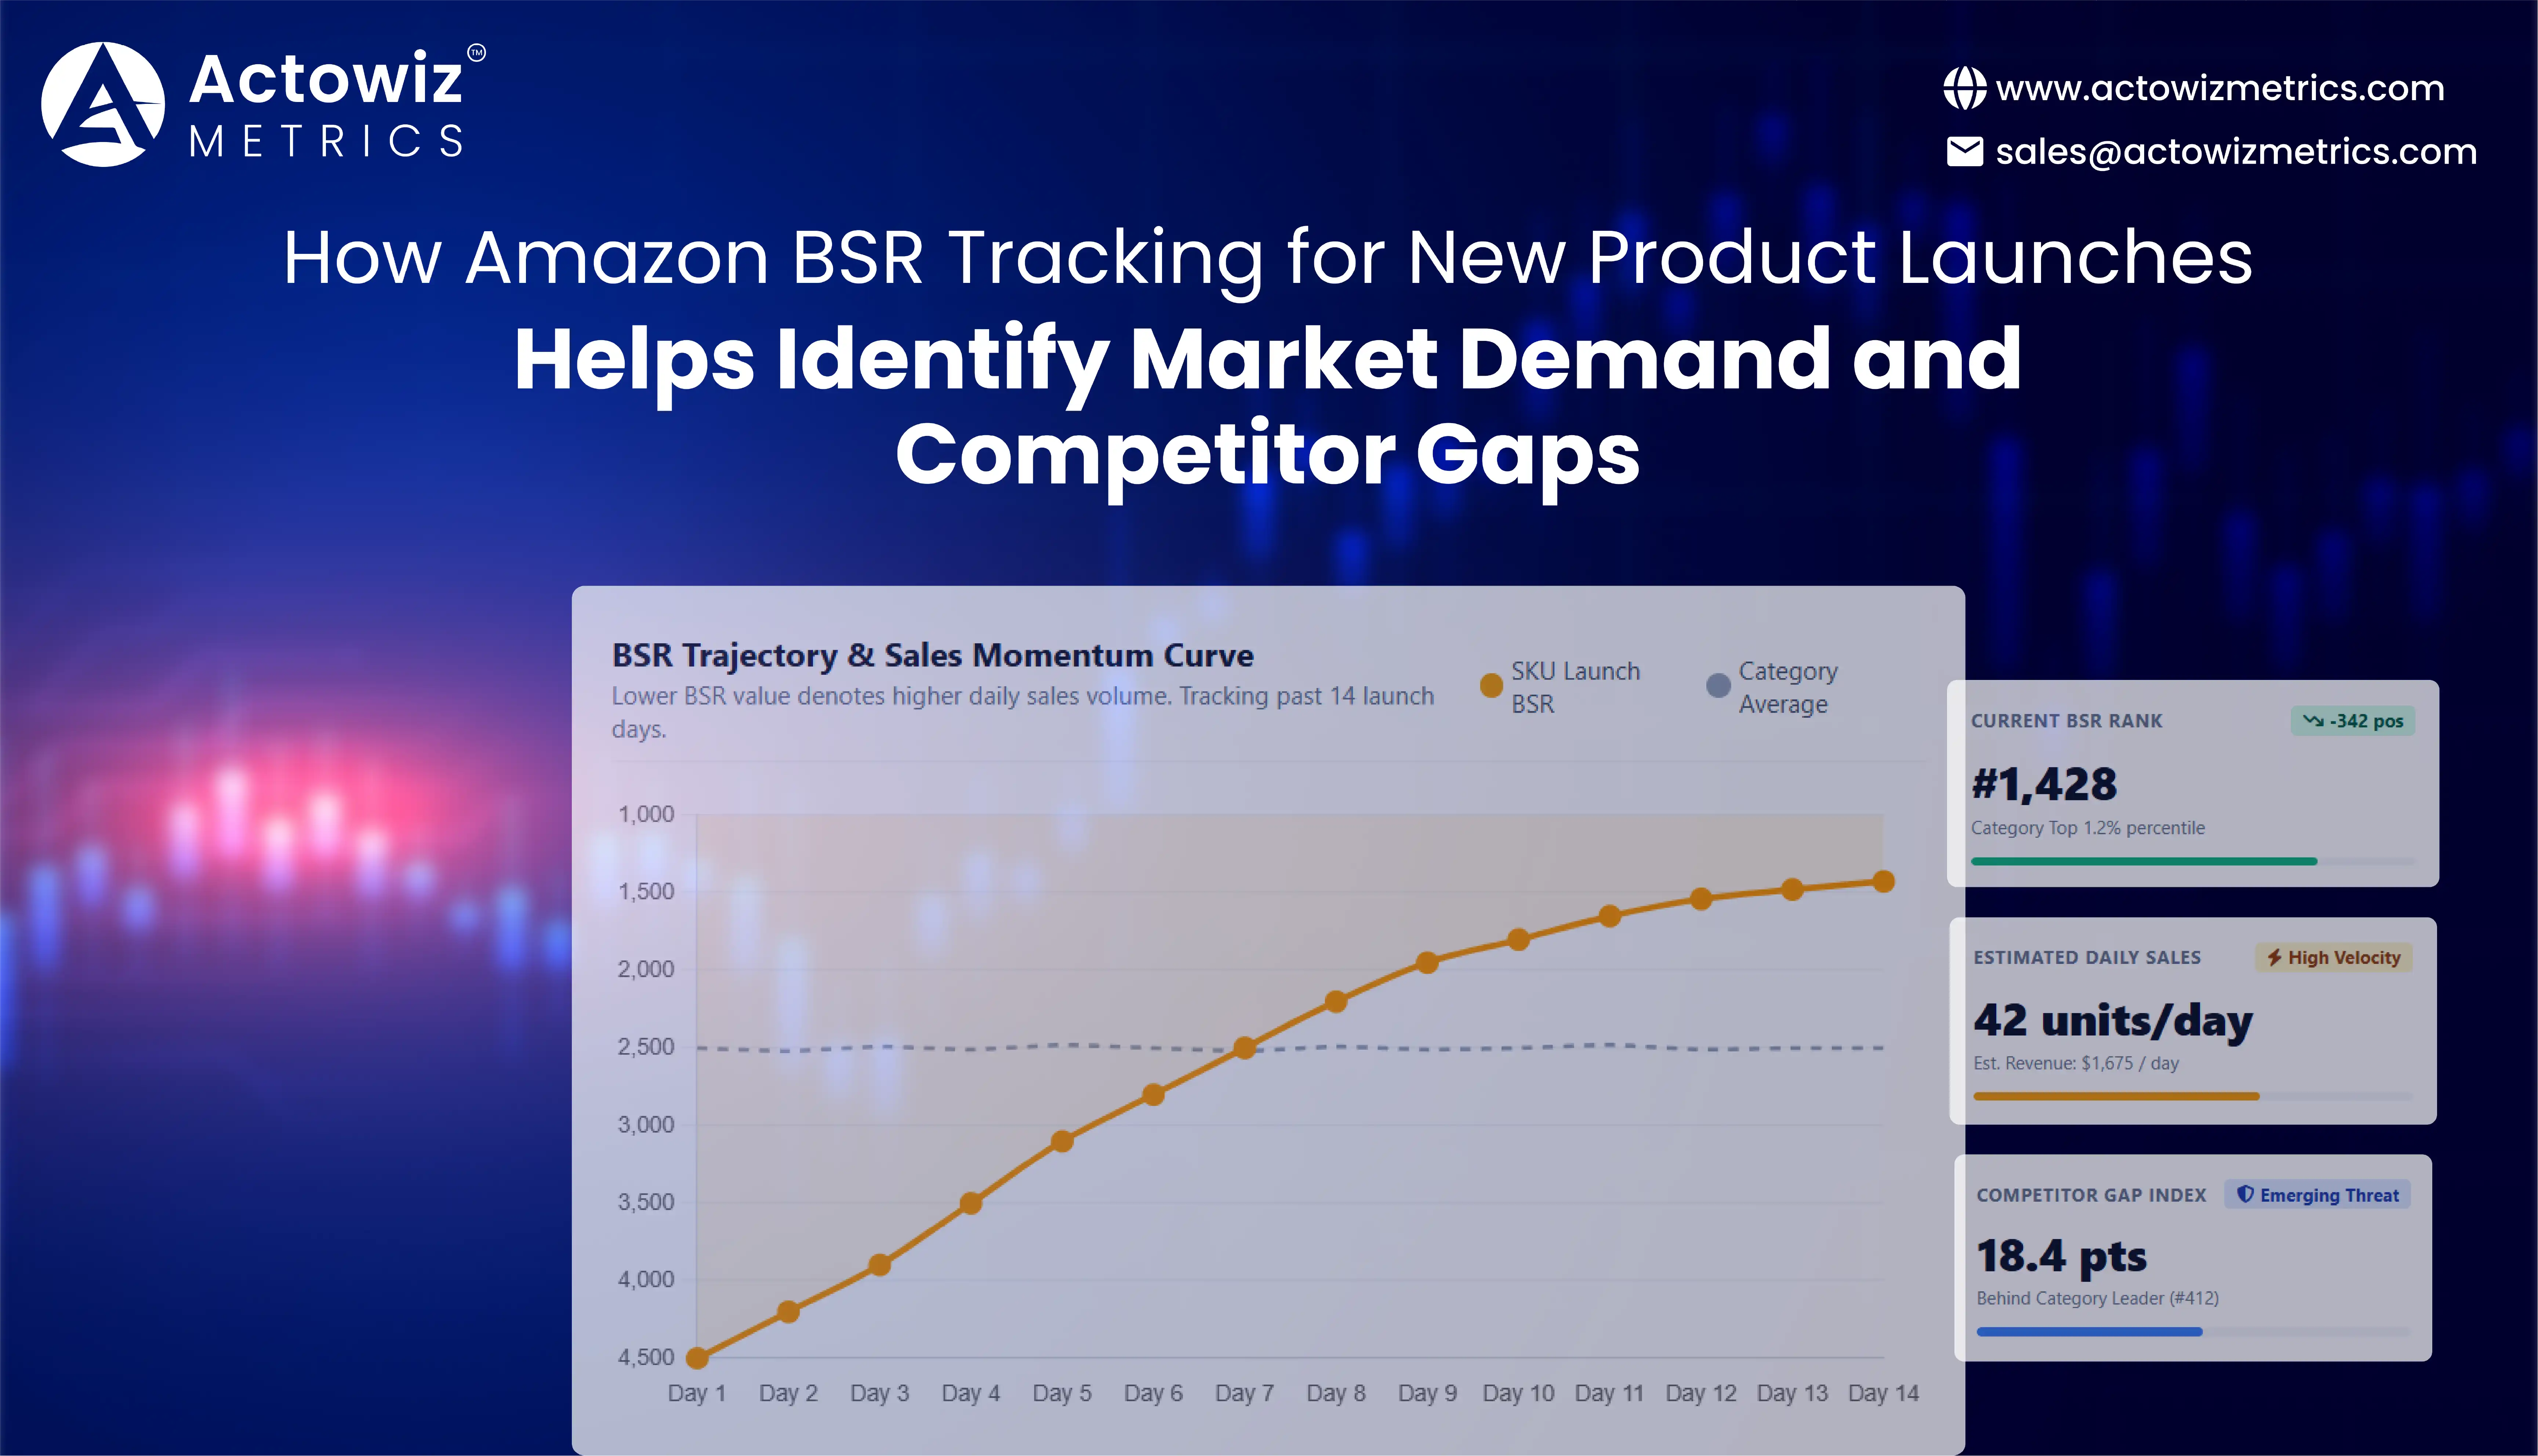




















Amazon BSR Tracking for New Product Launches helps brands understand whether a newly launched product is gaining sales momentum relative to other products in the same category. By combining BSR movement with price, availability, reviews, ratings, category position, and competitor signals, brands can identify demand patterns and market gaps faster. Amazon analytics turns these signals into actionable intelligence for product, marketing, and assortment decisions.
For a brand launching a new SKU, the first few weeks can be difficult to interpret. A product may receive traffic but show weak sales momentum. Another may start with limited visibility but quickly improve its category position. Looking at one BSR value cannot explain the full story. A time series of BSR changes provides a stronger performance signal.
Amazon defines Best Sellers Rank as a product's sales rank compared with similar products in its category. A lower BSR number generally indicates stronger sales performance, and Amazon notes that recent sales carry more weight than older sales. BSR is different from Amazon search ranking and should not be treated as an exact sales-volume figure. (Sell on Amazon)
For brand managers, marketplace teams, category managers, and product intelligence analysts, the practical question is not simply, "What is the BSR?" It is:
Is this new product gaining enough sales momentum to compete, and which competitors are creating the biggest performance gap?
Amazon BSR Monitoring and Competitive Intelligence enables brands to track how a new product performs against comparable listings over time.
BSR becomes more useful when it is collected at regular intervals rather than viewed as a single snapshot. For example, a product moving from #18,500 to #7,800 within two weeks shows a substantially different trajectory from a product moving from #8,000 to #9,200.
The important insight is the direction and velocity of movement.
Brands can monitor:
Amazon states that BSR is based on sales volume and that recent sales have greater influence than older sales. Therefore, tracking changes over time can help brands interpret sales momentum, although BSR should not be converted directly into an exact sales number without validated supporting data. (Sell on Amazon)
| BSR Pattern | Possible Interpretation | Recommended Action |
|---|---|---|
| Strong improvement | Increasing sales momentum | Maintain launch strategy |
| Gradual improvement | Healthy but slower adoption | Test pricing or advertising |
| Flat movement | Limited momentum | Review visibility and positioning |
| Sharp deterioration | Sales momentum may be weakening | Investigate price, stock, or competition |
| High volatility | Demand or promotional activity may be unstable | Compare with price and availability |
For competitive intelligence teams, the real opportunity is identifying why a competitor's BSR is improving. If a competitor's rank improves after a price reduction, promotional campaign, review increase, or stock recovery, that event becomes a useful competitive signal.
Amazon new SKU launch performance and BSR tracking gives product teams a structured way to evaluate the first days and weeks after a listing goes live.
A new SKU normally has limited historical information. Traditional monthly sales reports can therefore take time to reveal whether a launch is working. BSR monitoring provides an additional market-facing signal that can be compared with competitors and category benchmarks.
A useful launch dashboard should capture the following fields:
| Metric | Launch-Day Value | Week 1 | Week 2 | Week 4 |
|---|---|---|---|---|
| BSR | 24,800 | 17,400 | 9,850 | 6,920 |
| Price | $29.99 | $29.99 | $27.99 | $27.99 |
| Discount | 0% | 0% | 7% | 7% |
| Reviews | 0 | 12 | 31 | 64 |
| Rating | — | 4.4 | 4.5 | 4.5 |
| Availability | In stock | In stock | In stock | In stock |
Illustrative example for methodology, not Amazon-reported product data.
The objective is not to treat these values as universal benchmarks. Instead, the brand should compare the new SKU with a defined competitor set. For example, a product that improves its BSR while maintaining its price may demonstrate stronger organic demand than one whose improvement depends heavily on discounts. Similarly, a product whose BSR deteriorates during an out-of-stock period should not automatically be classified as a weak product. This is why BSR should be analyzed alongside operational and commercial variables.
Brands can assign internal signals such as:
This creates a more reliable launch-health framework than relying on one metric.
Amazon New SKU Ranking Performance Analysis helps brands determine whether a new product is gaining meaningful category traction.
One of the biggest mistakes in marketplace analysis is comparing BSR numbers without considering category context. Amazon BSR is category-specific. A #500 rank in one category does not necessarily represent the same level of performance as #500 in another category. Amazon also notes that a product can have multiple BSRs when it belongs to multiple categories or subcategories. (Sell on Amazon)
That makes category-aware monitoring essential.
| Product | Category | BSR | Previous BSR | Change |
|---|---|---|---|---|
| New SKU A | Category X | #720 | #1,950 | +1,230 positions |
| Competitor B | Category X | #480 | #520 | +40 positions |
| Competitor C | Category X | #1,100 | #1,450 | +350 positions |
| New SKU D | Category Y | #720 | #1,100 | +380 positions |
Illustrative comparison.
In this example, the same numerical BSR should not be interpreted as identical market performance because the products belong to different categories.
A better approach is to monitor:
Absolute rank + rank change + category position + competitor movement.
This helps answer questions such as:
Amazon's own guidance recommends using BSR and Best Sellers or Movers & Shakers lists to identify sales trends and product opportunities. (Sell on Amazon)
For category managers, this creates a practical way to detect underserved segments. If several high-ranking products share the same price range, feature set, and customer complaints, a new product can potentially differentiate through price, features, packaging, or service.
Amazon New product performance tracking becomes significantly more valuable when BSR is connected with other product-level attributes.
A BSR change alone cannot explain the reason behind a performance shift. Suppose a product moves from #12,000 to #4,500. The improvement could be associated with higher sales, a promotion, seasonal demand, competitor stockouts, or other marketplace factors. Therefore, data collection should capture a broader product snapshot.
| Data Point | Why It Matters |
|---|---|
| BSR | Measures relative category sales rank |
| Price | Identifies pricing position |
| Discount | Detects promotional influence |
| Availability | Explains potential sales constraints |
| Rating | Measures customer perception |
| Review count | Indicates accumulated customer feedback |
| Seller information | Shows marketplace competition |
| Category | Enables valid peer comparison |
| Product title | Supports listing analysis |
| Product attributes | Helps identify differentiation |
| Timestamp | Enables trend analysis |
Amazon BSR Tracking for New Product Launches should therefore be treated as a time-series intelligence layer rather than a standalone metric.
For example, if BSR improves while the product remains consistently in stock and its price stays stable, the signal may indicate stronger underlying demand. If BSR improves only during aggressive discounts, the product team should evaluate whether the launch is price-dependent.
A practical internal model can classify launch performance as:
Strong: BSR improving + stable availability + competitive pricing.
Emerging: BSR improving slowly + moderate customer response.
At Risk: BSR declining + strong competition + weak review growth.
Unclear: BSR highly volatile + frequent stock or price changes.
These classifications are not Amazon standards. They are analytical frameworks that brands can customize according to their category and commercial objectives.
Amazon New SKUs Ranking Intelligence can help brands move from performance monitoring toward market opportunity discovery.
The most valuable insight may not be that a new product ranks poorly. It may be why the category's strongest products succeed and where they leave customer needs unresolved.
Brands can combine ranking data with:
Consider a hypothetical category where the top 20 products are concentrated between $40 and $60. If customer reviews repeatedly mention that products are too expensive, a brand could test a $29.99–$34.99 product with a differentiated feature set.
Likewise, if high-ranking products have strong review volumes but limited availability, a consistently stocked alternative could capture demand when competitors are unavailable.
| Signal | Market Interpretation | Opportunity |
|---|---|---|
| Strong BSR + high price | Demand supports premium positioning | Premium alternative |
| Strong BSR + frequent stockouts | Demand may exceed supply | Availability-led positioning |
| Weak BSR + strong reviews | Product may have visibility issues | Improve discoverability |
| Strong BSR + negative review themes | Demand exists despite product gaps | Build improved alternative |
| Many competitors + similar features | Crowded market | Differentiate product |
| Few competitors + rising demand | Potential whitespace | Consider category entry |
This approach turns marketplace data into product-development intelligence.
It also helps answer an important executive question:
Should the brand improve the existing SKU, increase marketing investment, or develop another product?
Digital shelf analytics provides the broader context required to understand whether a new product is competitive on Amazon.
A digital shelf view brings together ranking, pricing, availability, content, reviews, ratings, and competitive assortment. This is especially valuable for brands managing multiple launches across categories. Amazon BSR Tracking for New Product Launches can form the performance layer of this framework.
For example:
| Digital Shelf Signal | What It Can Reveal |
|---|---|
| BSR improvement | Increasing sales momentum |
| BSR decline | Potential demand weakness |
| Price gap | Competitive pricing pressure |
| Stockout | Lost availability opportunity |
| Review acceleration | Increasing customer adoption |
| Rating decline | Product experience concerns |
| Competitor launch | New market pressure |
| Content differences | Listing optimization opportunity |
Amazon reports that more than 60% of sales in its store came from independent sellers in 2025, demonstrating the scale of competition from third-party sellers. Amazon also reported that more than 75,000 independent sellers surpassed $1 million in sales in 2025. (Amazon News)
For a new product, that competitive environment makes continuous monitoring more useful than occasional manual checks.
Between 2020 and 2026, marketplace intelligence shifted from periodic product checks toward continuous, multi-signal monitoring. In the early part of the period, many teams focused primarily on price, reviews, and product availability. As marketplace competition increased, brands increasingly needed structured historical datasets covering ranking, assortment, promotions, seller activity, and customer signals. Amazon's own BSR guidance now positions the metric as a way to understand sales performance, research products, and identify trends, while emphasizing that BSR is different from search ranking and is not an exact sales count. (Sell on Amazon)
In 2020–2021, pandemic-driven e-commerce expansion accelerated the importance of digital product visibility. During 2022–2023, brands increasingly focused on competitor price changes, assortment movements, review intelligence, and marketplace availability. In 2024, AI-assisted analytics and automated data workflows became more prominent across commerce operations. In 2025, Amazon reported that independent sellers accounted for more than 60% of sales in its store, reinforcing the importance of third-party competition. (Amazon SER) In 2026, Amazon India announced zero referral fees on more than 12.5 crore products under ₹1,000 across 1,800+ categories and reported 50% year-over-year growth in new sellers joining Amazon.in, illustrating how seller participation and competitive intensity can continue to change. (US Press Center)
The result is a clear shift: launch analysis is no longer only about asking whether a product is selling. Modern marketplace teams need to understand how quickly it is gaining traction, where it stands against competitors, what factors influence its movement, and whether the market contains an addressable gap.
Competitor intelligence becomes more actionable when marketplace data is collected consistently and delivered in a structured format.
Actowiz Metrics can help brands build a recurring Amazon product intelligence workflow that captures BSR, pricing, availability, ratings, reviews, categories, product attributes, and competitor information at defined intervals.
The objective is not simply to collect data. It is to create a historical dataset that allows analysts to identify patterns.
A structured workflow can include:
A launch dashboard can then answer practical questions such as:
Amazon itself highlights BSR as a tool for estimating demand and making product decisions, while recommending that sellers combine it with sales metrics and other business information. (Sell on Amazon)
For brands running multiple launches, automated collection can reduce the limitations of manual monitoring and create a consistent historical record for analysis.
Yes. Amazon BSR Tracking for New Product Launches can help brands identify relative sales momentum, compare new products with competitors, recognize category movement, and uncover potential market opportunities.
The key is not to treat BSR as a standalone sales number. Amazon explains that BSR reflects sales rank within a category, is influenced by sales volume, and differs from search ranking. (Sell on Amazon)
The strongest launch intelligence comes from connecting BSR with price, promotions, availability, ratings, reviews, category position, and competitor movement.
For product managers, this means faster answers to three critical questions:
Is demand increasing?
Are competitors gaining an advantage?
Where is the next product or positioning opportunity?
When these signals are collected continuously, brands can move from reactive marketplace reporting to proactive launch optimization.
Want to build a reliable Amazon product intelligence workflow? Contact Actowiz Metrics for automated product, ranking, pricing, competitor, and digital shelf data collection tailored to your business needs.
The blog keeps the requested keywords out of section titles, uses each assigned keyword once per section, and treats BSR as a relative category-sales signal rather than an exact sales-volume metric. Amazon's own 2025 guidance supports that distinction. (Sell on Amazon)
Expert blogs, research reports and infographics — practical, data-driven reading across e-commerce and quick-commerce.
Most fields are optional — the more you share, the better your sample.


.webp "infographics")
.webp "infographics")