BLOG


The UK grocery market has experienced substantial pricing and consumer-behavior changes between 2020 and 2026. Pandemic disruption, supply-chain pressures, inflation, changing household budgets, promotional strategies, private-label expansion, and the growth of online grocery shopping have made supermarket-level price intelligence increasingly important.
Tesco Asda Sainsburys Morrisons grocery price benchmark UK provides a structured framework for comparing product prices, promotions, assortment, and availability across four major supermarket groups. Comparing individual products over time can reveal price gaps, promotional movements, and changes in competitive positioning across categories such as dairy, bakery, beverages, cereals, snacks, frozen foods, fresh produce, and household essentials.
The digital component of grocery retail has also expanded. The Office for National Statistics has progressively incorporated supermarket scanner data into consumer price statistics, demonstrating the scale of retail transaction data available. From February 2026, ONS began using approximately 300 million grocery price points derived from sales of more than one billion product units per month for around half of the grocery market.
Digital Shelf Monitoring for UK Online Retailers is therefore increasingly relevant for brands that need to understand how products are presented and priced online. Digital monitoring can combine price, product information, promotional messaging, availability, pack size, and other observable attributes into a consistent historical dataset.
This report examines how supermarket data from 2020 through 2026 can support competitive grocery benchmarking, product analytics, digital shelf intelligence, and market research across the UK.
UK supermarket competitor price intelligence, Grocery and FMCG (CPG) digital shelf analytics can help brands transform individual product observations into a structured competitive dataset. Instead of manually checking a small number of products, businesses can monitor large SKU universes across Tesco, Asda, Sainsbury's, and Morrisons.
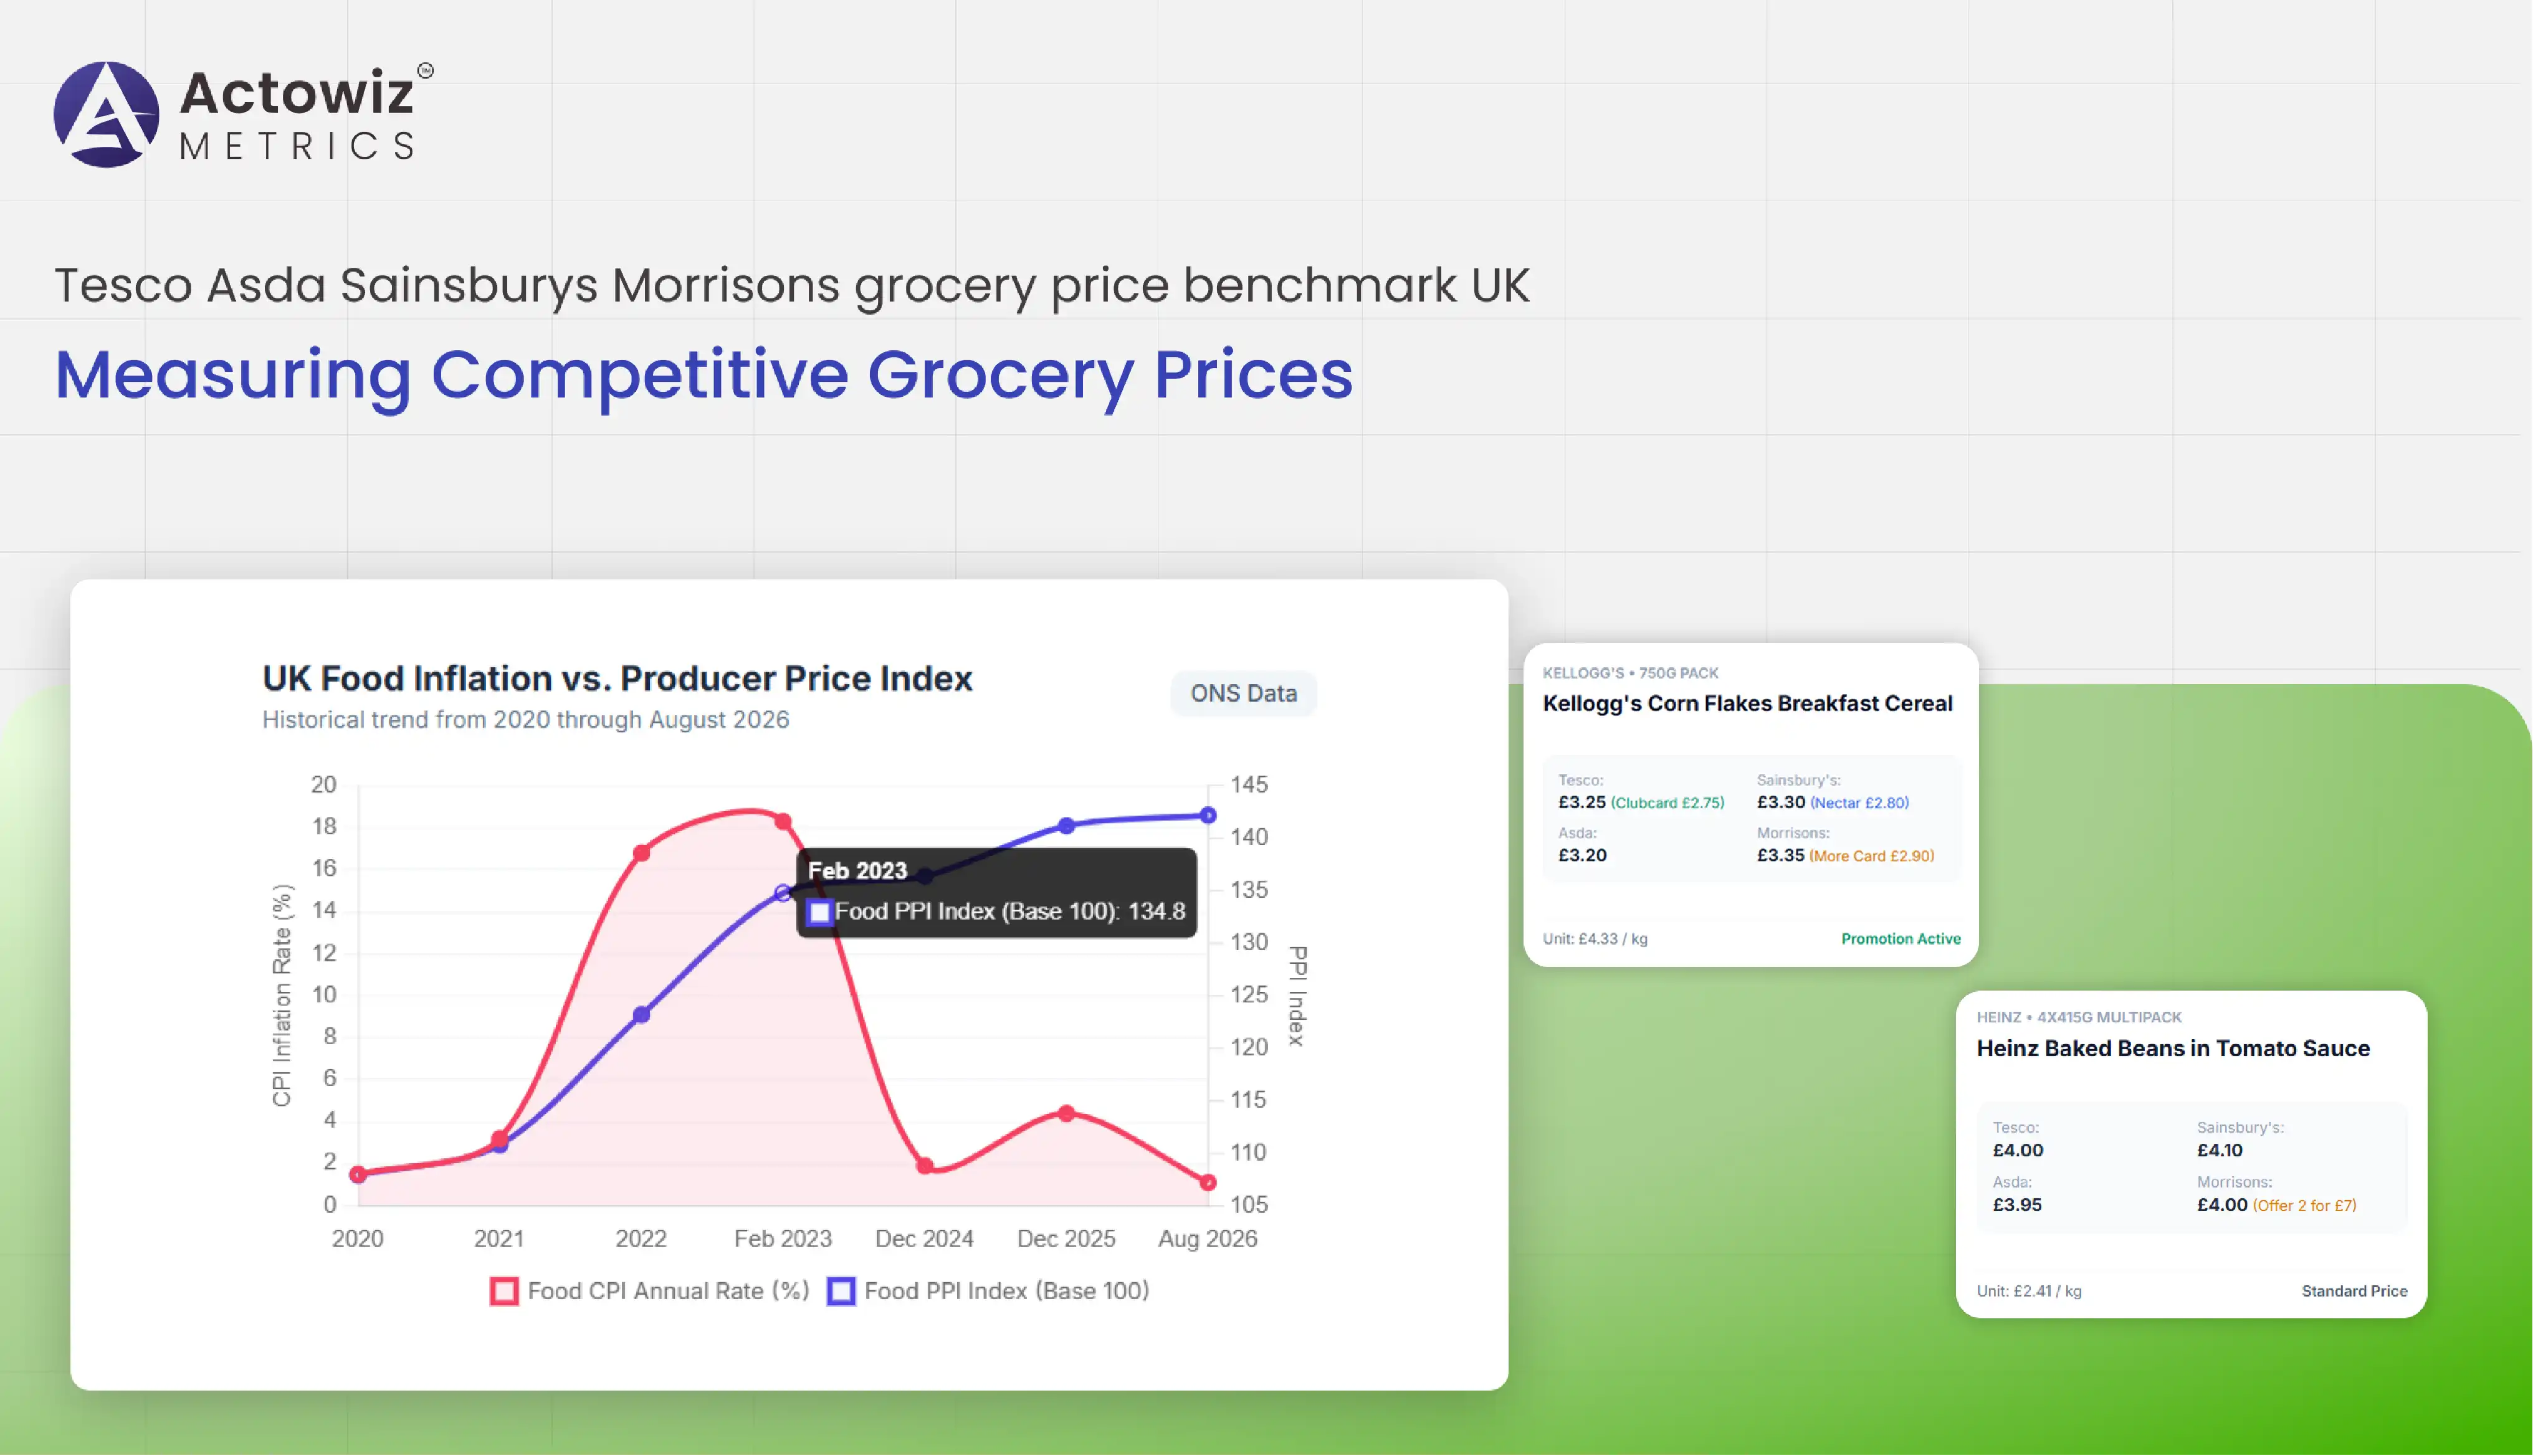
The need for consistent monitoring became more evident during the inflationary period. ONS food-price data shows that annual food inflation reached 18.3% in February 2023, after reaching 16.8% in December 2022. The annual rate subsequently declined to 1.9% in December 2024 before increasing again to 4.4% in December 2025. By August 2026, the annual food inflation rate was 1.1%.
| Period | UK food CPI annual rate | Competitive relevance |
|---|---|---|
| 2020 | Lower inflation | Establish baseline environment |
| 2021 | Rising price pressure | Monitor emerging changes |
| 2022 | Rapid acceleration | Frequent price tracking |
| Feb 2023 | 18.3% | High price volatility |
| Dec 2024 | 1.9% | Inflation moderation |
| Dec 2025 | 4.4% | Renewed price pressure |
| Aug 2026 | 1.1% | Continued monitoring |
The data demonstrates why a historical approach is valuable. A single price observation cannot explain whether a product's price movement is temporary, promotional, seasonal, or part of a longerterm trend.
For example, a brand selling breakfast cereal may track Kellogg's Corn Flakes, Weetabix, Nestlé cereals, and supermarket own-label alternatives. A beverage manufacturer could monitor Coca-Cola, Pepsi, Robinsons, and private-label soft drinks.
Digital shelf data can additionally capture whether a product is displayed with a promotion, multibuy offer, loyalty price, or standard price. This creates a broader competitive picture than a simple shelf-price comparison.
Tesco Asda Sainsbury Morrisons competitor price analysis allows grocery brands to evaluate price differences at SKU, brand, category, and pack-size levels.
A meaningful comparison requires product normalization. Two products may appear similar but have different weights, quantities, ingredients, or pack formats. For instance, a 500g cereal box should not automatically be compared with a 750g pack simply because both appear under the same category.
Unit-price calculations can therefore supplement headline prices. Businesses can compare price per kilogram, litre, item, or other appropriate measurement. Promotional prices can also be separated from regular prices to identify the impact of discounts.
The 2020-2026 period provides a strong historical context for this type of analysis. ONS producer-price data for food, beverages, and tobacco products shows an index of 107.9 in 2020, rising to 110.8 in 2021, 123.2 in 2022, 134.8 in 2023, 136.4 in 2024, and 141.2 in 2025.
| Year | Food, beverages & tobacco PPI index | Year-over-year movement in index |
|---|---|---|
| 2020 | 107.9 | — |
| 2021 | 110.8 | +2.9% |
| 2022 | 123.2 | +11.2% |
| 2023 | 134.8 | +9.4% |
| 2024 | 136.4 | +1.2% |
| 2025 | 141.2 | +3.5% |
| 2026* | 142.2 Aug. | Current observation |
*2026 figure is the August 2026 monthly index rather than a full-year result.
This historical movement illustrates why grocery brands benefit from tracking prices continuously. Competitive pricing can change alongside input costs, promotions, demand, retailer strategy, and category conditions.
A structured comparison can therefore support price benchmarking while also preserving the context surrounding each observation.
Tesco Asda Sainsbury Morrisons market intelligence for UK grocery brands enables businesses to move from individual price checks toward broader brand and category intelligence.
A manufacturer may want to know how its products are positioned across different retailers, whether promotional campaigns appear simultaneously, how competitors price similar products, and whether private-label products are becoming more prominent within a category.
For example, a packaged-food brand could monitor Heinz baked beans against supermarket own-label alternatives. A breakfast brand could compare Kellogg's, Nestlé, Weetabix, and private-label products. A household-products company could monitor brands such as Persil, Ariel, Fairy, and own-label detergents.
| Intelligence area | Potential application |
|---|---|
| SKU pricing | Track individual products |
| Brand pricing | Compare brand positioning |
| Promotions | Identify discount activity |
| Private label | Compare branded vs own-label products |
| Assortment | Measure retailer coverage |
| Pack size | Normalize price differences |
| Availability | Identify distribution gaps |
| Historical price | Detect recurring trends |
From 2020 onward, businesses increasingly needed historical context because grocery pricing experienced significant volatility. ONS food CPI data shows the annual rate reaching 18.3% in February 2023 before falling considerably over the following period.
By preserving daily or weekly observations, brands can distinguish a temporary promotional reduction from a sustained pricing change. This is particularly useful for category managers who need to evaluate pricing movements alongside competitor activity.
Market intelligence can also connect multiple variables. A product's price may fall while its promotional visibility increases, or a product may maintain its price while becoming unavailable. Examining these signals together can produce more useful commercial insights than analyzing price alone.
UK grocery price comparison Tesco Asda Sainsburys Morrisons can support cross-retailer benchmarking at product and category level.
A grocery benchmarking framework can compare regular prices, promotional prices, unit prices, pack sizes, availability, and retailer-specific offers. This helps businesses understand how the same product or comparable products are positioned across different supermarket environments.
The period from 2020 to 2026 is especially relevant because food inflation changed substantially. ONS data shows food inflation moving from very high annual rates in 2022-23 toward much lower rates during 2024, followed by renewed increases during 2025.
| Benchmarking metric | Example |
|---|---|
| Regular price | Standard listed price |
| Promotional price | Temporary discounted price |
| Unit price | £ per kg/litre/item |
| Price gap | Difference between retailers |
| Discount rate | Reduction from standard price |
| Pack-size variation | Different quantities |
| Availability | In-stock/out-of-stock |
| Historical change | Price movement over time |
For example, a grocery brand could create a weekly benchmark for coffee, cereal, pasta, milk, snacks, or beverages. Each product could be matched using brand, product name, size, and product identifier where available.
This creates an analytical foundation for understanding whether a price gap is caused by a promotion, pack-size difference, private-label positioning, or a genuine difference in listed price.
The approach can also be extended geographically. UK supermarket pricing may vary by location, fulfillment method, store format, and promotional availability. Location-aware datasets can therefore provide additional context when comparing online and store-linked observations.
Tesco Asda Sainsburys Morrisons Product Analytics can bring together product-level information from multiple supermarket channels and organize it into a consistent analytical framework.
Product analytics can include product name, brand, category, subcategory, pack size, price, promotional price, availability, product URL, ratings, reviews, and other publicly observable attributes. These fields can then be connected to historical observations.
The importance of structured grocery data is reflected in ONS's transition toward scanner data. In 2026, ONS reported using approximately 300 million price points per month from scanner data covering sales of more than one billion units, alongside manually collected data for the remaining portion of the grocery market.
| Product attribute | Analytical value |
|---|---|
| Product name | SKU identification |
| Brand | Brand comparison |
| Category | Category analysis |
| Pack size | Unit-price normalization |
| Regular price | Baseline comparison |
| Sale price | Promotion analysis |
| Availability | Stock monitoring |
| Rating | Customer signal |
| Reviews | Consumer feedback |
| Timestamp | Historical analysis |
From 2020 to 2026, the increasing availability of retail data has made it possible to create more detailed grocery intelligence systems. Historical product records can show when products entered or disappeared from an assortment, when prices changed, and how promotional activity evolved.
For FMCG brands, this can support digital shelf monitoring, category reviews, assortment planning, and competitive research.
Product analytics can also help identify gaps in product coverage. If a brand appears across Tesco and Sainsbury's but not another major retailer, the dataset can flag the difference for further commercial investigation.
UK Supermarket Competitive Intelligence, Tesco Asda Sainsburys Morrisons grocery price benchmark UK can combine product, pricing, promotional, assortment, and availability observations into a broader market-monitoring system.
Competitive intelligence is most useful when it preserves historical context. A current snapshot may show that two products have a £1 price difference, but historical observations can show whether that gap existed for months, appeared during a promotion, or emerged only recently.
| Intelligence layer | Example output |
|---|---|
| Price | Retailer-level benchmark |
| Promotion | Discount frequency |
| Product | SKU and brand coverage |
| Assortment | Category availability |
| Availability | Stock visibility |
| Unit economics | Price per kg/litre/item |
| Historical | Trend analysis |
| Geographic | Location-level comparison |
ONS's grocery scanner-data program provides an example of the scale at which retail price information can now be processed. Its 2026 methodology incorporates around 300 million grocery price points each month from scanner data covering more than one billion product units.
For commercial teams, a similar structured approach can support recurring competitive monitoring. Businesses can define a product universe, establish retailer mappings, collect observations on a schedule, validate records, normalize units, and deliver the resulting data to dashboards or analytics platforms.
The framework can cover grocery categories ranging from fresh food and dairy to beverages, snacks, frozen products, personal care, and household goods. It can also distinguish branded products from private-label alternatives.
This transforms supermarket data from a collection of individual observations into a reusable market intelligence resource.
Actowiz Metrics can help grocery brands, retailers, and market research teams develop structured supermarket datasets for pricing, products, promotions, assortment, and availability analysis. Tesco analytics can form one component of a broader UK supermarket monitoring framework covering product-level observations and historical competitive movements.
The approach can include automated collection, product matching, normalization, validation, historical storage, and analytics-ready delivery. This enables teams to move away from isolated manual checks and toward repeatable monitoring workflows.
Tesco Asda Sainsburys Morrisons grocery price benchmark UK can be structured around multiple dimensions, including:
Actowiz Metrics can also help organize data around specific business requirements. A grocery manufacturer may need daily monitoring of a limited set of priority SKUs, while a market research organization may require broader category coverage across thousands of products.
The resulting datasets can support pricing teams, category managers, brand managers, e-commerce teams, retailers, and competitive intelligence professionals.
With recurring collection and standardized product mapping, businesses can preserve historical observations and compare changes across retailers, categories, brands, and periods.
The UK grocery market has undergone substantial changes between 2020 and 2026. Food inflation reached exceptionally high levels during 2022 and 2023, subsequently moderated, and then increased again during 2025 before easing during 2026. ONS data shows food inflation at 1.1% in August 2026, while the food producer-price index remained considerably above its 2020 level.
Morrisons Grocery Product Data Extraction can contribute to this broader intelligence framework by creating structured product-level observations for pricing, availability, assortment, and historical analysis. Alongside Tesco Asda Sainsburys Morrisons grocery price benchmark UK, this type of data can help businesses build a more consistent view of competitive supermarket conditions.
The increasing use of scanner data by ONS also demonstrates the growing importance of large-scale retail datasets. In 2026, approximately 300 million grocery price points per month were being incorporated into UK consumer price statistics from scanner data, illustrating the depth of information available from modern retail transactions.
For grocery and FMCG organizations, combining product, price, promotion, availability, and historical information can create a stronger foundation for market research and commercial analysis.
Partner with Actowiz Metrics to build scalable UK supermarket data intelligence and transform Tesco, Asda, Sainsbury's, and Morrisons data into structured insights for pricing, product, and competitive analysis!
Expert blogs, research reports and infographics — practical, data-driven reading across e-commerce and quick-commerce.
Most fields are optional — the more you share, the better your sample.
.webp "infographics")
.webp "infographics")