BLOG


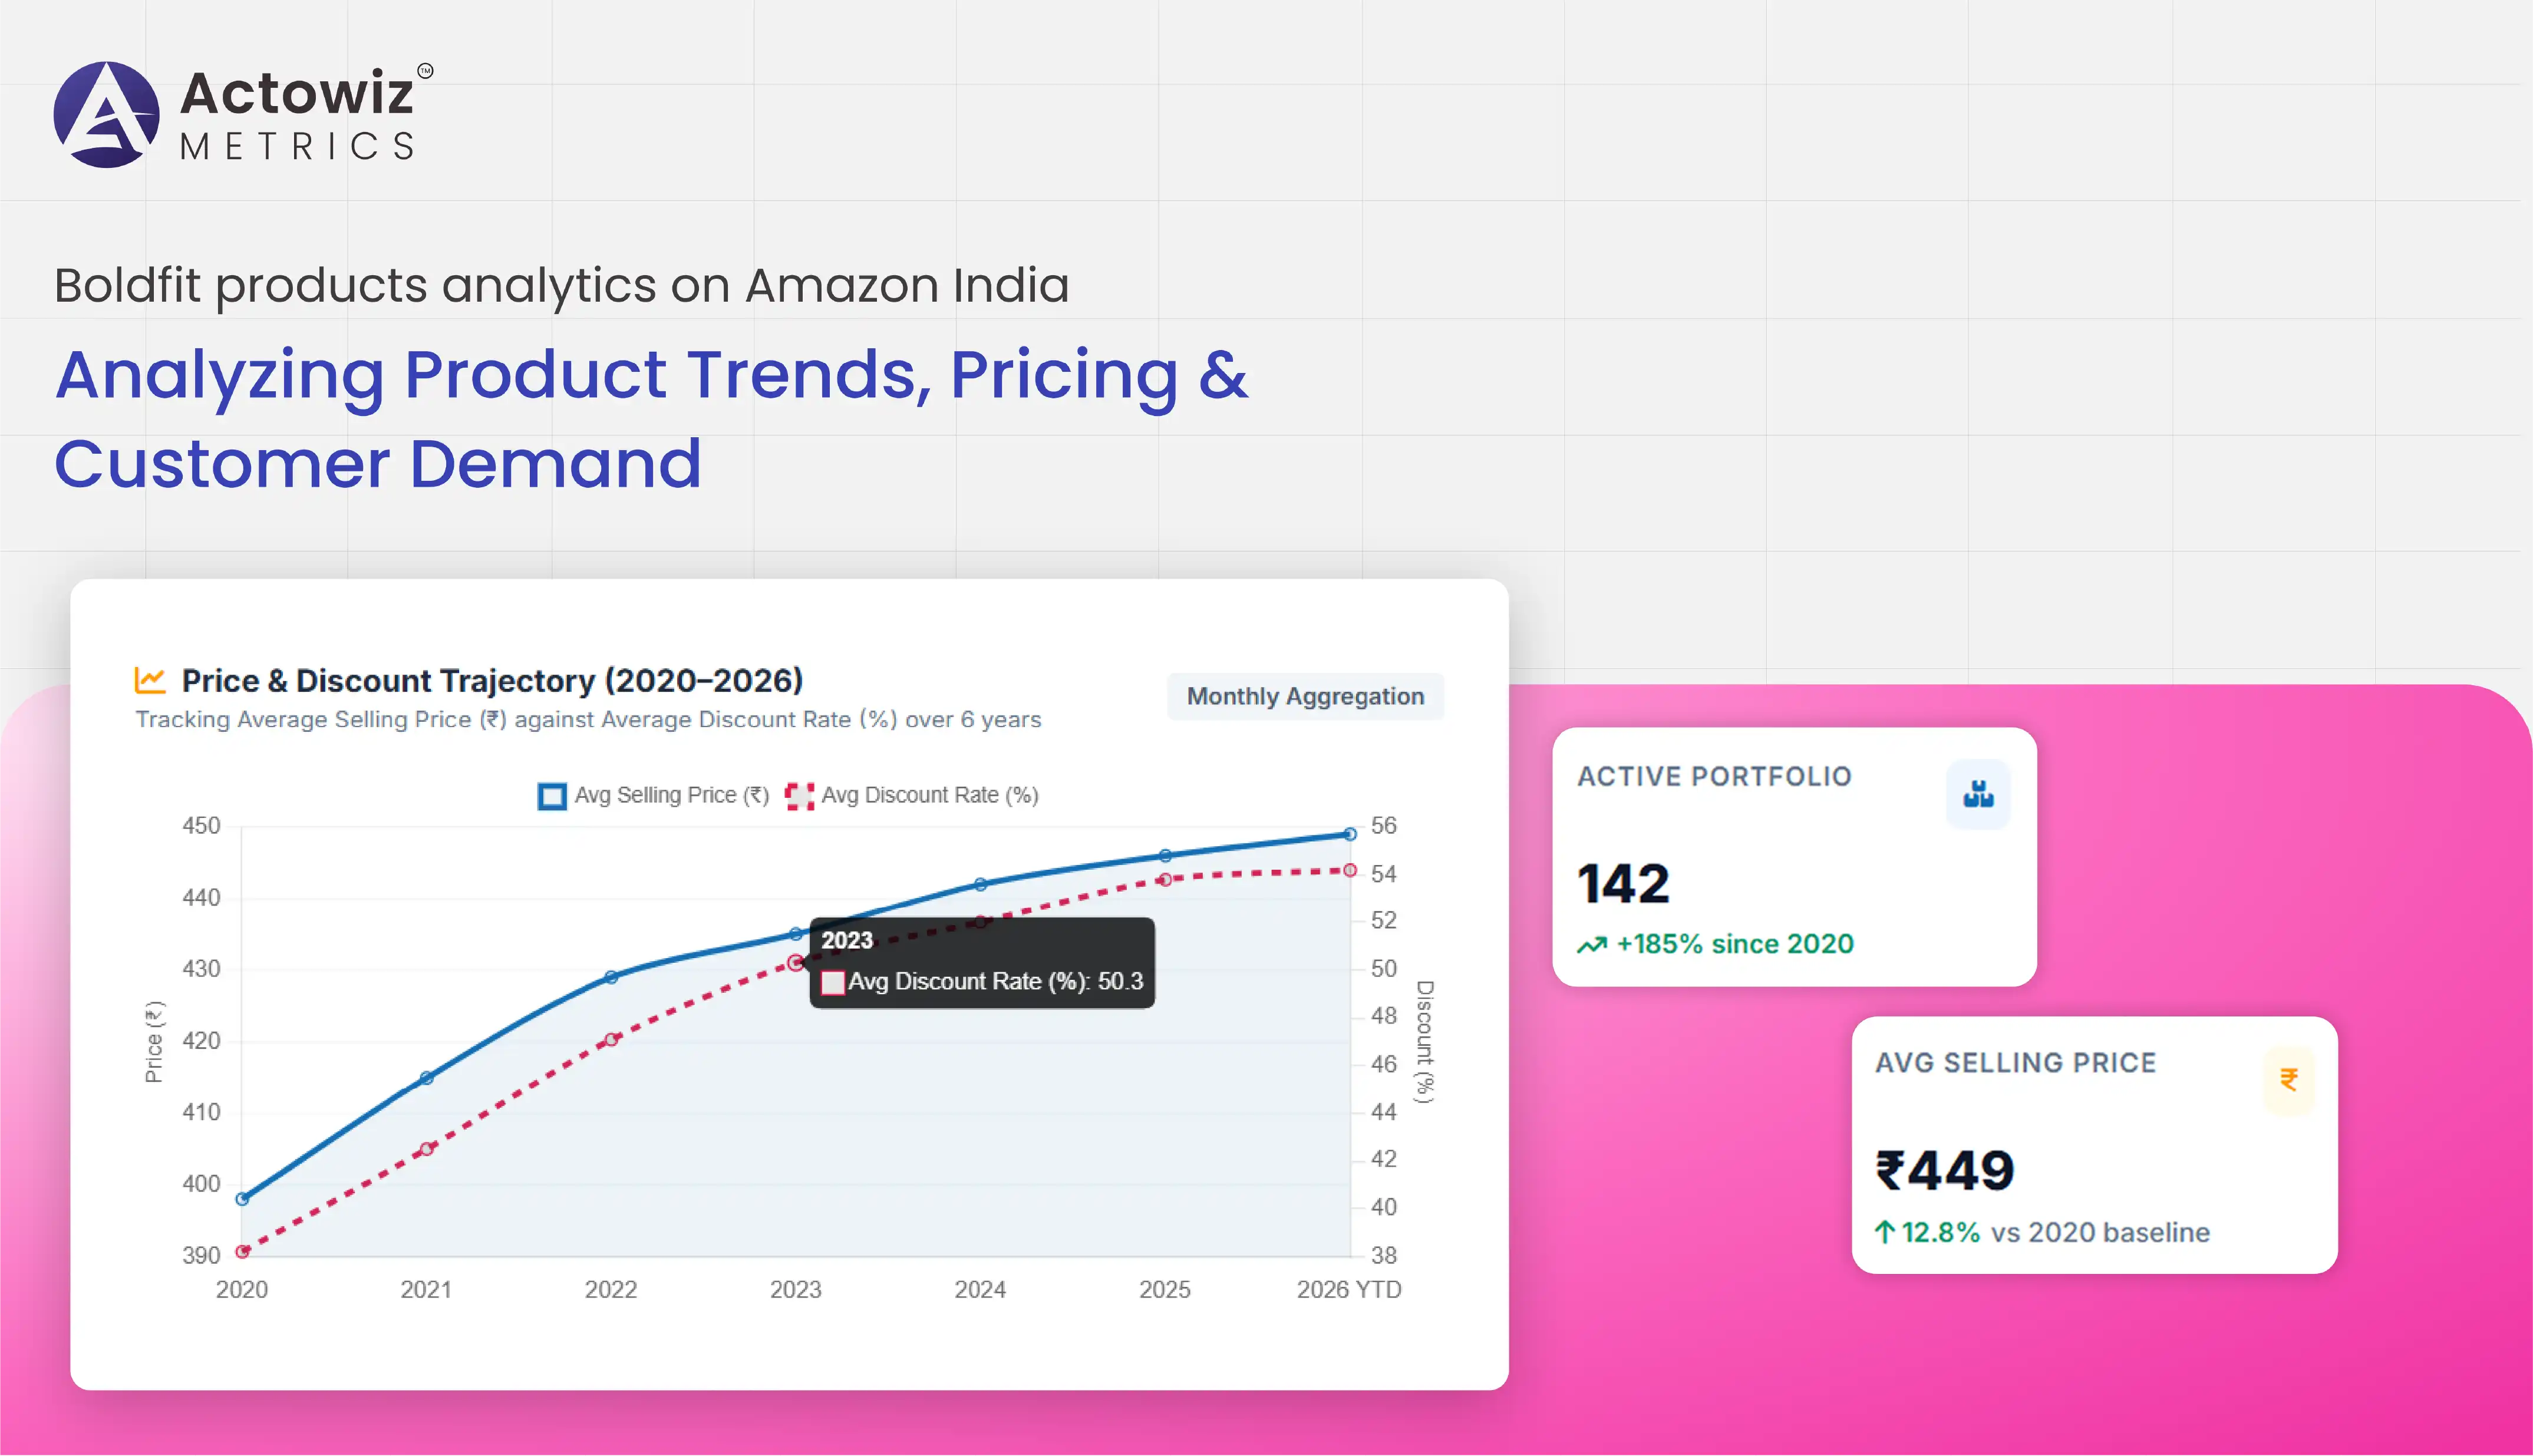
Amazon India has become an important marketplace for brands competing across fitness, sports, wellness, and lifestyle categories. For a brand such as Boldfit, monitoring product-level information can help businesses understand how pricing, discounts, ratings, reviews, availability, and assortment change over time. A structured approach to Boldfit products analytics on Amazon India can transform marketplace information into datasets that support pricing decisions, assortment planning, competitive monitoring, and demand analysis.
Marketplace intelligence is particularly valuable because product pages can change frequently. Prices may move because of promotions, seller activity, inventory conditions, or competitive pressure. Ratings and reviews also evolve as customers interact with products, providing signals about customer perception and product experience.
For retailers, manufacturers, marketplace sellers, and consumer brands, Digital shelf analytics provides a broader view of online shelf visibility. It can bring together product availability, search positioning, content quality, pricing, promotions, ratings, reviews, and competitor activity into a structured analytical framework.
This research report examines how businesses can analyze Boldfit's Amazon India presence from 2020 to 2026, identify meaningful marketplace trends, and use structured data to understand product performance and customer demand.
A reliable analytics program starts with collecting consistent product-level information. Boldfit product data can include product names, ASINs, categories, brands, product URLs, listed prices, sale prices, discounts, ratings, review counts, availability, seller information, product specifications, and other accessible attributes.
Scraping Amazon India at recurring intervals allows businesses to create historical snapshots rather than relying on isolated observations. These snapshots can be compared to identify pricing changes, assortment expansion, product availability patterns, and changes in customer feedback.
| Data Point | Example Analytical Use |
|---|---|
| Product name | Product identification |
| ASIN | SKU-level tracking |
| Price | Price benchmarking |
| Discount | Promotion analysis |
| Rating | Customer perception |
| Review count | Demand and engagement signal |
| Availability | Inventory visibility |
| Seller information | Marketplace monitoring |
Between 2020 and 2026, online shopping behavior in India continued to evolve, increasing the importance of structured marketplace data for consumer brands. The pandemic period accelerated digital purchasing across several consumer categories, while subsequent years saw customers become increasingly accustomed to comparing products, prices, ratings, reviews, and delivery options online. For fitness and wellness products, this transition created a marketplace environment where product visibility and customer feedback could influence purchasing decisions. Brands operating on Amazon India therefore had greater reason to monitor changes in product information rather than treating marketplace listings as static assets.
Historical datasets can help businesses reconstruct these changes. A 2020 product snapshot can be compared with observations from 2022, 2024, and 2026 to determine how assortment, pricing, reviews, and availability evolved. This longitudinal approach is useful because individual marketplace observations may not explain broader trends. For analytics teams, the objective is not simply to collect large volumes of information. The greater value comes from organizing records by product and date so that changes can be measured consistently. A recurring dataset can support dashboards, alerts, trend analysis, and category-level reporting while reducing the need for manual marketplace checks.
Product performance cannot be evaluated using price alone. Boldfit product performance analytics Amazon India can combine multiple marketplace signals to create a more complete view of how individual products perform.
A product with a high rating but limited availability may require a different interpretation from a product that maintains strong availability and continuously accumulates reviews. Similarly, a product with frequent discounts may have a different pricing pattern from one that maintains a relatively stable price.
| Performance Metric | What It Can Indicate |
|---|---|
| Average selling price | Pricing position |
| Discount percentage | Promotional intensity |
| Rating | Customer satisfaction signal |
| Review growth | Customer engagement |
| Availability | Stock visibility |
| Seller count | Marketplace competition |
| Content completeness | Listing quality |
| Product assortment | Portfolio breadth |
From 2020 through 2026, marketplace performance analysis increasingly moved from individual product checks toward multidimensional measurement. The growing quantity of product information available online made it possible for businesses to compare products using several indicators simultaneously.
For Boldfit, historical performance monitoring can reveal whether particular products have sustained visibility or whether performance has changed over time. Review accumulation can provide a useful longitudinal signal, while price histories can help identify periods of promotion or price repositioning.
A six-year analytical view can also reveal differences between established products and newer launches. Older products may have accumulated larger review volumes, while newer products can show rapid changes in pricing, ratings, and availability during their early marketplace lifecycle.
The value of historical analysis is especially clear when multiple indicators are combined. A rise in review volume alongside stable availability may represent sustained customer engagement, whereas a decline in availability alongside price changes could require additional investigation. These metrics should therefore be interpreted together rather than individually.
A structured performance dataset can also help businesses identify products requiring closer monitoring. Instead of manually reviewing every listing, analytics teams can establish thresholds around price changes, rating movements, availability changes, or review growth and use them to prioritize investigation.
Amazon India operates as a highly dynamic marketplace where customers can compare products from multiple brands. Boldfit competitor analysis on Amazon India can help businesses understand how competing products differ across price, ratings, reviews, discounts, assortment, and other visible marketplace attributes.
Competitive analysis can organize products into comparable groups based on categories or use cases. This makes it easier to identify pricing gaps, promotional differences, assortment overlaps, and changes in competitive positioning.
| Competitive Indicator | Business Question |
|---|---|
| Competitor price | How does pricing compare? |
| Discount level | How aggressive are promotions? |
| Rating | How is customer perception changing? |
| Review volume | Which products have stronger engagement? |
| Product count | How broad is the competing assortment? |
| Availability | Which products remain consistently visible? |
| Seller activity | How fragmented is marketplace supply? |
From 2020 to 2026, online competitive intelligence became increasingly relevant as consumers gained access to a wider range of products and brands. Marketplace competition is not limited to large established companies; emerging brands can also introduce competing products and quickly establish marketplace visibility.
Historical competitive datasets can reveal how product categories change over time. A category that had relatively few competing products in 2020 may contain substantially more comparable listings by 2026. Tracking this evolution helps businesses understand whether competition is becoming broader, more pricesensitive, or more fragmented.
Price benchmarking is another important component. A product's current price provides limited context unless it is compared with relevant competing products. Historical price observations can show whether competitive gaps persist or occur only during promotional periods.
Reviews and ratings add another layer. Competitor products with increasing review volumes can signal sustained marketplace engagement, while rating changes may indicate evolving customer experiences. These signals should be interpreted alongside product attributes and pricing rather than treated as direct measures of market share.
Regular competitive monitoring can therefore create a time-series view of the marketplace. Businesses can use these datasets to identify changes in competitor assortment, pricing strategies, promotional activity, and customer response.
Demand analysis requires more than counting sales, particularly when direct transaction data is unavailable. Boldfit product demand analytics Amazon India can use observable marketplace indicators such as review growth, ratings, availability, pricing, discounts, and assortment changes as supporting signals.
These indicators can be combined into dashboards that help businesses identify products requiring further investigation.
| Demand Signal | Potential Interpretation |
|---|---|
| Review growth | Increasing customer engagement |
| Stable availability | Consistent marketplace presence |
| Price movement | Pricing or promotion changes |
| Discount frequency | Promotional activity |
| Rating movement | Changing customer feedback |
| Assortment expansion | Portfolio development |
| Product visibility | Marketplace presence |
The period from 2020 to 2026 provides a useful timeframe for studying how consumer demand signals evolved across digital marketplaces. Customer behavior changed substantially during and after the pandemic, with online purchasing becoming an established part of shopping routines across many product categories.
For fitness-oriented products, demand analysis can benefit from examining several signals simultaneously. Review accumulation, for example, provides an observable measure of customer engagement, although it should not be interpreted as an exact sales figure. Similarly, product availability can indicate whether an item remains actively offered, but availability alone does not establish demand.
Price and discount histories provide additional context. A product experiencing frequent promotions may display different review and engagement patterns from a product maintaining stable pricing. Comparing these variables over time can help analysts identify recurring marketplace patterns.
The 2020-2026 period can also be divided into shorter intervals to identify changes around seasonal periods, product launches, promotional events, or category shifts. This makes the analysis more actionable than a simple year-over-year comparison.
Businesses can use these insights to prioritize products for deeper research, assess portfolio changes, and understand how customer engagement evolves over time. The resulting dataset becomes a foundation for demand-oriented marketplace intelligence without relying exclusively on one metric.
A product's marketplace presence depends on more than whether the product is listed. Boldfit digital shelf analytics Amazon India can examine the quality and consistency of a product's visible online presence.
Relevant attributes can include product titles, images, descriptions, specifications, pricing, discount information, ratings, review counts, availability, and seller information. Monitoring these elements over time can reveal changes that may otherwise go unnoticed.
| Digital Shelf Attribute | Monitoring Objective |
|---|---|
| Product title | Listing consistency |
| Images | Visual content monitoring |
| Description | Content completeness |
| Specifications | Attribute visibility |
| Price | Price consistency |
| Discount | Promotion tracking |
| Rating | Customer feedback |
| Reviews | Engagement monitoring |
| Availability | Stock visibility |
Between 2020 and 2026, digital shelf management became increasingly important as consumers relied on marketplace listings to evaluate products before purchase. Product pages became information-rich touchpoints containing images, specifications, customer feedback, pricing, and availability information.
Historical monitoring allows businesses to determine whether these elements remain consistent and complete. For example, a change in product title or specifications may affect how the product is represented to shoppers. Likewise, image changes can alter the visual presentation of a listing.
Digital shelf datasets can also support cross-product comparisons. Businesses can examine whether products within the same portfolio maintain consistent content standards and whether competitor listings use different approaches to communicate product benefits.
Another important application is identifying changes over time. A listing that appears complete during one observation may contain different information later. Recurring collection makes it possible to maintain an audit trail of these changes.
For brands managing a large portfolio, automated monitoring can reduce manual effort. Instead of checking individual product pages repeatedly, analytics systems can capture structured observations and flag meaningful changes. This allows teams to focus their attention on products or attributes requiring investigation.
The final stage is converting collected marketplace information into structured insights. Amazon analytics can combine product, price, review, availability, seller, and competitive information into dashboards and recurring reports.
For Boldfit, Boldfit products analytics on Amazon India can support multiple analytical use cases, including pricing intelligence, product monitoring, competitive research, customer feedback analysis, and digital shelf tracking.
| Analytics Layer | Potential Output |
|---|---|
| Product analytics | Product-level trends |
| Price analytics | Price movement reports |
| Review analytics | Customer feedback trends |
| Competitor analytics | Competitive benchmarks |
| Availability analytics | Stock visibility reports |
| Digital shelf analytics | Listing quality monitoring |
From 2020 to 2026, the role of marketplace data evolved from periodic reporting toward continuous intelligence. Businesses increasingly need historical and recurring data because marketplace conditions can change quickly.
A structured analytics system can bring together information from different observation dates and transform it into trend reports. Instead of viewing individual product pages separately, decisionmakers can see changes in price, ratings, reviews, availability, and competitive activity within a single analytical environment.
Historical data can also support anomaly detection. Significant price changes, sudden availability changes, unusual review growth, or changes in listing content can be flagged for further investigation. This reduces the time required to manually identify marketplace changes.
The same dataset can serve different teams. Pricing teams can analyze price movements, category teams can study assortment, marketing teams can review customer feedback, and e-commerce teams can monitor digital shelf conditions.
By 2026, the ability to maintain clean, structured, historical marketplace datasets can therefore become an important part of e-commerce intelligence workflows. The key is to combine reliable collection with normalization, validation, recurring monitoring, and accessible reporting.
Actowiz Metrics helps businesses convert complex online marketplace information into structured, analytics-ready datasets. Its approach can support recurring collection, data normalization, validation, historical tracking, and customized reporting for e-commerce intelligence requirements.
For brands and retailers, Price & promotion intelligence can provide a structured way to monitor marketplace price changes, discounts, promotional patterns, and competitive movements. Rather than depending on occasional manual checks, businesses can establish recurring data collection processes aligned with their analytical requirements.
The resulting datasets can be used for dashboards, business intelligence platforms, internal analysis, or customized reporting workflows. Businesses can also define the product categories, competitors, attributes, locations, and monitoring frequency that align with their objectives.
A recurring marketplace intelligence framework can help organizations:
Amazon India provides a continuously changing environment where product pricing, promotions, reviews, ratings, availability, sellers, and product content can shift over time. For businesses seeking a comprehensive marketplace view, structured data collection creates the foundation for measuring these changes consistently.
By combining product-level information with historical observations, competitive comparisons, demand signals, and digital shelf monitoring, businesses can develop a more detailed understanding of marketplace activity. The 2020–2026 perspective also demonstrates why historical datasets can be valuable for identifying long-term changes rather than relying only on current marketplace snapshots.
For brands operating in competitive e-commerce categories, Boldfit products analytics on Amazon India can serve as a framework for examining product trends, pricing behavior, customer engagement, and marketplace visibility through structured data.
Explore Actowiz Metrics to build customized Amazon India product, pricing, competitor, and digital shelf datasets for smarter e-commerce intelligence!
Expert blogs, research reports and infographics — practical, data-driven reading across e-commerce and quick-commerce.
Most fields are optional — the more you share, the better your sample.
.webp "infographics")
.webp "infographics")