BLOG


The food delivery industry in the United Arab Emirates (UAE) and the Kingdom of Saudi Arabia (KSA) has experienced significant transformation between 2020 and 2026. Changing consumer lifestyles, increasing smartphone adoption, digital payments, restaurant partnerships, and demand for convenient ordering have accelerated the development of online food delivery platforms. This UAE & KSA Food Delivery Market Intelligence report examines market growth, platform competition, pricing strategies, promotional activity, restaurant availability, and consumer ordering behavior. By applying Food & beverage analytics, businesses can turn marketplace data into actionable insights, identify changing customer preferences, benchmark competitors, and uncover opportunities for sustainable growth.
Talabat, Noon Food, and Careem Food have become important participants in the UAE's competitive delivery landscape, while Saudi Arabia also has strong local and regional platforms, including HungerStation and Jahez. Market conditions differ between the two countries, making country-specific analysis essential. The UAE has a concentrated, highly competitive digital marketplace, whereas Saudi Arabia's large geographic footprint and regional differences create additional opportunities for localized services, restaurant expansion, and delivery optimization.
The 2020–2026 period illustrates how food delivery evolved from a pandemic-era necessity into an established part of everyday consumption. Companies that consistently monitor menu data, final checkout prices, promotions, customer demand, and competitive positioning can make better-informed decisions about marketing, expansion, and customer retention.
The food delivery market in the UAE and Saudi Arabia is shaped by platform reach, restaurant partnerships, service reliability, product variety, and customer loyalty. Talabat vs Noon Food vs Careem Platform Performance Comparison helps businesses evaluate how platforms compete across locations, restaurant categories, customer segments, and ordering occasions.
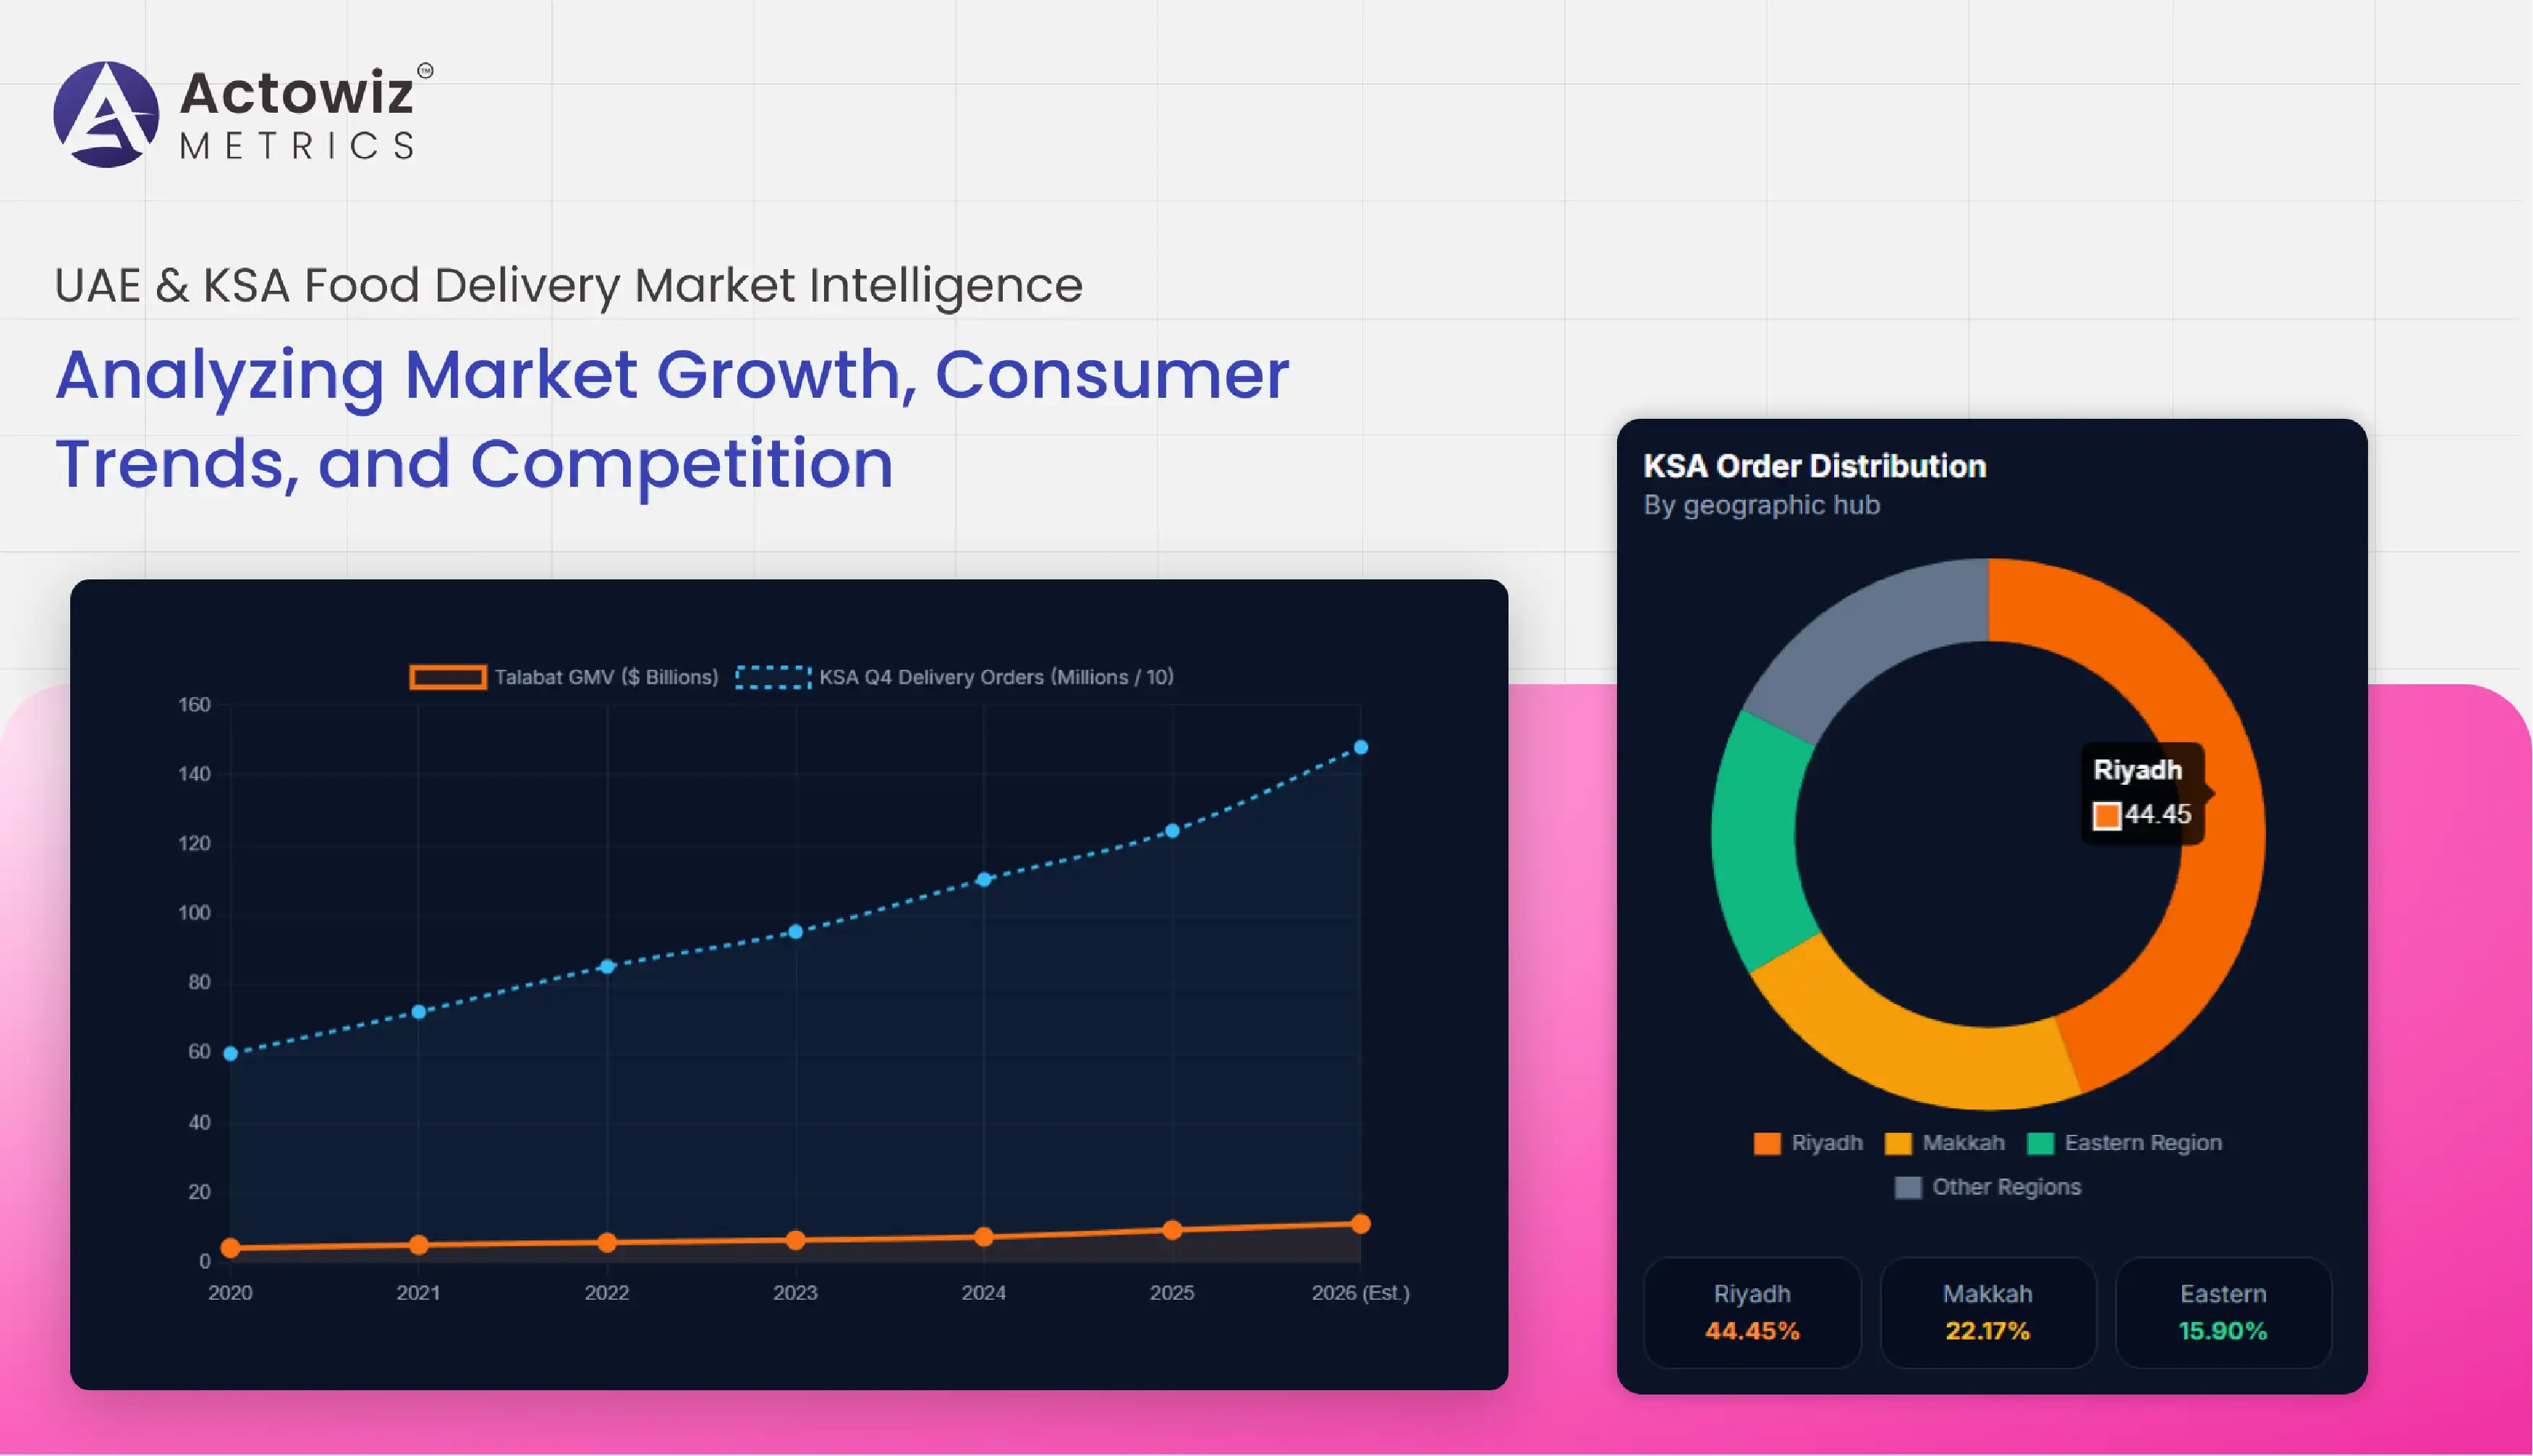
Talabat has a substantial regional presence, supported by its food ordering marketplace and grocery and retail operations. In 2024, Talabat reported annual gross merchandise value (GMV) of approximately $7.4 billion, representing 23% year-on-year growth. Its monthly active customers increased 25%, while average order frequency among active customers rose 8%. These figures cover Talabat's broader operating footprint, not just the UAE and Saudi Arabia. Source: Talabat's 2024 results.
| Period | Market Development | Competitive Implication |
|---|---|---|
| 2020 | Pandemic accelerated digital food ordering | Platforms strengthened digital access |
| 2021 | Restaurant delivery became more established | Restaurant coverage gained importance |
| 2022 | Loyalty and subscription models expanded | Retention became a strategic priority |
| 2023 | Digital ordering continued to mature | Platforms focused on order frequency |
| 2024 | Talabat reported $7.4 billion in GMV | Regional marketplace scale increased |
| 2025 | Talabat reported $9.4 billion in GMV, up 27% | Competitive pressure continued |
| 2026 | Competition increasingly includes wider convenience services | Data-driven benchmarking supports expansion |
Talabat's 2025 annual results reported $9.4 billion in GMV and $3.9 billion in revenue, up 27% and 31%, respectively. These figures provide a useful indicator of the company's overall scale, although they should not be treated as UAE- or KSA-only results. Source: Talabat's 2025 annual report.
From 2020 through 2026, competitive analysis has become more complex than simply counting available restaurants. Businesses must compare coverage, estimated delivery times, ratings, order minimums, customer offers, and product assortment. Noon Food's connection to a broader digital commerce ecosystem and Careem's integrated consumer services also create different competitive propositions.
For brands, a structured platform comparison can identify where restaurant visibility is stronger, which categories are underserved, and where a marketplace provides a more attractive route to customers. Separate UAE and Saudi Arabia datasets help prevent regional averages from hiding important differences in consumer behavior and platform availability.
Consumers compare more than advertised menu prices when choosing a food delivery service. Delivery charges, service fees, minimum order values, discounts, subscription benefits, and restaurant-specific markups can all affect the final bill. UAE & KSA Food Delivery Pricing and Fee Benchmarking enables businesses to evaluate these elements across platforms, restaurant categories, cities, and order values.
| Year | Pricing Environment | Analytical Focus |
|---|---|---|
| 2020 | Delivery adoption accelerated | Establish baseline menu and delivery prices |
| 2021 | Customer acquisition promotions remained important | Compare discounts and free-delivery offers |
| 2022 | Cost pressures affected food-service operators | Monitor price changes and order minimums |
| 2023 | Membership programs gained importance | Evaluate subscription value |
| 2024 | Digital marketplaces expanded monetization | Compare fee structures and promotional pricing |
| 2025 | Consumers remained attentive to value | Measure final checkout costs |
| 2026 | Competition increasingly spans food and convenience | Track prices across broader baskets |
A useful pricing dataset should record the original menu price, discounted price, delivery charge, service fee, minimum spend, applicable membership benefits, and final checkout total when available. It should also capture the restaurant location, time of collection, delivery zone, and relevant order conditions so that comparisons remain consistent.
The difference between an advertised discount and genuine customer savings is particularly important. A promotional offer may reduce an item's price but require a minimum spend, exclude certain restaurants, or apply only to selected users. Without these conditions, businesses may overestimate the strength of a competitor's pricing strategy.
Between 2020 and 2026, pricing analysis evolved toward measuring the complete customer purchase experience. Restaurant operators can use the resulting insights to review their platform pricing, understand the competitiveness of meal bundles, and evaluate the effect of promotions on affordability.
The same analysis can support comparisons between the UAE and Saudi Arabia, provided that local currencies, taxes, fees, and collection conditions are handled appropriately. Actowiz Metrics can help businesses organize recurring price observations into consistent datasets that support historical comparisons, pricing dashboards, and commercial decisions.
Restaurant menus are dynamic digital assets. Items can be added, removed, renamed, repriced, discounted, or marked unavailable according to location, time, and restaurant operations. Talabat, Noon Food & Careem Restaurant Menu Intelligence helps businesses examine these changes and understand how menu presentation affects marketplace competition.
| Year | Menu and Assortment Development | Business Opportunity |
|---|---|---|
| 2020 | Restaurants expanded online menus | Establish digital product visibility |
| 2021 | Online ordering became more familiar | Compare restaurant assortments |
| 2022 | Bundles and meal deals remained relevant | Analyze value-based menu design |
| 2023 | Grocery and convenience categories grew | Extend assortment monitoring |
| 2024 | Platform ecosystems broadened | Compare products across categories |
| 2025 | Competition continued to intensify | Monitor menu changes consistently |
| 2026 | Personalization and digital discovery evolve | Improve category-level intelligence |
A structured menu dataset may include restaurant names, branch identifiers, cuisine categories, item names, descriptions, sizes, add-ons, meal combinations, listed prices, ratings, promotional labels, and availability indicators. Collecting these fields in a consistent format makes it easier to compare equivalent products across platforms.
For example, a burger brand may offer different meal combinations on two applications. One listing may include a side and drink, while another may offer a discounted standalone item. A comparison based only on the headline price would miss the difference in product composition and perceived value.
Menu monitoring also helps identify missing items, inconsistent descriptions, and variations between branches. These insights can be particularly valuable for restaurant groups that operate across multiple cities or use different delivery partners.
From 2020 to 2026, online menus increasingly became a source of commercial intelligence rather than merely a digital version of a printed menu. Historical snapshots allow businesses to examine product introductions, menu rationalization, price changes, and seasonal availability.
By combining menu records with ratings, promotions, and delivery information, companies can investigate how assortment and presentation relate to competitive visibility. This creates a more complete view of marketplace positioning and supports informed decisions about menu optimization and restaurant partnerships.
Promotions are a major competitive lever in digital food ordering. Percentage discounts, fixed-value coupons, free-delivery offers, loyalty rewards, meal bundles, and limited-time deals can attract new customers and encourage repeat purchases. UAE & KSA Food Delivery Promotions and Discount Analysis helps businesses understand the frequency, structure, and apparent value of offers across competing platforms.
| Year | Promotional Trend | Key Measurement |
|---|---|---|
| 2020 | Adoption-focused offers expanded | Track introductory discounts |
| 2021 | Promotions supported continued engagement | Compare offer frequency |
| 2022 | Value messaging became more important | Measure discount depth |
| 2023 | Loyalty and subscription benefits grew | Compare member and non-member offers |
| 2024 | Marketplace advertising expanded | Monitor sponsored visibility |
| 2025 | Competition emphasized customer value | Compare promotional consistency |
| 2026 | Targeted offers and personalization continue to evolve | Track offer eligibility and duration |
A comprehensive promotional dataset should capture the discount amount, percentage reduction, minimum order value, start and end dates, eligible products, restaurant participation, coupon conditions, and any delivery-related benefit. These details help businesses distinguish between broadly available offers and restricted promotions.
For example, a 30% discount may appear more attractive than a fixed AED 10 or SAR 10 reduction, but the actual savings depend on the eligible order value and maximum discount cap. Free delivery may also be more valuable to a customer placing a small order than a discount that requires a substantially larger basket.
The UAE and Saudi Arabia should be examined separately because platform availability, purchasing patterns, currencies, restaurant participation, and local promotional calendars differ. Ramadan, Eid, weekends, public holidays, and major shopping periods may also affect promotional activity and demand.
From 2020 to 2026, businesses increasingly needed to understand the conditions behind each offer, rather than simply counting discounts. Historical comparisons can identify recurring campaigns, changes in promotional intensity, and opportunities to improve the value proposition.
Actowiz Metrics can help organizations build structured promotional datasets and compare offers over time. When these records are combined with menu prices and restaurant availability, companies can assess whether an apparent discount reflects a meaningful change in customer value or a short-lived marketing tactic.
Consumer demand varies according to location, time of day, cuisine, affordability, weather, cultural occasions, and convenience. Talabat, Noon Food & Careem Customer Demand and Ordering Trends supports research into these differences and helps businesses understand when and where specific products or restaurant categories receive greater marketplace visibility.
| Year | Demand Development | Intelligence Opportunity |
|---|---|---|
| 2020 | Pandemic restrictions increased delivery reliance | Establish category baselines |
| 2021 | Digital ordering remained established | Compare repeat-order behavior |
| 2022 | Convenience and loyalty gained importance | Examine recurring demand |
| 2023 | Grocery and retail delivery broadened | Monitor cross-category interest |
| 2024 | Talabat reported 25% growth in monthly active customers | Assess platform engagement |
| 2025 | Talabat reported 27% GMV growth | Track regional business expansion |
| 2026 | Consumer expectations continue to evolve | Analyze location and category differences |
Talabat's reported 2024 increase in monthly active customers and average order frequency indicates that both customer acquisition and repeat engagement contributed to its overall growth. However, those figures represent the company's broader operations and should not be interpreted as direct measures of demand in either country alone.
Demand analysis can combine observable signals such as restaurant availability, menu changes, ratings, reviews, listed promotions, and category representation. If businesses have access to their own transaction data, these marketplace observations can be compared with actual orders to understand the relationship between competitive conditions and sales performance.
In the UAE, analysis may distinguish between dense urban delivery zones, residential communities, business districts, and tourism-focused areas. In Saudi Arabia, differences among Riyadh, Jeddah, Dammam, Makkah, and Madinah can make geographic segmentation particularly important. Seasonality also matters. Ramadan and Eid can change ordering schedules, meal preferences, and promotional activity. Weekend behavior and summer travel patterns may further affect demand across particular locations.
Between 2020 and 2026, the opportunity shifted toward understanding not only whether the market was growing, but also which categories, occasions, and locations were contributing to that growth. Structured datasets help businesses identify patterns, compare time periods, and refine assortment, marketing, and restaurant expansion strategies.
The food delivery market in the UAE and Saudi Arabia is increasingly connected to broader digital commerce, including groceries, convenience products, loyalty programs, restaurant advertising, and faster local fulfillment. UAE & KSA Food Delivery Market Trends and Competitive Intelligence helps organizations monitor these developments and assess how competitors adapt to evolving consumer expectations.
| Year | Broader Market Trend | Strategic Priority |
|---|---|---|
| 2020 | Digital delivery adoption accelerated | Build marketplace visibility |
| 2021 | Restaurant networks expanded | Strengthen digital distribution |
| 2022 | Subscription models gained traction | Improve customer retention |
| 2023 | Adjacent delivery categories developed | Explore cross-category opportunities |
| 2024 | Talabat's reported GMV reached $7.4 billion | Benchmark platform scale |
| 2025 | Talabat's reported GMV reached $9.4 billion | Assess ongoing competitive growth |
| 2026 | Competition increasingly spans convenience and retail | Develop broader market intelligence |
Saudi Arabia's delivery sector provides a clear example of continuing digital expansion. According to Saudi Arabia's Transport General Authority, the country recorded more than 124 million delivery-sector orders in the fourth quarter of 2025, a 60% increase compared with the same quarter in 2024. Riyadh accounted for 44.45% of those orders, Makkah for 22.17%, and the Eastern Region for 15.9%. These figures cover the reported delivery sector and are not exclusively food-delivery orders. Source: Saudi Press Agency, January 2026.
The figures underline the importance of geographic analysis and careful interpretation of market statistics. Delivery-sector growth can indicate expanding digital logistics activity, but businesses should not assume that all recorded orders relate to restaurant meals or that growth is distributed evenly across platforms.
From 2020 to 2026, the competitive landscape has increasingly rewarded companies that combine strong marketplace presence with reliable fulfillment, relevant product selection, and customer value. Restaurant operators need to understand how their digital storefronts compare with competitors, while food brands need visibility into category assortment, pricing, promotions, and local demand.
For researchers and commercial teams, a structured intelligence program can track platform changes, new restaurant partnerships, evolving menu categories, customer-facing fees, and promotional strategies. Consistent collection and historical records help separate short-term fluctuations from longer-term developments.
The strongest approach is to build separate country-level datasets first, then compare the UAE and KSA using consistent metrics. This enables businesses to identify shared trends while preserving the local differences that influence customer decisions and operational performance.
Actowiz Metrics helps businesses transform publicly available food delivery marketplace information into structured datasets that support market research, competitive benchmarking, pricing analysis, and strategic planning. For organizations operating across the UAE and Saudi Arabia, consistent data collection can provide a clearer picture of restaurant availability, menu positioning, promotional activity, and competitive changes.
Key capabilities include:
For organizations investigating quick-commerce and convenience-led food purchasing, Careem Quik Bestselling Brands Analytics can form part of a broader research framework examining visible product assortments, brand presence, prices, and availability where relevant data is accessible. Such analysis can help businesses understand how convenience-oriented offerings relate to traditional restaurant delivery.
Actowiz Metrics emphasizes the importance of reliable collection schedules, consistent data structures, and clearly defined metrics. These practices allow organizations to develop repeatable research processes rather than relying exclusively on occasional manual observations.
By combining marketplace monitoring with structured analytical workflows, businesses can support pricing decisions, competitor reviews, restaurant expansion assessments, and marketing planning with more consistent evidence.
The UAE and Saudi Arabian food delivery markets have developed considerably between 2020 and 2026. Growing digital adoption, platform competition, subscription programs, promotional campaigns, and expanding convenience services have created new opportunities for restaurants, food brands, and market researchers. At the same time, differences in geography, consumer preferences, local competition, and platform availability mean that each market requires careful, country-specific analysis.
Talabat, Noon Food, and Careem Food provide important comparison points for understanding platform performance in the UAE, while Saudi Arabia's broader delivery ecosystem requires additional attention to local competitors and regional demand. Publicly reported business results and delivery-sector statistics demonstrate the scale of digital commerce, but accurate research must distinguish company-wide figures from country-specific and food-only measurements.
Businesses can use Competitor intelligence to examine pricing, restaurant availability, menu changes, promotions, and competitive positioning systematically. Combining these insights with historical monitoring can help identify emerging opportunities, evaluate marketplace strategies, and improve commercial decision-making.
Actowiz Metrics can support this process by helping businesses build structured datasets that reveal how food delivery platforms, restaurant assortments, and customer-facing offers evolve over time. A consistent data strategy can help organizations respond more effectively to market changes and develop stronger competitive insights.
Partner with Actowiz Metrics to collect, analyze, and benchmark food delivery marketplace data across the UAE and Saudi Arabia, turning changing market signals into actionable business intelligence!
Expert blogs, research reports and infographics — practical, data-driven reading across e-commerce and quick-commerce.
Most fields are optional — the more you share, the better your sample.
.webp "infographics")
.webp "infographics")