BLOG
HALLOWEEN SPECIAL OFFER
Data Analytics & Intelligence Solutions
Turn Data into Smarter Business Decisions!
Offer Terms & Conditions Apply


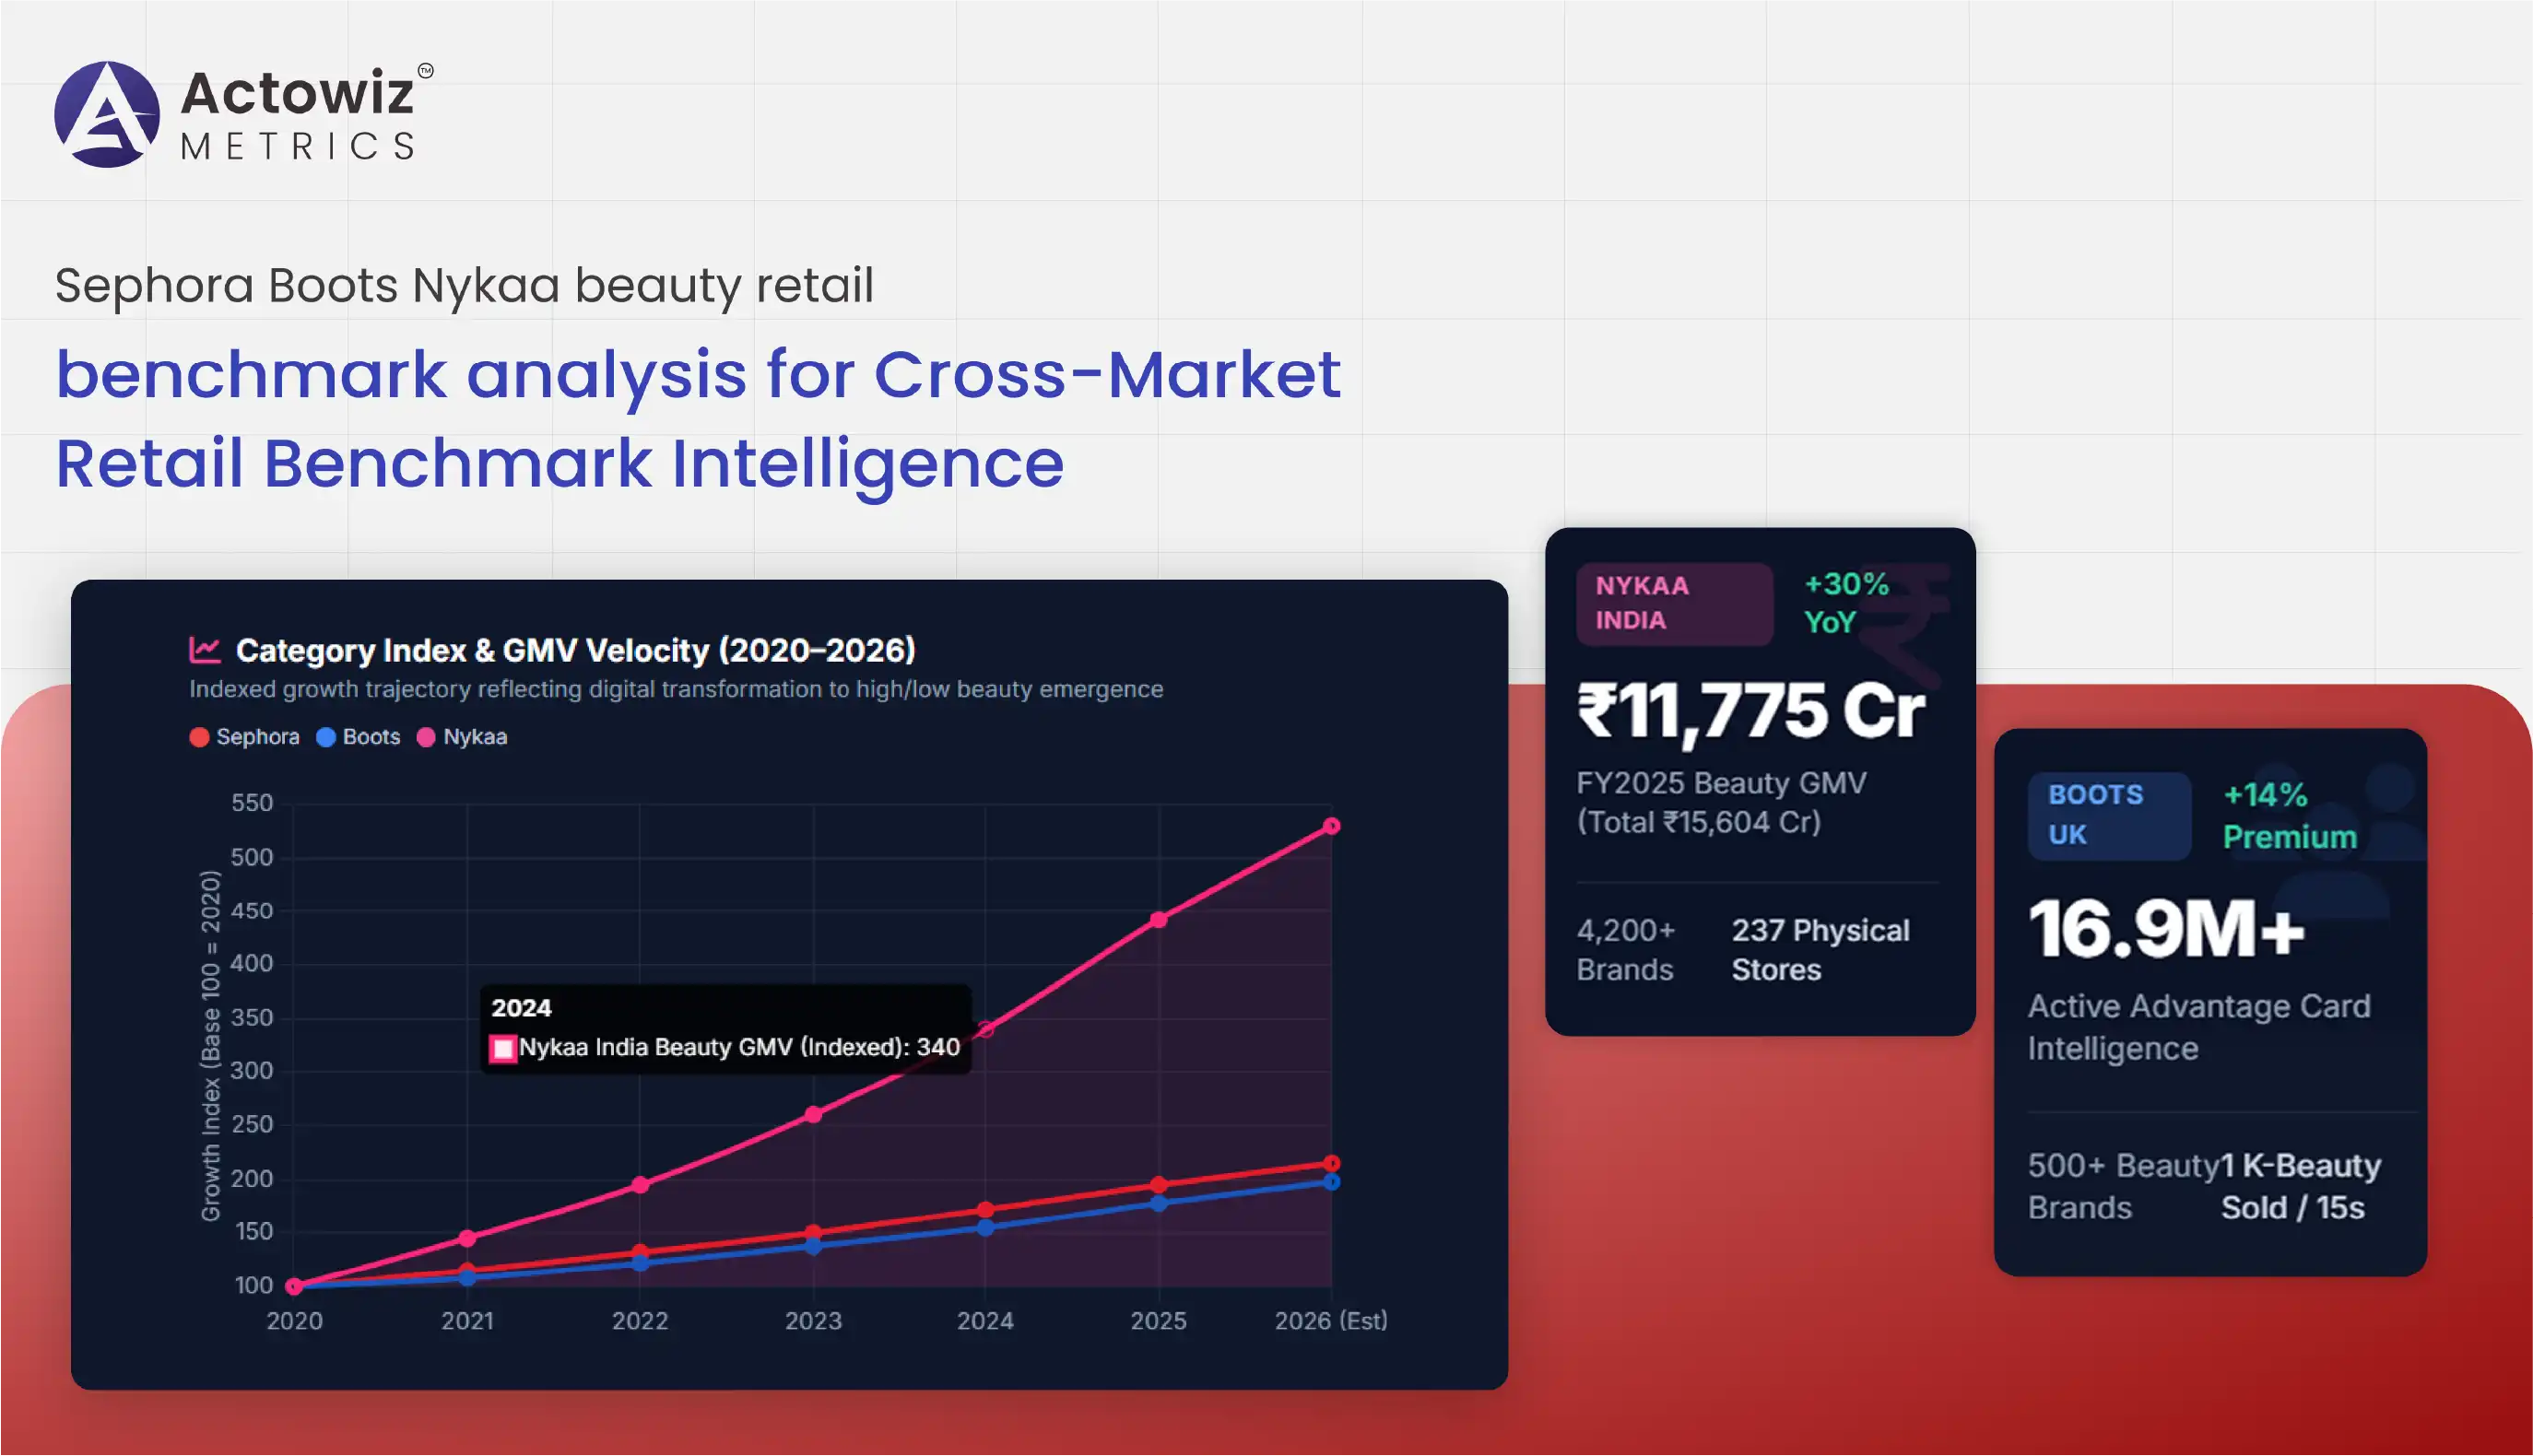
The global beauty and personal care industry is becoming increasingly competitive as consumers compare products, prices, ingredients, promotions, reviews, and brand availability across multiple retail channels. Sephora, Boots, and Nykaa represent three valuable reference points across different retail environments, making cross-market benchmarking useful for brands seeking to understand assortment strategies, pricing positions, promotional activity, and category-level opportunities. Sephora Boots Nykaa beauty retail benchmark analysis enables businesses to compare these retail ecosystems using structured product, pricing, availability, and category data.
At the same time, Beauty & personal care analytics allows brands to move beyond basic price comparisons by analyzing product assortments, brand presence, discounts, customer ratings, category penetration, and digital shelf visibility. Nykaa reported FY2025 beauty GMV of ₹11,775 crore, up 30% year over year, with more than 4,200 beauty and personal-care brands available as of March 31, 2025. Boots reported more than 500 beauty brands across price points as of February 2026, while its 2025 trend analysis used data from more than 16.9 million active Advantage Card customers.
For Actowiz Metrics, structured retail data collection creates a consistent foundation for comparing products, prices, promotions, categories, and brand visibility across these distinct markets.
Cross-market beauty retail Benchmark analytics helps businesses evaluate how beauty retailers position brands and products across different geographies. Combined with Sephora Boots Nykaa beauty retail benchmark analysis, this approach can reveal pricing gaps, assortment differences, promotional intensity, brand availability, and category opportunities.
| Retailer | Market Focus | Key Beauty Intelligence |
|---|---|---|
| Sephora | Global prestige beauty | Premium brands, skincare, makeup, fragrance |
| Boots | UK health & beauty | Mass, premium, pharmacy-led beauty |
| Nykaa | India beauty & personal care | Large digital assortment and omnichannel retail |
| Nykaa FY2025 beauty GMV | India | ₹11,775 crore |
| Nykaa FY2025 beauty brands | India | 4,200+ |
| Boots beauty brands | UK | 500+ |
Nykaa's FY2025 beauty business recorded 30% GMV growth, while its physical network expanded to 237 stores across 79 cities. Boots states that it offers more than 500 beauty brands across price points.
Between 2020 and 2021, beauty retail underwent a significant shift toward digital discovery and e-commerce purchasing. Consumers increasingly researched ingredients, product reviews, routines, and prices online before purchasing. This created a stronger requirement for retailers and brands to maintain accurate digital product information.
In 2022, beauty retailers increasingly blended online and offline experiences. Product launches, influencer marketing, social commerce, and digital-exclusive assortments became important sources of differentiation. Sephora's prestige-oriented model and Boots' broad health-and-beauty proposition provided different approaches to capturing consumer demand.
By 2023, cross-market comparisons became increasingly valuable because global beauty brands could enter multiple markets with different pricing, packaging, assortment, and promotional strategies. In 2024, consumers increasingly mixed premium and affordable products, making price architecture and assortment depth important competitive variables.
During 2025, Boots highlighted a "High/Low Beauty" trend, reporting that more than a third of Advantage Card members had purchased both budget-friendly makeup and premium cosmetics in 2024. Nykaa simultaneously expanded its assortment and physical presence, reinforcing India's rapidly developing beauty retail ecosystem.
In 2026, cross-market benchmarking is becoming more data-driven. Brands can compare equivalent products across currencies, pack sizes, categories, discount structures, and retailer positioning. Such intelligence can support market-entry decisions, pricing strategy, assortment planning, and competitive positioning.
Beauty Retail Product Assortment Comparison provides businesses with a structured method for examining what each retailer sells and how extensively it covers specific beauty categories. Instead of simply counting products, businesses can analyze brands, SKUs, shades, sizes, ingredients, product formats, price tiers, and availability.
| Attribute | Benchmark Application |
|---|---|
| Brand count | Measure portfolio depth |
| SKU count | Assess assortment breadth |
| Category coverage | Identify portfolio gaps |
| Price tier | Compare value and premium positioning |
| Pack size | Normalize comparable products |
| Product format | Compare consumer choices |
| Shade availability | Measure makeup depth |
| New product launches | Track innovation |
| Availability | Monitor supply consistency |
In 2020, assortment visibility became particularly important as consumers shifted from physical store browsing toward online product discovery. Retailers needed comprehensive digital catalogs covering product descriptions, images, ingredients, prices, and availability.
During 2021, brands increasingly expanded their digital assortment to compensate for changing store traffic. New skincare, haircare, wellness, and cosmetics products entered online catalogs at a faster pace. In 2022, international beauty trends such as K-beauty, active ingredients, and specialized skincare formats influenced assortment decisions.
In 2023, retailers increasingly differentiated themselves through exclusive brands, private labels, curated collections, and premium product ranges. Assortment benchmarking helped identify which retailers offered particular brands or product categories and where competitive gaps existed.
By 2024, premium and value beauty increasingly coexisted within the same consumer journey. Boots' research found that more than a third of its Advantage Card members had bought both budget-friendly makeup and premium cosmetics, demonstrating the importance of broad price-tier coverage.
In 2025, assortment expansion remained a major strategic priority. Nykaa reported more than 4,200 beauty and personal-care brands and 237 physical stores, while Boots reported more than 500 beauty brands.
By 2026, assortment intelligence can help brands identify whitespace opportunities by comparing category depth across markets. A product available in one market but absent from another may represent an opportunity for localization, distribution expansion, or marketplace entry.
Sephora Beauty Products Data Analytics Across Categories can help brands examine product-level patterns across skincare, makeup, fragrance, haircare, bodycare, and related categories. When connected with Sephora Boots Nykaa beauty retail benchmark analysis, the resulting dataset can support more detailed cross-market comparisons.
The 2020-2021 period accelerated digital beauty research, with consumers becoming more dependent on product descriptions, reviews, tutorials, ingredient information, and online recommendations. Product-level data became more important because consumers could not always experience products physically before purchasing.
In 2022, ingredient-led skincare became increasingly prominent. Products featuring retinol, niacinamide, hyaluronic acid, AHAs, BHAs, vitamin C, and barrier-supporting ingredients became important signals for understanding category demand.
During 2023, social media accelerated product discovery. Viral beauty products could experience sudden demand increases, requiring retailers to react quickly to emerging trends. In 2024, product analytics expanded to include price elasticity, promotional timing, review sentiment, and assortment positioning.
Boots' 2025 beauty research provides a useful example of the granularity available from retail data. The retailer reported that searches for marine collagen increased 227% year over year and collagen sales increased 62%. It also reported that searches for glycolic acid rose 64% year over year.
In 2025, Boots also reported that one K-beauty product sold every 15 seconds, illustrating the scale at which emerging product trends can become commercially significant.
By 2026, product-level intelligence can connect product attributes with competitive pricing, ratings, reviews, availability, and promotional activity. This allows brands to determine not just which products exist, but how they are positioned and how their market presence changes over time.
Boots beauty product price tracking enables brands to monitor pricing movements across categories, brands, pack sizes, and promotional periods. Price intelligence is particularly important in beauty because consumers often compare multiple retailers before purchasing familiar products.
| Metric | Purpose |
|---|---|
| Listed price | Establish price benchmark |
| Promotional price | Measure discount impact |
| Discount percentage | Evaluate promotion depth |
| Pack size | Normalize comparisons |
| Price per unit | Compare true value |
| Brand price tier | Map positioning |
| Price changes | Identify volatility |
During 2020, price monitoring became more important as supply constraints and changing consumer demand affected product availability and promotional behavior. By 2021, retailers increasingly used online promotions, bundles, loyalty offers, and digital campaigns to stimulate demand.
In 2022, inflation and supply-chain pressures increased the importance of tracking price changes. Brands needed to distinguish between genuine price increases and temporary promotions. In 2023, beauty consumers became increasingly comfortable comparing products across retailers, creating greater pressure for consistent pricing strategies.
During 2024, the coexistence of premium and affordable products became particularly important. Boots reported that 48% of customers believed in investing in more expensive beauty products for better results, while price was identified as the number-one reason consumers switched beauty brands.
In 2025, Boots continued to demonstrate the importance of price-tier diversity. Its research highlighted simultaneous demand for luxury products and affordable alternatives, while premium beauty sales increased 14% year over year in the cited 2024 data.
By 2026, price tracking can support automated competitive dashboards that compare standard prices, promotional prices, discounts, product sizes, and effective unit prices. Historical datasets can reveal recurring promotional cycles and identify whether a competitor is consistently underpricing or only temporarily discounting selected products.
For beauty brands, this level of monitoring can support pricing decisions, promotional planning, retailer negotiations, and market-entry strategies.
Nykara competitor analysis for beauty brands helps businesses evaluate product visibility, assortment, pricing, brand presence, promotions, and customer engagement within India's fast-growing beauty market. Combined with Sephora Boots Nykara beauty retail benchmark analysis, it enables brands to connect Indian marketplace behavior with broader international retail benchmarks.
| KPI | Business Application |
|---|---|
| Brand presence | Measure retailer reach |
| SKU count | Assess assortment |
| Average price | Compare positioning |
| Discount rate | Track promotions |
| Rating | Assess customer response |
| Review count | Measure engagement |
| Store count | Evaluate physical reach |
| Category share | Identify opportunities |
In 2020, India's beauty market experienced a major transition toward digital purchasing. Online discovery became critical, while consumers increasingly researched product reviews, ingredients, prices, and recommendations before buying.
2021 and 2022, beauty e-commerce expanded its role in product discovery and brand distribution. Nykaa's combination of digital commerce, physical stores, brand partnerships, and owned brands strengthened its position within India's beauty ecosystem.
During 2023, international and domestic beauty brands increasingly competed for digital visibility. Social-media-led discovery, influencer campaigns, D2C brands, and premium skincare created a more fragmented competitive environment.
In 2024, retailers increasingly focused on omnichannel strategies and broader product portfolios. By FY2025, Nykaa reported 25% consolidated GMV growth to ₹15,604 crore, while beauty GMV grew 30% to ₹11,775 crore. It also reported more than 4,200 beauty and personal-care brands and 237 physical stores across 79 cities.
The same FY2025 reporting period showed House of Nykaa beauty brands generating approximately ₹1,695 crore in GMV, representing 14.4% of beauty GMV.
By 2026, competitive analysis increasingly requires SKU-level and brand-level monitoring. Brands can compare their own presence against competitors across product availability, price points, ratings, reviews, promotions, and categories. This can identify assortment gaps and help brands determine where their digital shelf position needs improvement.
Sephora Beauty Products Data Analytics Across Categories allows businesses to evaluate how different beauty segments behave across retailers and markets. Category-level intelligence can cover skincare, makeup, fragrance, haircare, bodycare, wellness, men's grooming, and emerging beauty formats.
From 2020 to 2021, skincare became increasingly important as consumers developed more sophisticated at-home routines. During 2022, active ingredients and specialized products expanded category depth. In 2023, makeup and fragrance regained momentum as consumers returned to social and professional activities while continuing to shop digitally.
In 2024, beauty categories became increasingly interconnected with wellness. Consumers began looking at beauty through a broader health and lifestyle lens, creating opportunities for supplements, collagen, sleep-related products, fragrance, and holistic skincare.
Boots' 2025 data illustrates this convergence. It identified collagen, adaptogens, science-backed skincare, K-beauty, exfoliants, and mood-enhancing fragrances among important trends. The retailer reported a 722% year-over-year increase in searches for ashwagandha and a 227% increase in marine-collagen searches.
In 2025, K-beauty also became a major commercial category at Boots, with the retailer reporting one K-beauty product sold every 15 seconds.
Nykaa's FY2025 performance similarly demonstrates the scale of India's category opportunity, with beauty GMV reaching ₹11,775 crore and more than 4,200 brands across beauty and personal care.
By 2026, category analytics can help businesses identify which segments are expanding, where premiumization is occurring, and which emerging trends are moving from niche interest to mainstream demand. Cross-category datasets also allow brands to evaluate whether pricing, promotions, assortment, and product innovation are aligned with consumer demand.
Skincare Brand Digital Shelf Analytics on Boots can provide brands with structured visibility into how their products appear, compete, and change across a major beauty retail environment. Actowiz Metrics combines scalable data collection, normalization, validation, historical monitoring, and analytics-ready delivery to support retail intelligence programs.
For businesses conducting Sephora Boots Nykaa beauty retail benchmark analysis, the ability to standardize data across different retailers is particularly valuable. Retailer catalogs often use different product names, pack sizes, categories, promotional structures, and product attributes. A normalized dataset can make these differences easier to compare.
Actowiz Metrics can support:
The solution can also support recurring monitoring schedules. Instead of relying on one-time snapshots, businesses can build historical datasets that reveal how products, prices, availability, and competitor positioning evolve over weeks, months, and years.
This is especially valuable for brands expanding internationally. A product may occupy a premium position in one country while competing at a different price tier elsewhere. Comparing price-per-unit, pack sizes, promotions, and category positioning helps businesses make more informed decisions about localization and channel strategy.
The beauty retail landscape from 2020 through 2026 demonstrates how rapidly product discovery, pricing, assortment, and consumer behavior have evolved. Retailers are competing not only on the number of products they carry but also on brand exclusivity, price positioning, digital visibility, customer experience, promotions, and the speed at which they respond to emerging trends.
Nykaa Beauty Product Data Analysis can help businesses understand India's beauty marketplace by examining product availability, pricing, brands, categories, discounts, and customer engagement. When integrated with Sephora Boots Nykaa beauty retail benchmark analysis, this intelligence creates a broader framework for comparing international and regional beauty retail strategies.
The available market signals demonstrate the scale and diversity of the opportunity. Nykaa's FY2025 beauty GMV reached ₹11,775 crore, with more than 4,200 beauty and personal-care brands and 237 physical stores. Boots reported more than 500 beauty brands and highlighted rapidly developing categories such as K-beauty, collagen, adaptogens, science-backed skincare, and fragrance.
For brands, retailers, manufacturers, investors, and market researchers, continuous retail intelligence can reveal where pricing gaps exist, which categories are growing, which competitors are expanding, and where digital shelf opportunities remain.
Partner with Actowiz Metrics to build scalable beauty retail datasets and transform product, pricing, assortment, and competitor data into actionable cross-market retail intelligence!
Expert blogs, research reports and infographics — practical, data-driven reading across e-commerce and quick-commerce.
Most fields are optional — the more you share, the better your sample.

.webp "infographics")
.webp "infographics")