BLOG




















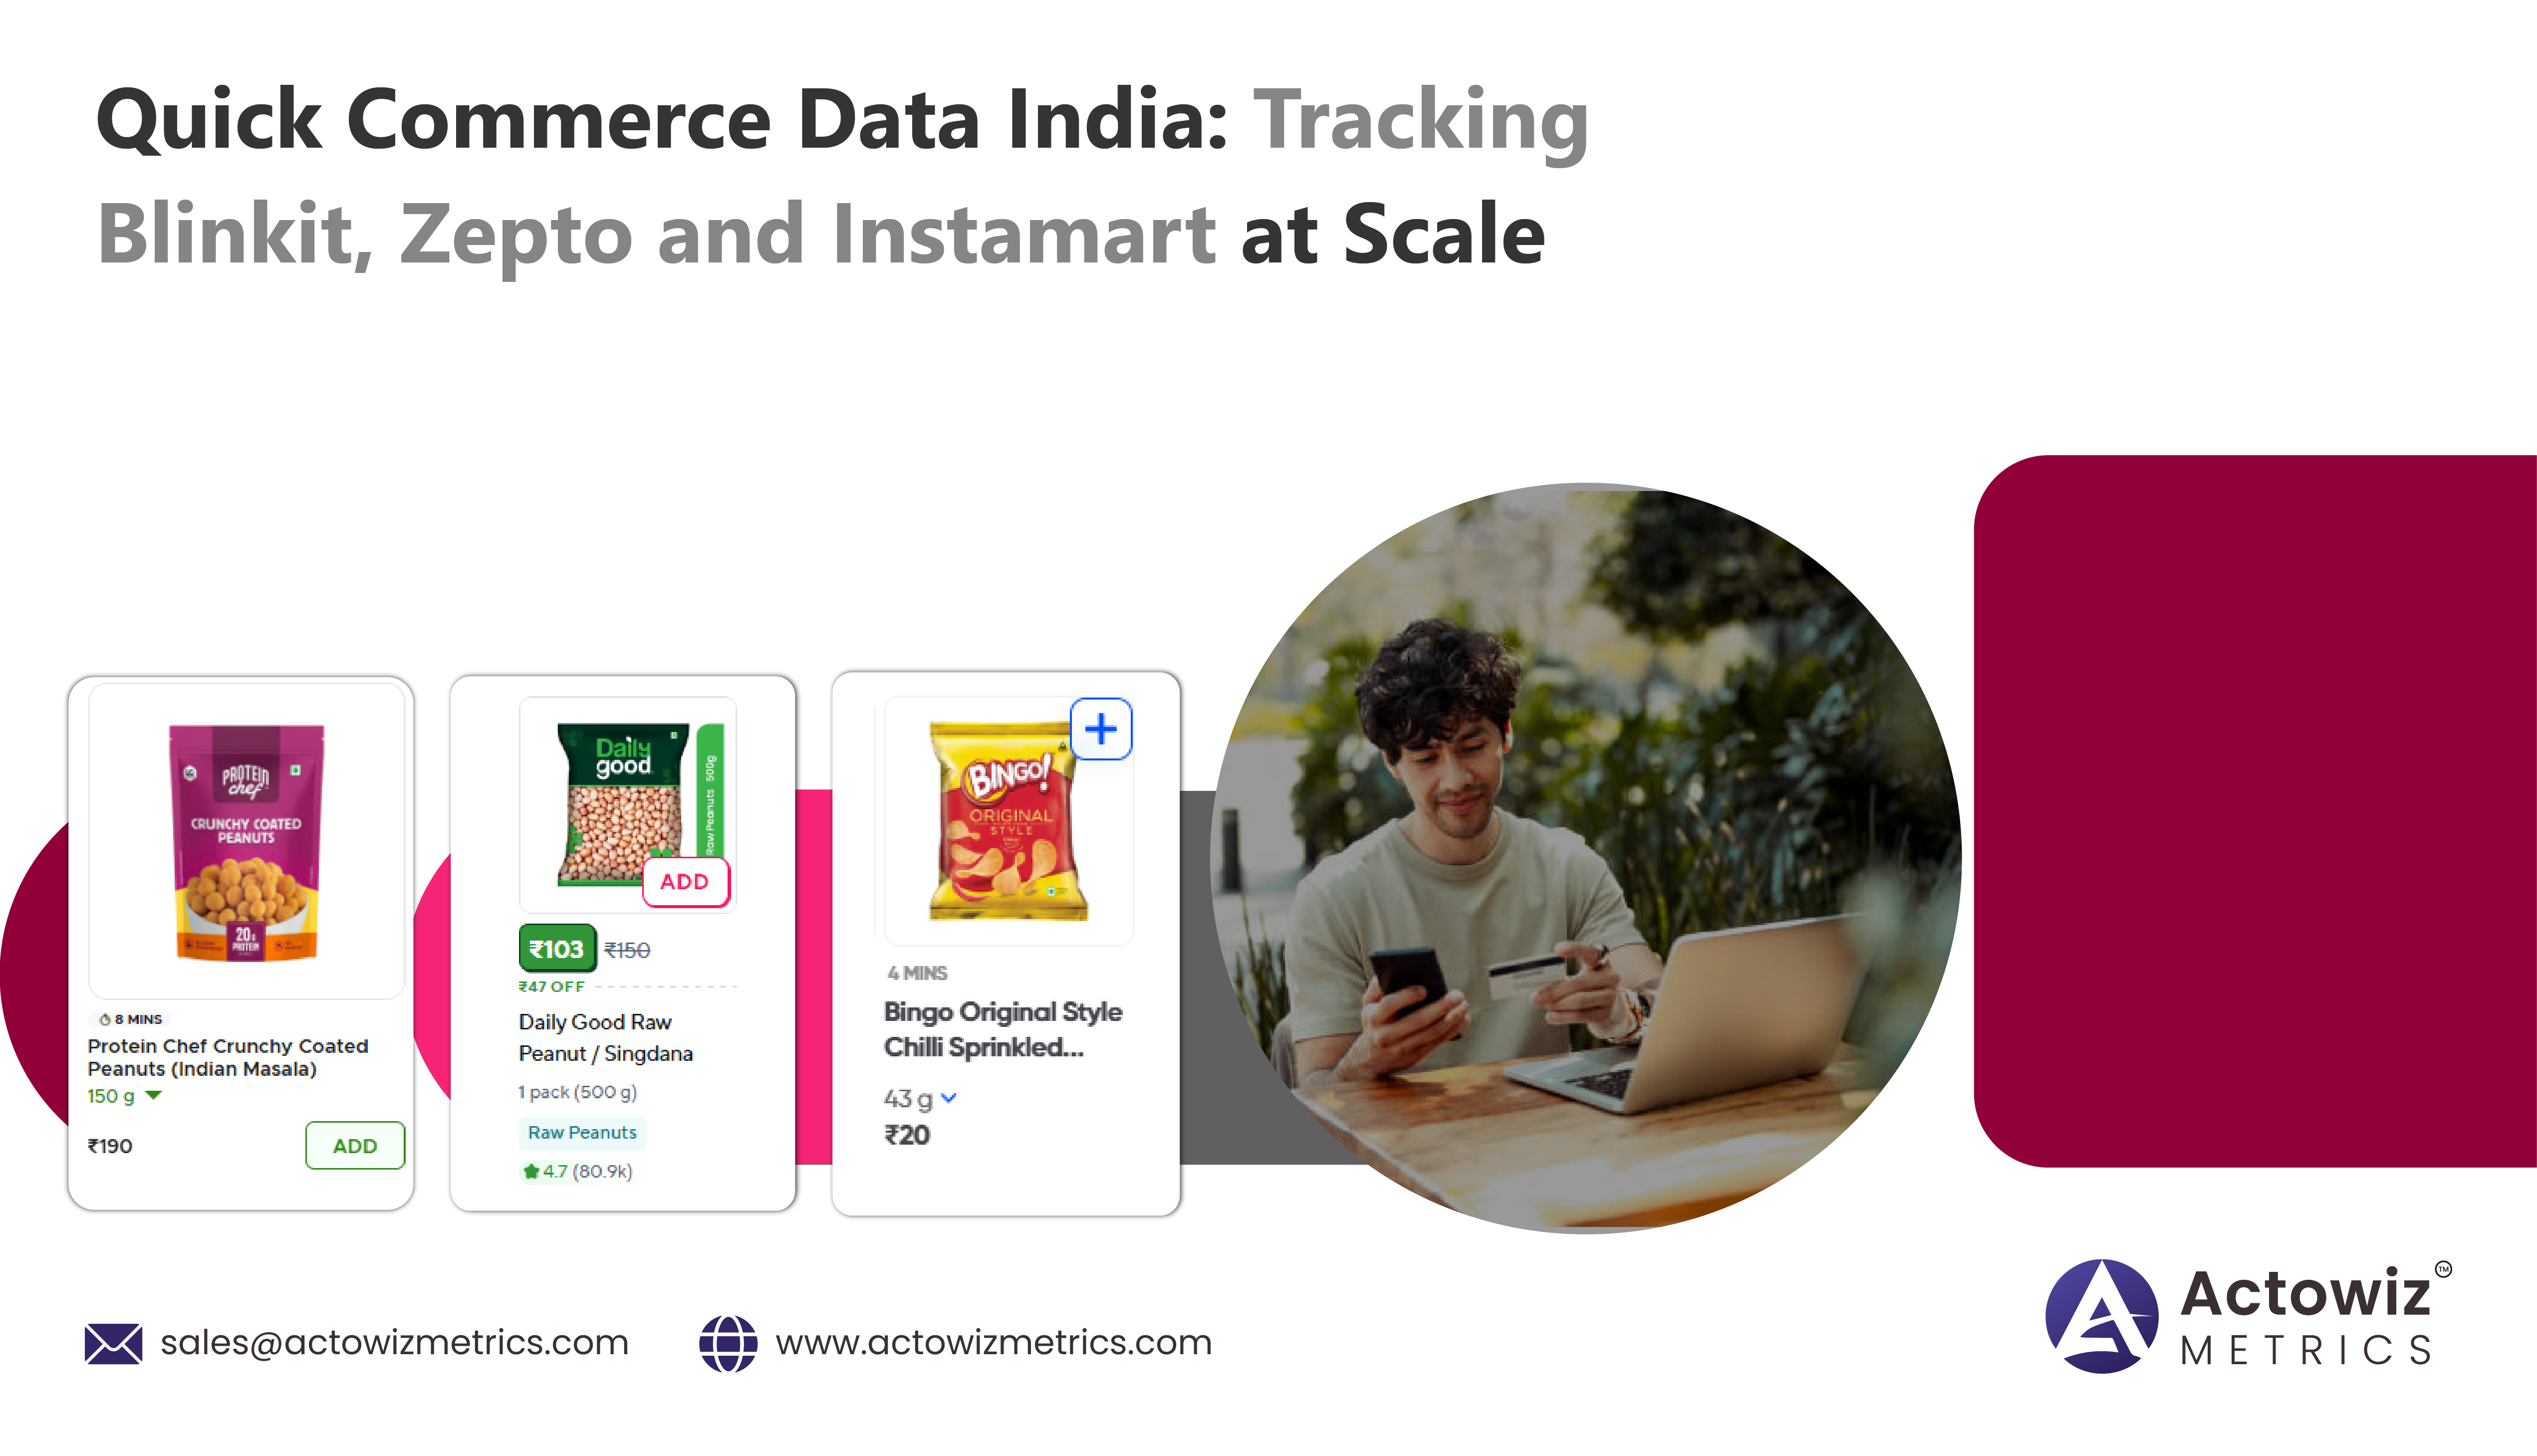
India has become the most competitive quick-commerce market in the world. What began as a convenience for forgotten groceries has grown into a primary channel for everyday shopping, with Blinkit, Zepto, and Swiggy Instamart delivering in roughly ten minutes across an expanding footprint of cities and neighbourhoods. For consumer brands, this shift has moved a meaningful share of sales into apps where the shelf is invisible from the outside — you cannot walk into a dark store and check your facing. Quick commerce data India has therefore become the only reliable way for a brand to know how it is actually presented, priced, and stocked in the channel that increasingly decides its growth.
The challenge is that this channel behaves nothing like a traditional marketplace. Prices, discounts, availability, and even assortment are determined at the level of individual dark stores serving specific pincodes, and they change throughout the day as inventory turns over and competitors adjust. A brand monitoring the market with a daily manual check, or a single national snapshot, sees almost none of what matters. This article explains how India's quick-commerce landscape works, why its data is uniquely difficult to capture, what brands should track, and how structured data turns a fragmented, fast-moving channel into a source of competitive advantage.
What follows is written for brands that already sell in the channel and suspect they are not seeing it clearly, as well as for those preparing to enter and wanting to understand what visibility will require. The throughline is that quick commerce rewards precision: the brands that win are rarely those with the biggest budgets, but those that know exactly where they stand in each locality and can act on it before the moment passes.
Three platforms dominate the everyday basket in India — Blinkit, Zepto, and Swiggy Instamart — with others including BigBasket, Flipkart Minutes, and Amazon Now competing for the same shopper. Each operates a dense network of dark stores, small hyperlocal warehouses stocked to serve the neighbourhoods immediately around them. This model is what makes ten-minute delivery possible, and it is also what makes the channel so fragmented from a data perspective: there is no single national shelf, only thousands of local ones.
These platforms have also expanded well beyond groceries. Personal care, home care, beauty, small electronics, and even apparel now appear in quick-commerce catalogues, which means the channel is relevant to a far wider set of brands than it was two years ago. For a growing number of categories, quick commerce is no longer a supplementary channel to monitor occasionally; it is a primary one where a substantial share of impulse and replenishment demand is now won or lost.
Competition between the platforms is intense and continuous. They compete on price, on delivery speed, on assortment depth, and on promotional aggression, and their relative strength varies by city and even by neighbourhood. A platform that leads in one metro may trail in another, and its advantage in a category can shift within weeks. For brands, this means the competitive picture cannot be assumed from experience — it has to be measured, continuously, in each market that matters.
For many categories, quick commerce has crossed the threshold from experiment to necessity. Repeat purchases of staples, personal care, and household items increasingly happen in these apps because they are simply the fastest route to a needed product, and habits formed there are sticky. A shopper who reliably finds a brand available and reasonably priced in the app will keep buying it; one who repeatedly finds it missing will switch and rarely switch back.
This makes the channel disproportionately important relative to its current share of sales. It is where habits are being set for the next several years, and where a brand's absence today translates into lost loyalty tomorrow. Treating it as a secondary channel to check occasionally underestimates both the speed at which it is growing and the durability of the shopper behaviour it is creating.
The defining difficulty is hyperlocality. Because each dark store holds its own inventory and can price independently, the same product can carry a different price, a different discount, a different delivery estimate, and a different availability status from one pincode to the next. Two shoppers a few kilometres apart open the same app and see two different versions of the same store. Any data collection that ignores location therefore misrepresents the market, no matter how much of it is gathered.
Speed compounds the problem. Dark-store inventory is limited and turns over quickly, so a product available at nine in the morning can be sold out by noon and restocked by evening. Promotions appear and expire within hours, and delivery estimates fluctuate with demand and rider availability. Capturing this reality requires high-frequency, location-aware collection across many pincodes simultaneously — a scale of work that manual checking cannot approach and that a once-daily snapshot completely misses.
There is also the practical matter of consistency. The same product may be listed differently across platforms, with variations in naming, pack size, and description, so raw collection alone produces data that cannot be compared. Making quick commerce data India genuinely useful requires matching products accurately across apps and normalising the results, so that a brand comparing its price against a rival is comparing the same item rather than a lookalike.
An effective quick-commerce monitoring programme captures several signals together, because in a ten-minute market they interact. Price alone does not explain why a basket was lost if the product was also out of stock or slower to deliver.
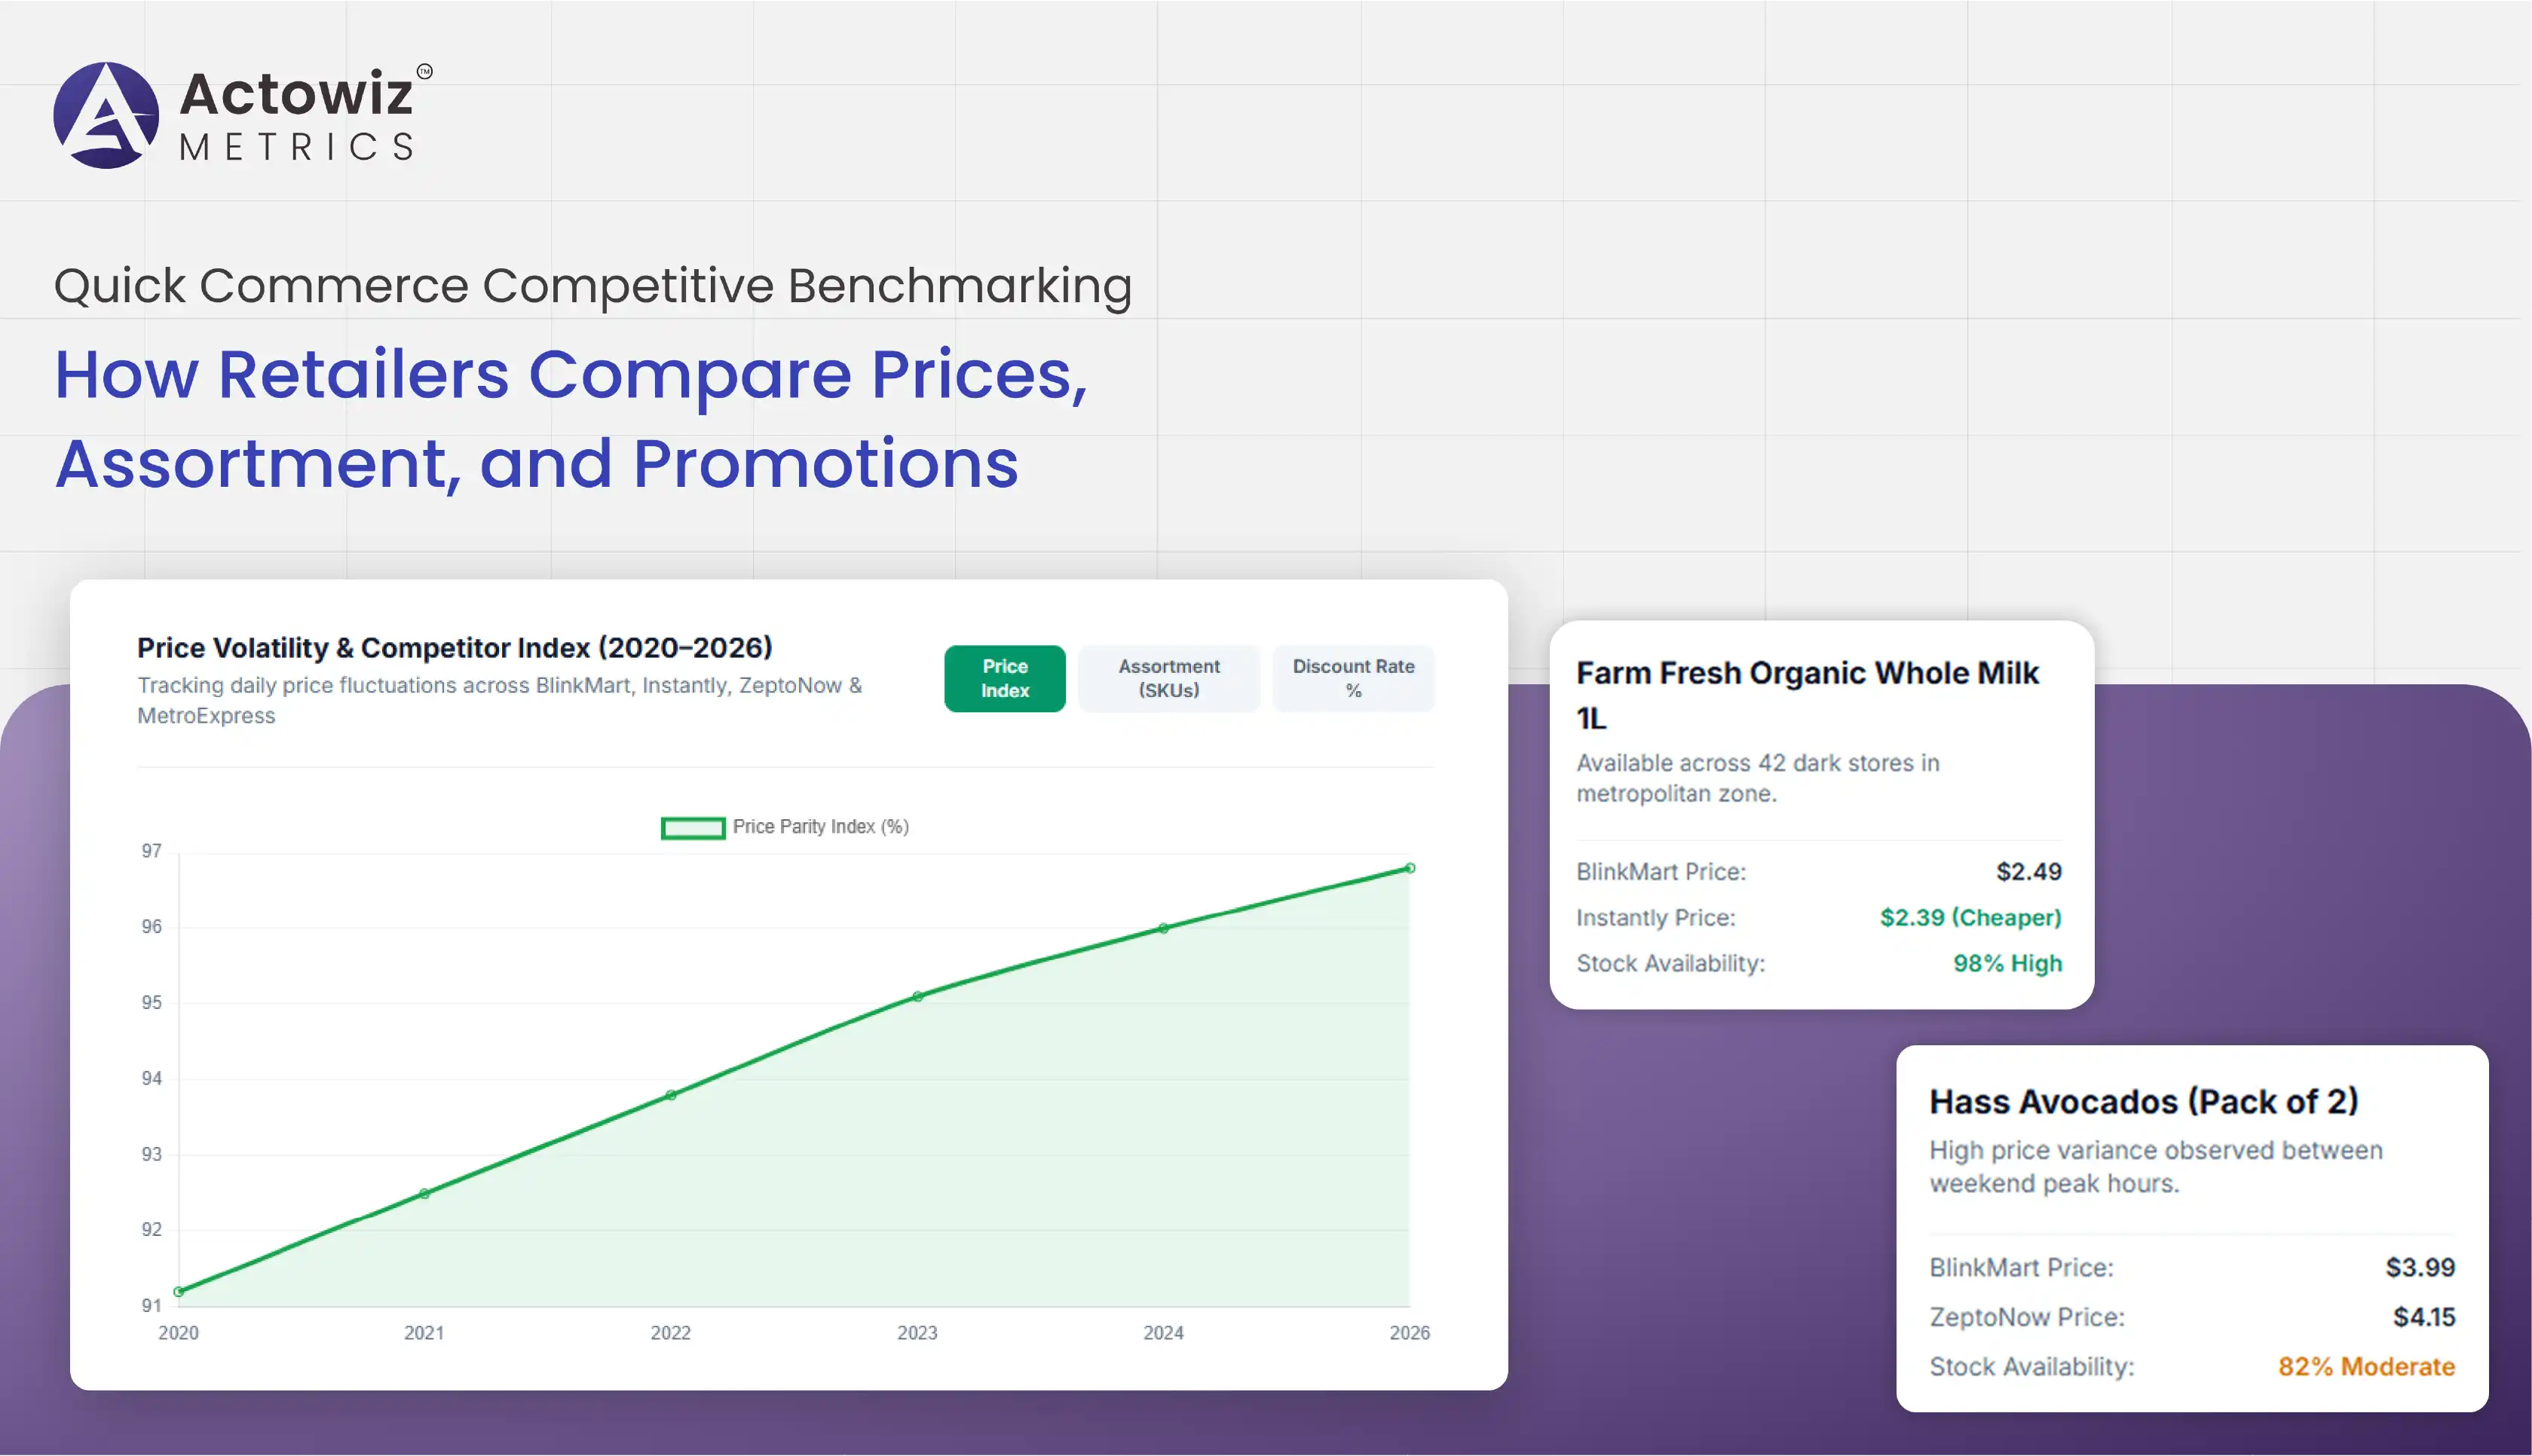
Together these answer the question that matters most: for this product, in this pincode, right now, am I winning the basket — and if not, which lever is losing it? The sample below shows how that looks in structured form.
| Product | City | Pincode | Blinkit | Zepto | Instamart | Lowest |
|---|---|---|---|---|---|---|
| Atta 5kg | Mumbai | 400001 | ₹255 | ₹259 | ₹252 | Instamart |
| Atta 5kg | Bengaluru | 560034 | ₹249 | ₹245 | Out of Stock | Zepto |
| Shampoo 340ml | Delhi | 110001 | ₹385 | ₹389 | ₹379 | Instamart |
| Biscuits 300g | Hyderabad | 500001 | ₹72 | ₹70 | ₹72 | Zepto |
The most immediate use is pricing. With pincode-level visibility, a brand can see precisely where it is being undercut and by how much, and respond with a targeted correction rather than a blunt national discount. This protects margin as much as it wins sales, because a brand that knows where it is already the cheapest option stops discounting there and redirects that investment to genuinely contested zones.
The second use is availability. Because a stockout in quick commerce hands the sale directly to a competitor, detecting it within hours rather than weeks is worth a great deal. Location-level availability data lets supply teams prioritise replenishment by the zones where demand is strongest, and it also flags the mirror-image opportunity: when a rival is out of stock, that is the moment to push visibility and capture demand that would otherwise have gone elsewhere.
The third is assortment and visibility. Tracking which SKUs are listed and serviceable in each city reveals gaps where a brand is simply absent from the shelf, and share-of-search data shows where products are present but not being found. Both are fixable, but only once they are visible. Over time, this data also reveals which categories and neighbourhoods are growing fastest, guiding where a brand should concentrate its inventory and marketing next.
The most frequent error is treating quick commerce like a marketplace and monitoring it nationally. A single national price and availability check produces numbers that feel reassuring and describe nobody, because the channel has no national shelf. The second common mistake is monitoring too infrequently — a daily check in a market where stock turns over within hours captures a fraction of what happens and misses most stockouts entirely.
A third mistake is tracking price in isolation. In a ten-minute market, a shopper choosing between apps weighs availability and delivery speed alongside price, so a brand that is cheapest but out of stock, or available but slower, still loses. Reading these signals separately produces a confusing picture in which pricing looks right yet sales underperform, and the actual cause stays hidden.
The final error is inconsistent product matching. Comparing a brand's product against a differently sized or specified competitor item produces price gaps that are not real, and decisions made on them waste margin. Accurate matching is unglamorous but it is what makes everything downstream trustworthy.
A practical programme runs through four stages. It begins with scoping: choosing the pincodes, SKUs, categories, and competitors that genuinely influence the business, so effort concentrates on the markets that matter rather than an undifferentiated national crawl. Next comes location-aware capture, collecting each data point against its specific pincode and timestamp at a frequency matched to how quickly the category moves.
The third stage is structuring — cleaning and matching the data so cross-platform and cross-pincode comparisons are reliable. The fourth is activation: mapping each signal to a defined response, so a competitor undercut triggers a pricing review, a stockout triggers replenishment, and a listing gap triggers an onboarding request. Designed in advance, this workflow lets a small team compete across hundreds of micro-markets without being overwhelmed, because the pipeline filters the noise and surfaces only what warrants a decision.
Frequency deserves particular thought. There is a temptation either to collect rarely, which misses the moves that matter, or to collect constantly everywhere, which produces more data than a team can use. The sensible approach is to match frequency to volatility — higher for competitive categories, hero SKUs, and promotional periods, lower for stable ones — so effort and cost concentrate where the market actually changes.
Quick-commerce intelligence should rest on publicly available retail information — the prices, listings, and availability any shopper can see in the app. Responsible collection of public retail data, handled transparently and in line with data-protection expectations, gives brands the visibility they need without creating legal or reputational risk. It is a point worth confirming with any data partner, because intelligence built on questionable methods is a liability regardless of how useful it appears.
Expert blogs, research reports and infographics — practical, data-driven reading across e-commerce and quick-commerce.
Most fields are optional — the more you share, the better your sample.

.webp "infographics")
.webp "infographics")