BLOG




















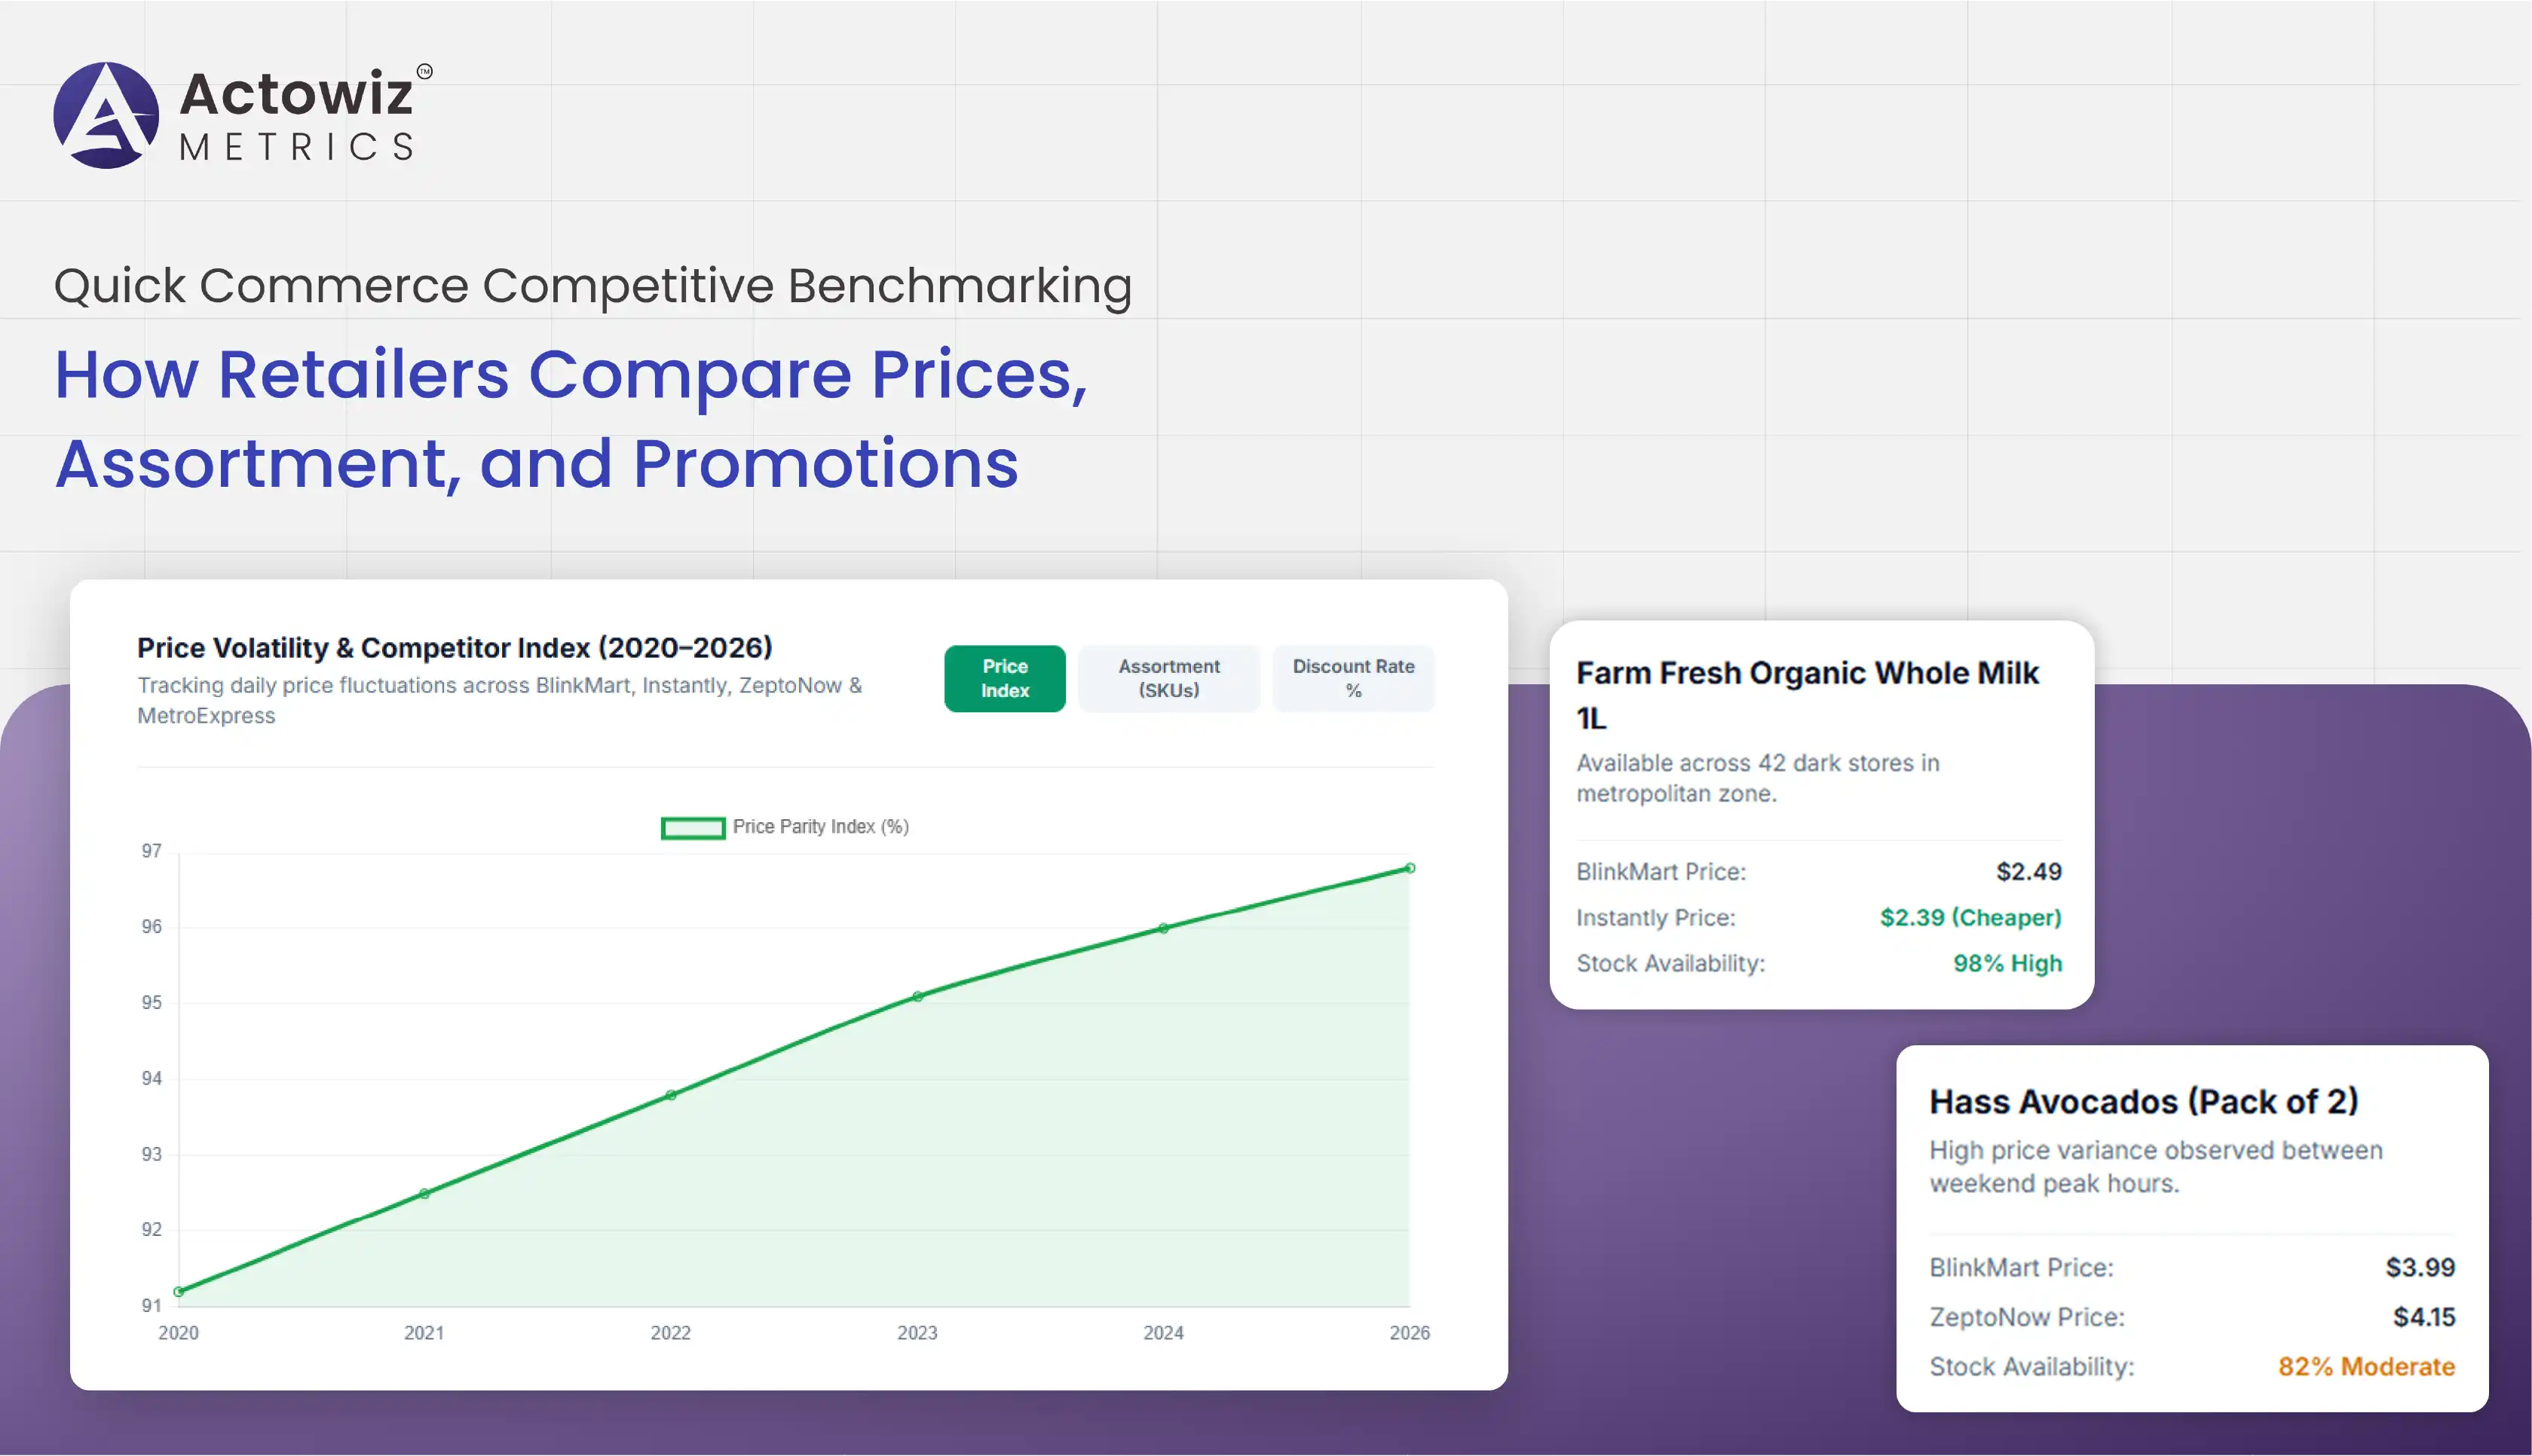
Quick commerce has transformed how consumers purchase groceries, household essentials, personal care products, beverages, snacks, and everyday necessities. The ability to receive products within minutes has shifted competition from traditional store locations toward digital storefronts, localized fulfillment networks, product availability, delivery speed, pricing, and assortment depth.
For retailers and consumer brands, Quick Commerce Competitive Benchmarking provides a structured way to compare market performance across platforms. Instead of evaluating competitors through occasional manual checks, businesses can continuously monitor product prices, discounts, assortment, availability, promotions, ratings, and other visible market signals.
The rapid expansion of digital grocery and instant-delivery services since 2020 has also created an enormous volume of retail data. Platforms can change prices throughout the day, add or remove products, adjust promotions, and show different assortments according to location. Consequently, businesses need scalable methods to capture and normalize these changes.
Quick-commerce analytics enables retailers to transform this information into measurable insights. By combining product, price, promotion, availability, and competitor data, businesses can identify pricing gaps, assortment opportunities, stock availability patterns, and competitive movements.
This report examines how quick-commerce businesses can use data-driven benchmarking between 2020 and 2026 to improve pricing, assortment, promotional planning, availability monitoring, and overall market positioning.
Quick-commerce competition involves more than delivery speed. Consumers increasingly compare prices, discounts, brands, product variety, availability, and convenience before selecting a platform. Retailers therefore require consistent performance indicators that allow them to evaluate their position against competitors.
Quick-commerce performance benchmarking helps businesses compare important operational and commercial metrics across platforms. These metrics can include average product price, promotional frequency, assortment size, stock availability, discount depth, product visibility, and category coverage.
| Year | Market Development | Benchmarking Priority |
|---|---|---|
| 2020 | Online grocery adoption accelerated | Product and availability tracking |
| 2021 | Delivery networks expanded | Assortment and fulfillment comparison |
| 2022 | Inflation increased price sensitivity | Price and discount monitoring |
| 2023 | Competition intensified | Competitor performance comparison |
| 2024 | Platforms expanded categories | Category and assortment benchmarking |
| 2025 | Data-driven optimization increased | Automated competitive monitoring |
| 2026 | Mature quick-commerce ecosystems | Continuous multi-platform benchmarking |
A retailer can benchmark the same set of products across multiple platforms to determine whether it is competitively priced. For example, a brand may track a basket containing essential grocery items, beverages, personal care products, and household products. Comparing the basket regularly can reveal which platforms offer stronger value.
Performance benchmarking can also identify promotional differences. One platform may offer deeper discounts on branded products, while another may rely heavily on private-label promotions. These differences can influence customer acquisition and retention.
Historical benchmarking adds another dimension. Instead of asking whether a retailer is competitive today, businesses can determine whether its position has improved or weakened over several months or years.
This creates a stronger foundation for pricing decisions, promotional planning, category management, and commercial strategy.
Quick-commerce platforms generate a continuous stream of information. Every product listing, price change, promotion, stock update, and assortment adjustment can provide a signal about competitive activity.
Quick-commerce market intelligence helps organizations organize these signals into structured datasets that support business decisions. The objective is not simply to collect large volumes of information but to understand what those changes mean for the market.
| Signal | What It Reveals | Business Application |
|---|---|---|
| Price changes | Competitive pricing movement | Pricing strategy |
| Discounts | Promotional intensity | Promotion planning |
| New products | Category expansion | Assortment planning |
| Stock changes | Availability conditions | Inventory decisions |
| Product removals | Assortment changes | Portfolio optimization |
| Ratings/reviews | Customer response | Product improvement |
| Search visibility | Digital discoverability | Merchandising |
Between 2020 and 2026, quick commerce moved from a convenience-focused service toward a sophisticated retail channel. Platforms increasingly compete across groceries, fresh food, beauty, pharmacy-related categories, electronics accessories, pet supplies, and other everyday products.
Market intelligence can help retailers identify which categories are receiving greater attention from competitors. A sudden increase in assortment may indicate an emerging category opportunity. Conversely, declining assortment could indicate weaker demand, supply constraints, or a strategic change by the platform.
Location-level intelligence is particularly important. A product may be available in one neighborhood but unavailable in another because quick-commerce inventory is typically connected to local fulfillment centers. Monitoring multiple locations can therefore reveal geographic differences in assortment and availability.
Businesses can use these insights to prioritize markets, optimize product portfolios, and understand competitive strategies.
Price is one of the most visible competitive factors in quick commerce. Customers can compare several digital platforms within minutes, making pricing inconsistencies increasingly important.
Quick-commerce benchmark analysis enables businesses to compare prices, discount levels, promotional frequency, and basket costs across platforms and periods.
| Year | Pricing Environment | Primary Analytical Need |
|---|---|---|
| 2020 | Convenience influenced purchasing | Basic price monitoring |
| 2021 | Promotional adoption increased | Discount tracking |
| 2022 | Inflation intensified | Frequent price comparisons |
| 2023 | Value perception became critical | Basket-level benchmarking |
| 2024 | Dynamic promotions expanded | Promotion monitoring |
| 2025 | Automated pricing increased | Real-time comparison |
| 2026 | Competitive pricing became data-led | Continuous benchmarking |
Retailers can create standardized product baskets to compare total shopping costs across platforms. This approach is more informative than comparing individual SKUs because customers frequently purchase multiple products together.
For example, a retailer could establish benchmark baskets for breakfast products, household essentials, snacks, beverages, or personal care. Tracking these baskets over time can reveal which platforms consistently offer competitive prices.
Promotional analysis is equally important. Businesses can monitor discount percentages, buy-one-get-one offers, coupons, bundle promotions, and other promotional mechanisms where visible. Historical datasets can identify recurring promotional periods and competitor patterns.
The resulting information can support pricing teams in deciding when to adjust prices, defend market position, or launch promotions. It can also help brands understand how their products are positioned across different quick-commerce channels.
Importantly, benchmark analysis should consider both regular and promotional prices. A product may appear highly competitive during a promotion but become significantly more expensive outside the promotional period. Maintaining historical records helps businesses distinguish temporary price movements from sustained positioning changes.
Assortment has become a major competitive differentiator in quick commerce. Customers expect platforms to provide a broad selection while still maintaining the convenience associated with rapid delivery.
Quick-commerce assortment benchmarking enables businesses to compare the depth and breadth of product ranges across platforms, categories, brands, and locations.
| Year | Assortment Trend | Business Focus |
|---|---|---|
| 2020 | Essentials dominated | Core grocery availability |
| 2021 | Category expansion began | Broader everyday assortment |
| 2022 | Value products gained attention | Private-label comparison |
| 2023 | Non-grocery categories expanded | Cross-category monitoring |
| 2024 | Premium and specialty products grew | Assortment segmentation |
| 2025 | Localized catalogs increased | Location-level analysis |
| 2026 | Broader digital catalogs | Automated assortment intelligence |
Assortment benchmarking can reveal the number of products offered in a category, the brands represented, pack-size variations, price tiers, and the presence of premium or economy products.
For brands, this provides an opportunity to understand distribution and competitive positioning. A brand may discover that competitors have significantly greater representation in a particular category or that specific pack sizes are missing from its digital assortment.
Retailers can also use assortment datasets to identify gaps. If several competitors carry a popular product category that is absent from their own catalog, the information may support assortment expansion discussions.
Another important application is new-product monitoring. Tracking when competitors introduce new SKUs can help category managers identify emerging trends earlier.
Historical assortment datasets can show whether a category is expanding, contracting, or changing composition. This makes assortment analysis useful not only for operational decisions but also for strategic category planning.
Product availability is particularly important in quick commerce because the value proposition depends on immediate fulfillment. Customers cannot benefit from rapid delivery if the desired product is unavailable.
Quick-commerce product availability benchmarking across platforms allows businesses to monitor whether products remain consistently visible and purchasable across competing platforms.
| Year | Availability Challenge | Monitoring Priority |
|---|---|---|
| 2020 | Supply disruptions | Stock visibility |
| 2021 | Fulfillment expansion | Local availability |
| 2022 | Supply and inflation pressure | Stockout monitoring |
| 2023 | Larger assortments | SKU-level tracking |
| 2024 | More localized fulfillment | Store-level comparison |
| 2025 | Faster delivery expectations | Frequent availability checks |
| 2026 | Data-driven inventory optimization | Near-real-time monitoring |
Availability data can reveal several important patterns. If a product is repeatedly unavailable on one platform while competitors continue selling it, the difference may indicate an inventory or fulfillment issue. If several platforms experience simultaneous stockouts, the cause may instead relate to broader supply conditions.
Brands can use availability monitoring to identify distribution gaps. A product might be listed in a retailer's catalog but unavailable across several local fulfillment centers. Detecting these patterns can help organizations investigate operational or inventory challenges.
Availability benchmarking can also support launch monitoring. When a new product enters the market, businesses can track how quickly it becomes available across platforms and locations.
The historical dimension is valuable as well. Repeated availability records can identify recurring stockout periods, seasonal patterns, and platform-specific availability differences.
For quick-commerce businesses, this information can support inventory planning, replenishment decisions, supplier management, and customer experience improvement.
The most valuable quick-commerce datasets are not limited to a single metric. Price, assortment, availability, promotion, product content, and competitor information become significantly more useful when analyzed together.
Quick Commerce Intelligence provides this broader perspective by connecting multiple retail data signals. When integrated with Quick Commerce Competitive Benchmarking, businesses can develop a comprehensive view of their digital market position.
| Year | Intelligence Capability | Strategic Outcome |
|---|---|---|
| 2020 | Basic online monitoring | Digital visibility |
| 2021 | Multi-platform tracking | Competitive comparison |
| 2022 | Price intelligence | Pricing response |
| 2023 | Product and assortment analysis | Category optimization |
| 2024 | Availability monitoring | Better fulfillment insight |
| 2025 | Automated analytics | Faster decision-making |
| 2026 | Integrated intelligence | Proactive market strategy |
An integrated dataset can answer questions that individual metrics cannot. For example, a retailer may discover that its product has a competitive price but poor availability. Another brand may have excellent availability but weak digital visibility because competitors dominate the assortment.
Combining multiple indicators also allows businesses to evaluate promotions more effectively. A discount may increase visibility but create limited commercial benefit if inventory is insufficient. Similarly, adding new products may not improve performance if the products are consistently unavailable.
A unified analytical environment enables commercial teams to monitor these relationships and prioritize the areas requiring attention.
Actowiz Metrics helps businesses build scalable retail data solutions that convert fragmented digital information into structured and analytics-ready datasets.
With Quick Commerce Competitor Benchmarking, brands can systematically compare competitor products, prices, promotions, assortment, and availability across selected platforms and locations. Such datasets can support category teams, pricing managers, e-commerce teams, and business analysts.
The broader advantage is scalability. Instead of relying on manual screenshots or periodic spreadsheet updates, organizations can establish recurring data collection workflows. Product information can be standardized, duplicate records can be managed, and historical datasets can be maintained for longitudinal analysis.
Actowiz Metrics can also tailor data collection around specific categories, brands, SKUs, retailers, geographic locations, and business KPIs. This makes the resulting datasets more relevant to individual benchmarking requirements.
Another important advantage is historical visibility. Maintaining structured records over time allows businesses to identify trends rather than relying on isolated observations. This can support promotional planning, assortment optimization, pricing strategy, competitive monitoring, and market research.
For organizations operating in rapidly changing quick-commerce markets, timely and reliable data can reduce the time required to identify competitive changes and improve the speed of commercial decision-making.
Quick commerce has developed into a highly competitive digital retail environment where pricing, assortment, promotions, availability, and convenience influence customer decisions. Between 2020 and 2026, the sector evolved from an emerging delivery model into a sophisticated channel requiring continuous market monitoring.
Data-driven benchmarking gives retailers and brands a structured way to understand competitive movements. By comparing products, prices, promotions, assortment, and availability across platforms, businesses can identify gaps and opportunities more efficiently.
Price Benchmarking is particularly valuable because quick-commerce consumers can compare competing platforms rapidly, while historical data helps distinguish temporary promotions from sustained pricing strategies.
When these capabilities are integrated into a broader data framework, organizations can move beyond basic monitoring toward proactive commercial decision-making. They can identify category opportunities, improve assortment, evaluate promotional effectiveness, monitor availability, and respond to competitor movements faster.
Ultimately, Quick Commerce Competitive Benchmarking provides the foundation for building a more measurable and responsive digital retail strategy.
Want to benchmark quick-commerce prices, products, assortment, promotions, and availability across platforms? Partner with Actowiz Metrics to build scalable, customized retail intelligence datasets for faster and smarter decisions!
Expert blogs, research reports and infographics — practical, data-driven reading across e-commerce and quick-commerce.
Most fields are optional — the more you share, the better your sample.
.webp "infographics")
.webp "infographics")