BLOG
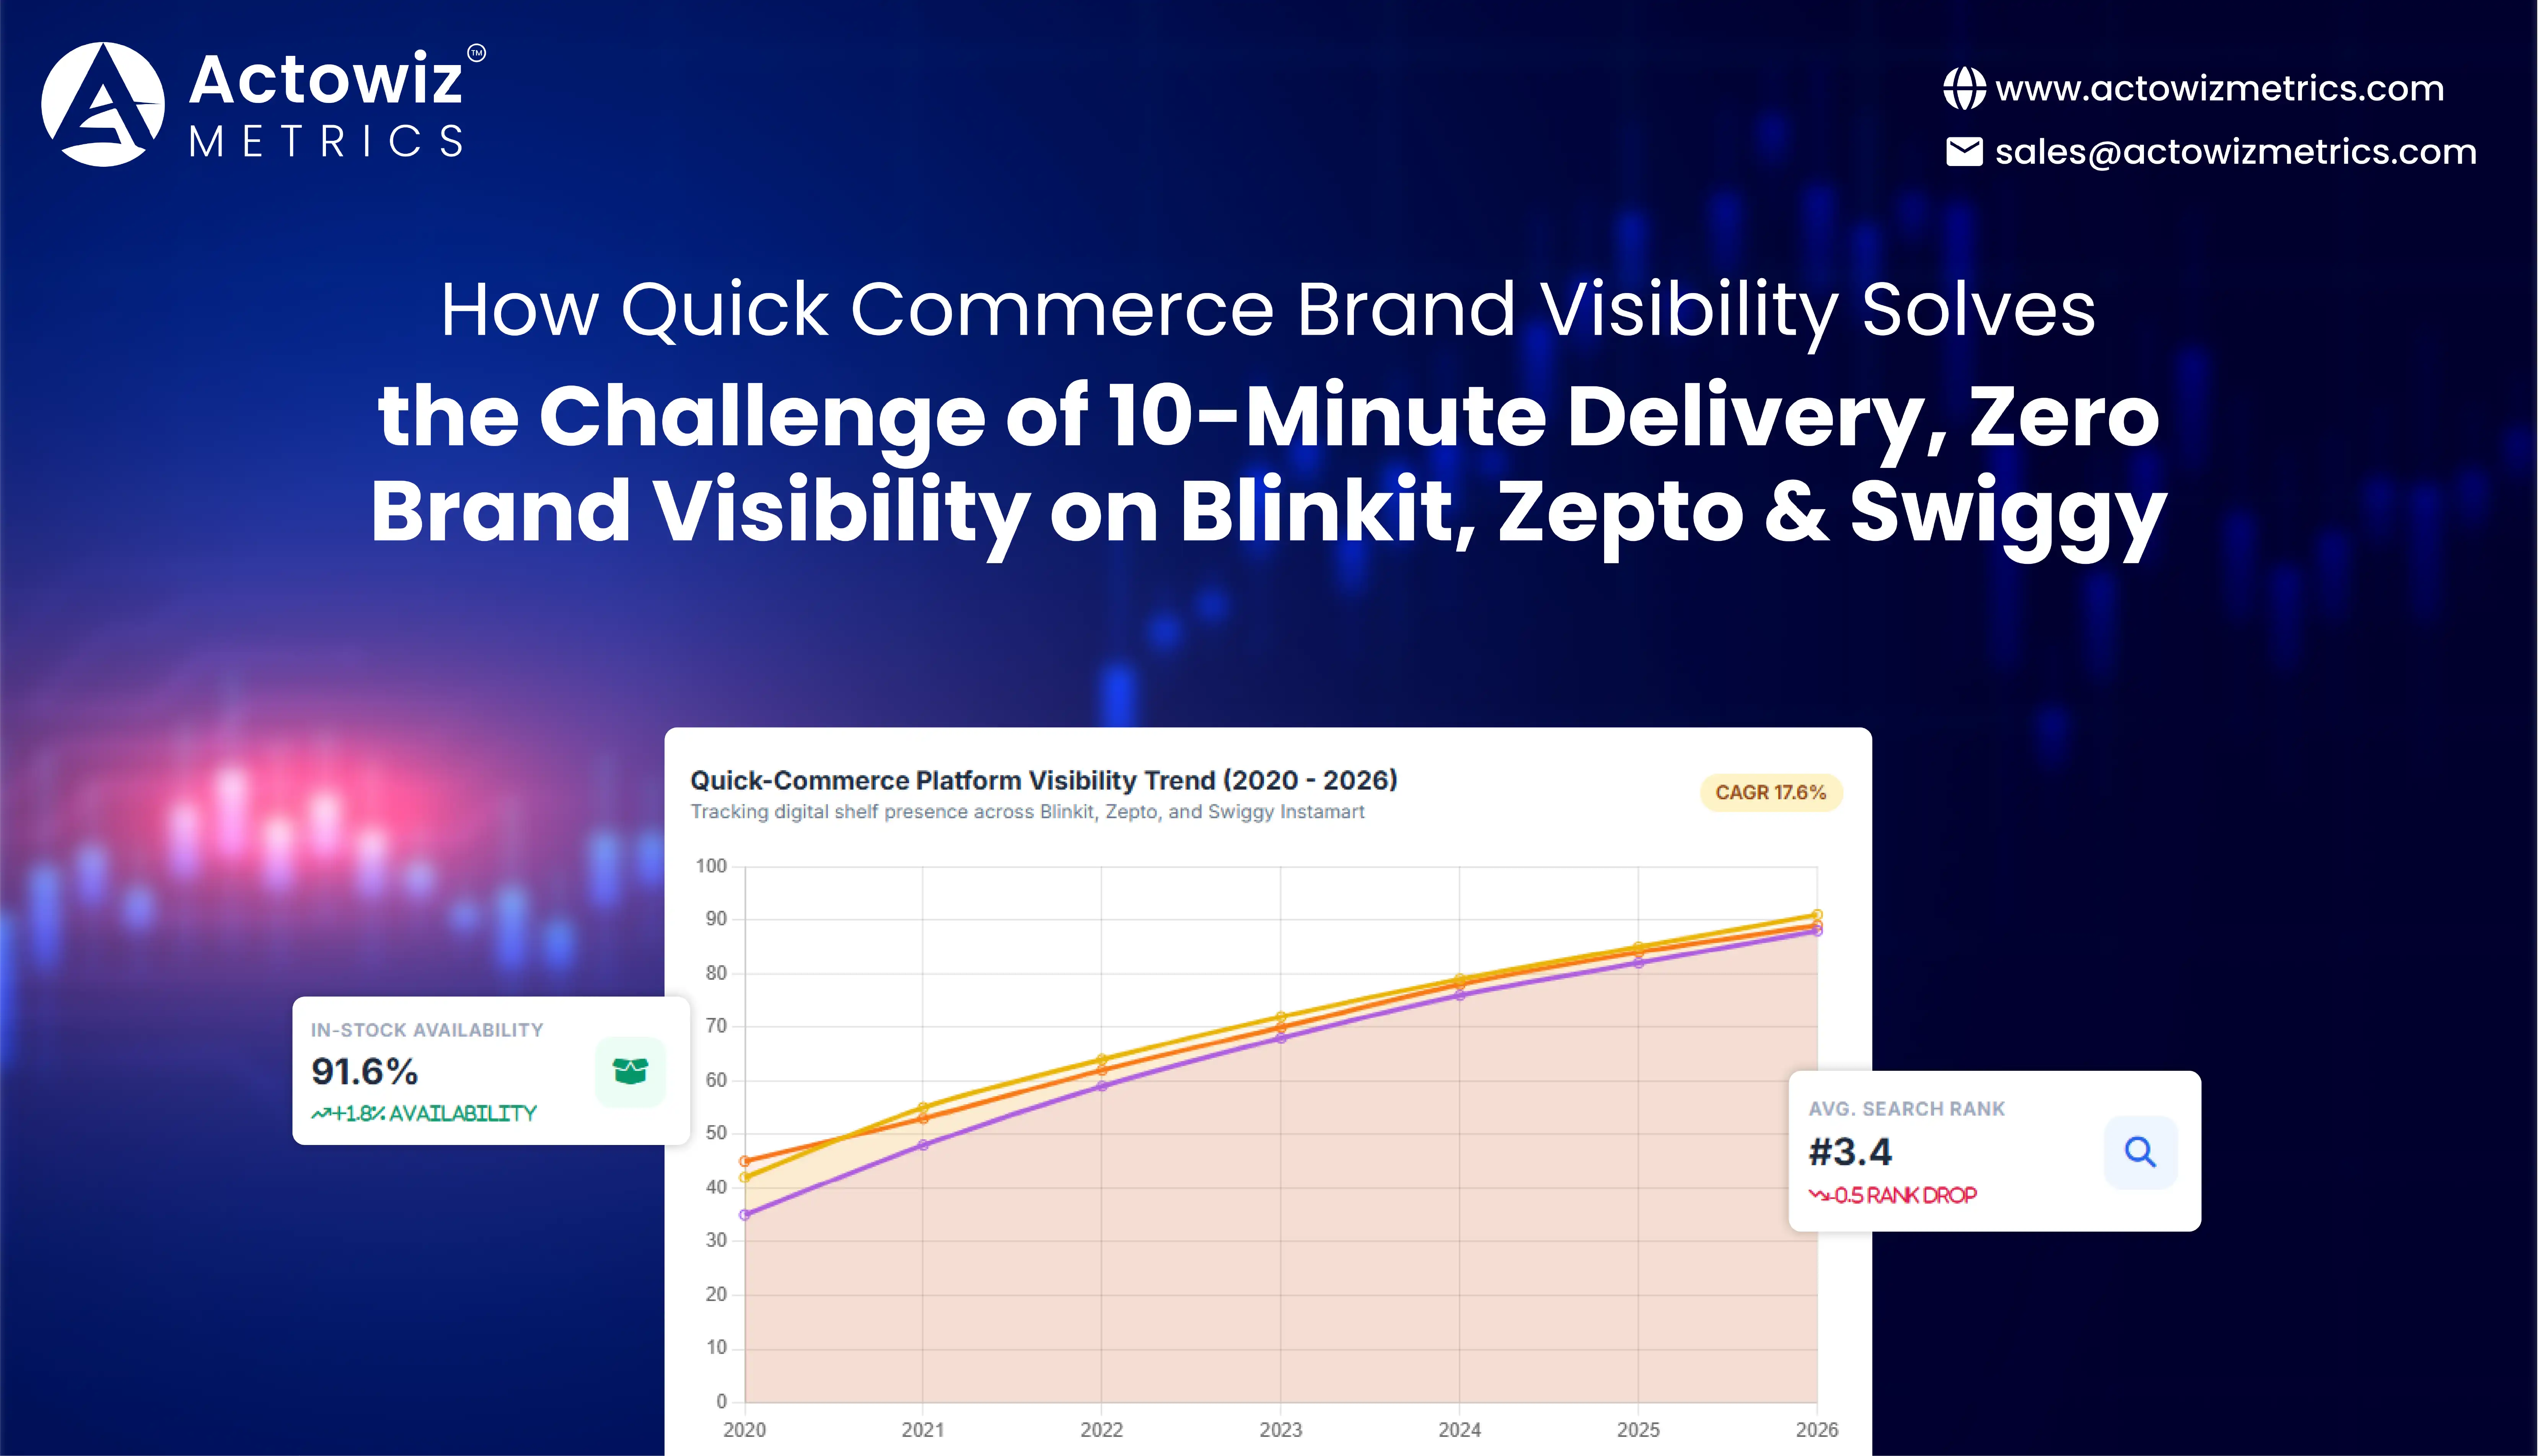




















Quick Commerce Brand Visibility is the ability of brands to measure whether their products are listed, searchable, available, correctly priced, competitively positioned, and discoverable across fast-delivery platforms. A product can reach consumers within minutes, yet remain difficult to find because of stockouts, weak search placement, limited geographic coverage, pricing differences, or poor digital shelf execution.
This is where Quick Commerce Intelligence becomes important. For FMCG, grocery, beauty, personal care, electronics, and D2C brands, monitoring only sales or delivery speed is no longer sufficient. Brands need granular visibility into what shoppers actually see across Blinkit, Zepto, and Swiggy Instamart.
India's quick-commerce market has expanded rapidly since 2020. Industry research estimates that India's quick-commerce market reached approximately $6.78 billion in 2025 and is forecast to grow at a 17.6% CAGR between 2025 and 2029. (Research and Markets)
The competitive environment has also become more complex. Blinkit reported 2,243 stores across 250+ cities by March 2026, while Zepto's FY26 disclosures reported 1,139 dark stores. Swiggy's Instamart network reached 1,143 active dark stores in FY26. (FinancialFilings)
For brand managers, e-commerce heads, category managers, and revenue teams, the real question is no longer simply, "Can we deliver quickly?" It is, "Can customers find and buy our products quickly?"
| Visibility Metric | Why It Matters |
|---|---|
| Product availability | Shows whether consumers can actually purchase the SKU |
| Search position | Indicates how easily shoppers can discover the product |
| Stock status | Identifies lost sales caused by availability gaps |
| Price and discount | Reveals competitive pricing differences |
| Promotions | Measures promotional visibility and execution |
| Product assortment | Shows which SKUs are visible across locations |
| Competitor placement | Provides context for category performance |
| Geographic coverage | Identifies city, store, or pincode-level gaps |
The quick-commerce model has evolved from emergency grocery replenishment into a broader digital retail channel. When Swiggy launched Instamart in 2020, the proposition centered on groceries and household essentials delivered within minutes. By FY2025-26, Swiggy described Instamart as serving a much broader assortment, while its network had reached 1,143 active dark stores. (The Economic Times)
The 2020–2026 shift matters because brands now compete not only for availability but also for digital attention. In the early phase, being listed could provide meaningful access to consumers. As platforms expanded their assortments, brands increasingly needed to monitor search placement, competitor products, pricing, promotions, ratings, reviews, and stock status at a much more granular level.
Blinkit's quick-commerce NOV grew 117% year over year to ₹48,567 crore in FY26, with order growth of 116%. The company also added 942 net new stores during FY26, taking its store count to 2,243. (FinancialFilings) Zepto's reported orders increased from 132.87 million in FY25 to 640.18 million in FY26, alongside an increase in dark stores from 1,029 to 1,139. (mint)
Swiggy's FY2024-25 report also showed the scale of Instamart's expansion: active dark stores rose from 523 in FY24 to 1,021 in FY25, while the dark-store footprint reached 4 million square feet. (Swiggy)
This expansion creates a new challenge. A brand can have broad distribution but inconsistent visibility from one location to another. A SKU may be available in one area, unavailable in another, ranked differently in search results, or displayed with a different promotion.
For brands, 2020–2026 therefore represents a shift from basic availability monitoring toward continuous digital shelf intelligence.
| Period | Major Market Development | Visibility Implication |
|---|---|---|
| 2020 | Quick commerce gains traction | Basic listing and availability become important |
| 2021 | Consumer adoption accelerates | Brands begin tracking digital availability |
| 2022 | Platform competition intensifies | Price and assortment comparisons gain importance |
| 2023 | Category expansion increases | More SKUs require systematic monitoring |
| 2024 | Dark-store networks scale | Location-level visibility becomes critical |
| 2025 | Tier-2 and Tier-3 expansion grows | Geographic monitoring becomes more important |
| 2026 | Platforms operate at large scale | Continuous competitive intelligence becomes essential |
Blinkit Product Visibility Monitoring helps brands determine whether their products are consistently discoverable and purchasable across the platform. Monitoring can cover product listings, search placement, availability, pricing, promotions, ratings, reviews, images, titles, pack sizes, and competitor positioning.
Blinkit's scale makes this particularly relevant. Eternal reported that Blinkit's FY26 quick-commerce NOV reached ₹48,567 crore, while its store network expanded to 2,243 stores across 250+ cities by March 2026. (FinancialFilings) At this scale, manual checks cannot provide a dependable view of every product-location combination.
A brand may have a complete catalog but still experience visibility gaps. For example, a product may appear correctly in one locality but show as unavailable in another. A competitor may also occupy stronger search positions or offer a more prominent promotion.
Brands can therefore monitor product-level and location-level indicators together.
| Blinkit Monitoring Area | Business Question |
|---|---|
| SKU availability | Is the product purchasable? |
| Search position | Can shoppers find it easily? |
| Product title | Is the SKU clearly identifiable? |
| Price | Is the displayed price competitive? |
| Discount | Is the advertised offer visible? |
| Ratings and reviews | What signals influence shopper confidence? |
| Competitor listings | Which competing products appear nearby? |
| Store/location coverage | Where are visibility gaps occurring? |
From 2020 to 2026, the shift has been from simply asking whether a product is listed to understanding whether the product is commercially visible. For brand managers, this means tracking the complete customer-facing experience rather than treating marketplace presence as a one-time onboarding activity.
The actionable insight is simple: visibility should be measured at the SKU and location level, not only at the brand level.
Zepto stock availability monitoring allows brands to identify availability gaps before they become persistent revenue and visibility problems. In quick commerce, an out-of-stock SKU is more than an inventory issue. It can remove the product from a consumer's immediate purchase journey.
Zepto's rapid network expansion demonstrates why granular monitoring is necessary. According to reporting based on the company's IPO filing, Zepto increased its dark stores from 337 in FY24 to 1,029 in FY25 and 1,139 in FY26. Its total orders also rose substantially over the same period. (mint)
With thousands of products distributed across multiple fulfillment locations, availability can vary according to local demand and inventory. A national brand may therefore have strong overall distribution but still experience SKU-level stockouts in high-value markets.
| Availability Indicator | What Brands Can Detect |
|---|---|
| In-stock/out-of-stock status | Immediate purchase availability |
| SKU-level availability | Products affected by localized stockouts |
| Location-level gaps | Markets requiring inventory attention |
| Pack-size availability | Missing variants or sizes |
| Competitor availability | Whether alternatives remain purchasable |
| Recurring stockouts | Potential replenishment or forecasting issues |
Between 2020 and 2026, quick commerce moved toward wider assortment and deeper local fulfillment. Zepto's 2025 disclosures cited more than 45,000 products, while the broader market expanded beyond traditional grocery into electronics, apparel, beauty, and other categories. (Reuters)
This makes availability intelligence increasingly important. A brand should distinguish between a temporary stockout, a recurring location-specific stockout, and a broader assortment problem.
The strongest monitoring systems connect availability data with price, search placement, promotions, and competitor availability. That allows category managers to determine whether declining visibility is caused by inventory, merchandising, pricing, or competitive positioning.
Swiggy Instamart competitor monitoring enables brands to understand how their products compare with competing SKUs across price, promotions, availability, assortment, and digital placement.
Swiggy's scale makes competitive monitoring increasingly relevant. Its FY2024-25 annual report recorded 1,021 active dark stores and 4 million square feet of dark-store footprint. The company also reported expansion to 124 cities during FY2024-25. (Swiggy) In FY2025-26, Swiggy's quick-commerce business reportedly reached 1,143 active dark stores, with GOV growing 94% year over year and average order value reaching ₹691. (The Economic Times)
A competitor monitoring framework can compare the same category across multiple dimensions.
| Competitive Dimension | Monitoring Purpose |
|---|---|
| Product assortment | Identify competitor SKU expansion |
| Price | Detect price gaps |
| Discounts | Track promotional intensity |
| Search placement | Measure discoverability |
| Availability | Compare stock positions |
| Ratings | Track customer trust signals |
| Reviews | Identify product perception trends |
| Pack sizes | Detect assortment differentiation |
From 2020 to 2026, quick commerce evolved from a narrow convenience channel into a broader shopping destination. Swiggy's annual report describes expansion into categories such as home and kitchen, toys and stationery, and other non-grocery segments, while larger dark-store formats increased assortment capacity. (Swiggy)
This means competitor intelligence should not be limited to direct product matches. Brands should also monitor substitute products, adjacent categories, new pack sizes, promotional bundles, and emerging competitors.
For category teams, the goal is not simply to collect competitor prices. It is to understand why a shopper might encounter a competitor before encountering the brand's own product.
Quick commerce digital shelf monitoring for brands provides a structured view of how products appear to consumers across fast-commerce platforms. It combines product availability, content quality, pricing, promotions, search position, ratings, reviews, and competitor presence.
The need for this approach has increased as platforms have expanded their assortments and physical infrastructure. Swiggy reported that its larger dark-store formats could accommodate up to 20,000 SKUs, while its Megapods could support more than 50,000 SKUs across selected categories. (Swiggy)
More assortment creates more opportunities for brands but also more competition for attention.
| Digital Shelf Signal | Potential Business Impact |
|---|---|
| Missing product image | Lower product clarity |
| Incorrect product information | Customer confusion |
| Weak search placement | Lower discoverability |
| Out-of-stock status | Lost immediate purchase opportunity |
| Higher competitor discount | Reduced price competitiveness |
| Strong competitor ratings | Increased shopper consideration |
| Missing promotional badge | Lower offer visibility |
Between 2020 and 2026, digital shelf management shifted from static catalog management to continuous monitoring. Brands increasingly need historical data to identify recurring patterns rather than reacting to isolated observations.
A practical monitoring workflow should capture the same SKU repeatedly across platforms and locations. The resulting historical dataset can reveal whether availability is deteriorating, competitors are increasing promotional activity, or search visibility is changing.
For e-commerce and category managers, this creates a clearer connection between operational execution and shopper-facing visibility.
Quick commerce pricing and promotion intelligence helps brands monitor price changes, discounts, promotional mechanics, and competitor pricing across rapidly changing retail environments.
Price is especially important in quick commerce because consumers often compare alternatives directly within the same shopping session. A small difference in displayed price, discount, pack size, or promotional messaging can influence product consideration.
The broader market has also become more commercially sophisticated. Blinkit's FY25 average order value was ₹667, compared with ₹613 in FY24 and ₹541 in FY23, according to Eternal's FY25 annual-report data. (Scribd) Swiggy reported that Instamart's average order value reached ₹691 in FY26, up 34.4% year over year. (The Economic Times)
| Pricing Signal | What Brands Should Track |
|---|---|
| Base price | Current consumer-facing price |
| Discount | Absolute and percentage reduction |
| Promotional price | Price during campaigns |
| Competitor price | Relative category position |
| Pack-size price | Effective price comparison |
| Offer messaging | Visibility of promotions |
| Price history | Frequency and magnitude of changes |
From 2020 to 2026, pricing intelligence evolved from periodic competitor checks toward more frequent monitoring. The speed of quick commerce makes stale pricing data less useful because promotional conditions can change rapidly.
Brands should therefore analyze price together with stock and visibility. A lower competitor price matters differently when that competitor is also out of stock. Similarly, a brand's discount may not improve visibility if its product has poor search placement.
The actionable approach is to build a unified view of price + promotion + availability + placement. This provides a more complete explanation of competitive performance than price tracking alone.
Blinkit analytics can transform raw marketplace observations into actionable measures of assortment, availability, pricing, search visibility, competitor activity, and location-level performance. Combined with Quick Commerce Brand Visibility, these analytics can help teams identify where their products are visible, where performance is deteriorating, and which competitive signals require attention.
Blinkit's FY26 growth demonstrates the scale of the opportunity. Eternal reported 117% year-over-year growth in quick-commerce NOV to ₹48,567 crore, with 116% order growth and 2,243 stores by March 2026. (FinancialFilings)
At this scale, analytics should move beyond dashboards showing individual snapshots. Historical datasets can identify patterns such as recurring stockouts, declining search visibility, competitor price movements, changing assortment, and location-specific execution gaps.
| Analytics Layer | Example Insight |
|---|---|
| SKU analytics | Which products have visibility gaps? |
| Location analytics | Which areas have recurring stockouts? |
| Price analytics | Where are competitors undercutting? |
| Search analytics | Which products are losing discoverability? |
| Promotion analytics | Which offers are consistently visible? |
| Competitor analytics | Which brands are expanding their presence? |
| Historical analytics | Which issues are recurring rather than temporary? |
The 2020–2026 period shows why historical analysis matters. Quick commerce has progressed from a relatively narrow delivery proposition to a scaled retail ecosystem with wider assortment, more dark stores, and higher order volumes. Blinkit, Zepto, and Swiggy Instamart now operate at a scale where small execution gaps can occur across numerous locations simultaneously. (FinancialFilings)
For brands, analytics should therefore answer three questions: where is the product visible, where is it losing visibility, and what competitive or operational factor explains the change?
Actowiz Metrics helps brands build structured datasets for monitoring products across quick-commerce platforms. The approach can combine SKU-level information with location, pricing, availability, promotions, product content, rankings, ratings, reviews, and competitor information.
For brands operating across multiple platforms, the major advantage is consistency. Instead of relying on manual screenshots or periodic checks, businesses can create recurring monitoring workflows that capture marketplace conditions over time.
Zepto analytics can help brands analyze product availability, competitor assortment, price movements, and location-level performance. Similar workflows can be applied across Blinkit and Swiggy Instamart to create a unified competitive view.
| Data Layer | Monitoring Scope |
|---|---|
| Product data | SKU, brand, category, pack size |
| Pricing data | Listed price, discount, promotional price |
| Availability data | In-stock/out-of-stock status |
| Search data | Search visibility and product position |
| Promotion data | Offers and promotional messaging |
| Competitor data | Comparable products and prices |
| Location data | City, pincode, or service area |
| Historical data | Changes over time |
This enables brand managers, category heads, e-commerce teams, and revenue managers to identify issues faster and prioritize corrective actions.
For example, if a product repeatedly disappears from a high-demand location, the team can investigate inventory or replenishment. If availability remains strong but search visibility declines, the issue may require a merchandising or content review. If competitor prices consistently fall below the brand's position, the pricing team can evaluate the commercial context.
The objective is not simply to collect more data. It is to turn marketplace observations into a repeatable decision system.
The challenge facing brands in quick commerce is no longer only delivery speed. Platforms have built increasingly large fulfillment networks, expanded assortment, and reached more cities. Swiggy, for example, reported 1,143 active Instamart dark stores in FY2026, while Blinkit and Zepto also operated large and rapidly expanding networks. (The Economic Times)
Brands therefore need visibility into the entire digital shelf: availability, pricing, promotions, search placement, assortment, ratings, reviews, and competitors.
Swiggy Instamart analytics can provide another layer of marketplace intelligence by helping teams identify performance differences across products and locations. When these insights are combined with recurring data collection, brands can move from reactive marketplace checks to proactive digital shelf management.
The goal of Quick Commerce Brand Visibility is simple: make sure products are not only delivered quickly but are also easy to find, available to purchase, competitively positioned, and consistently represented wherever consumers shop.
Ready to turn quick-commerce marketplace data into actionable brand intelligence? Connect with Actowiz Metrics to build a scalable monitoring solution for your products, competitors, pricing, availability, and digital shelf performance across leading quick-commerce platforms!
Expert blogs, research reports and infographics — practical, data-driven reading across e-commerce and quick-commerce.
Most fields are optional — the more you share, the better your sample.
.webp "infographics")
.webp "infographics")