BLOG
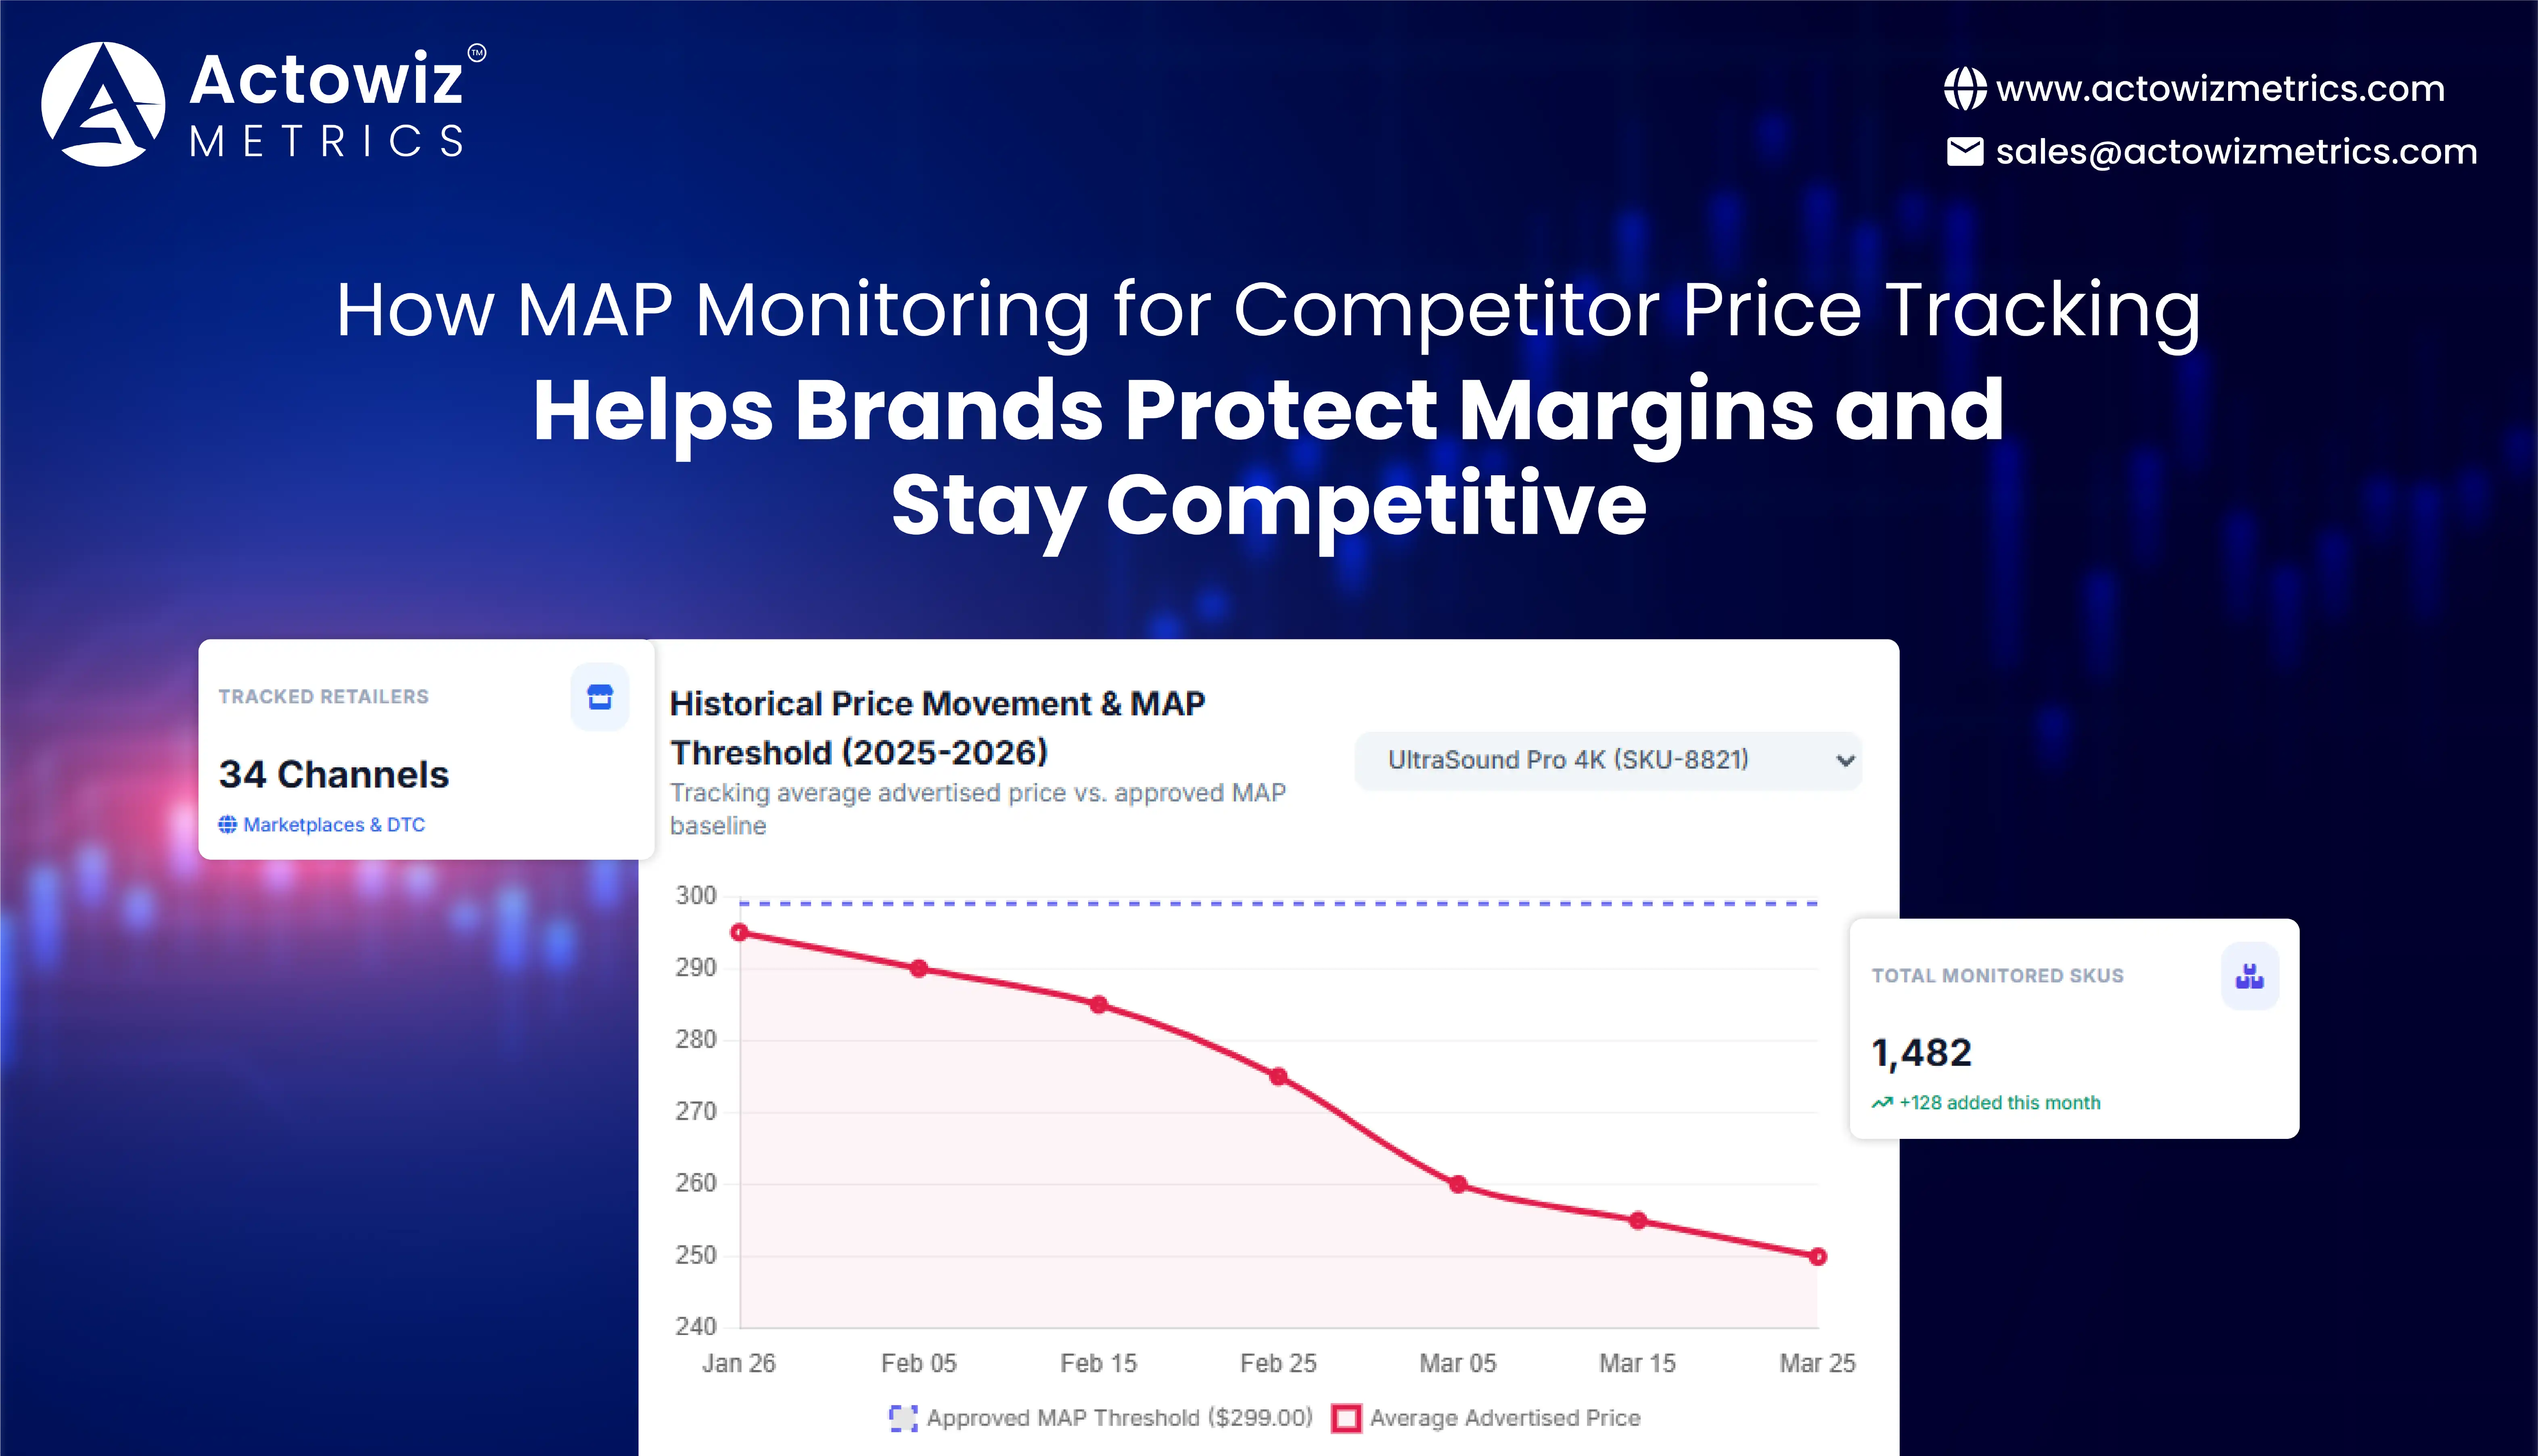




















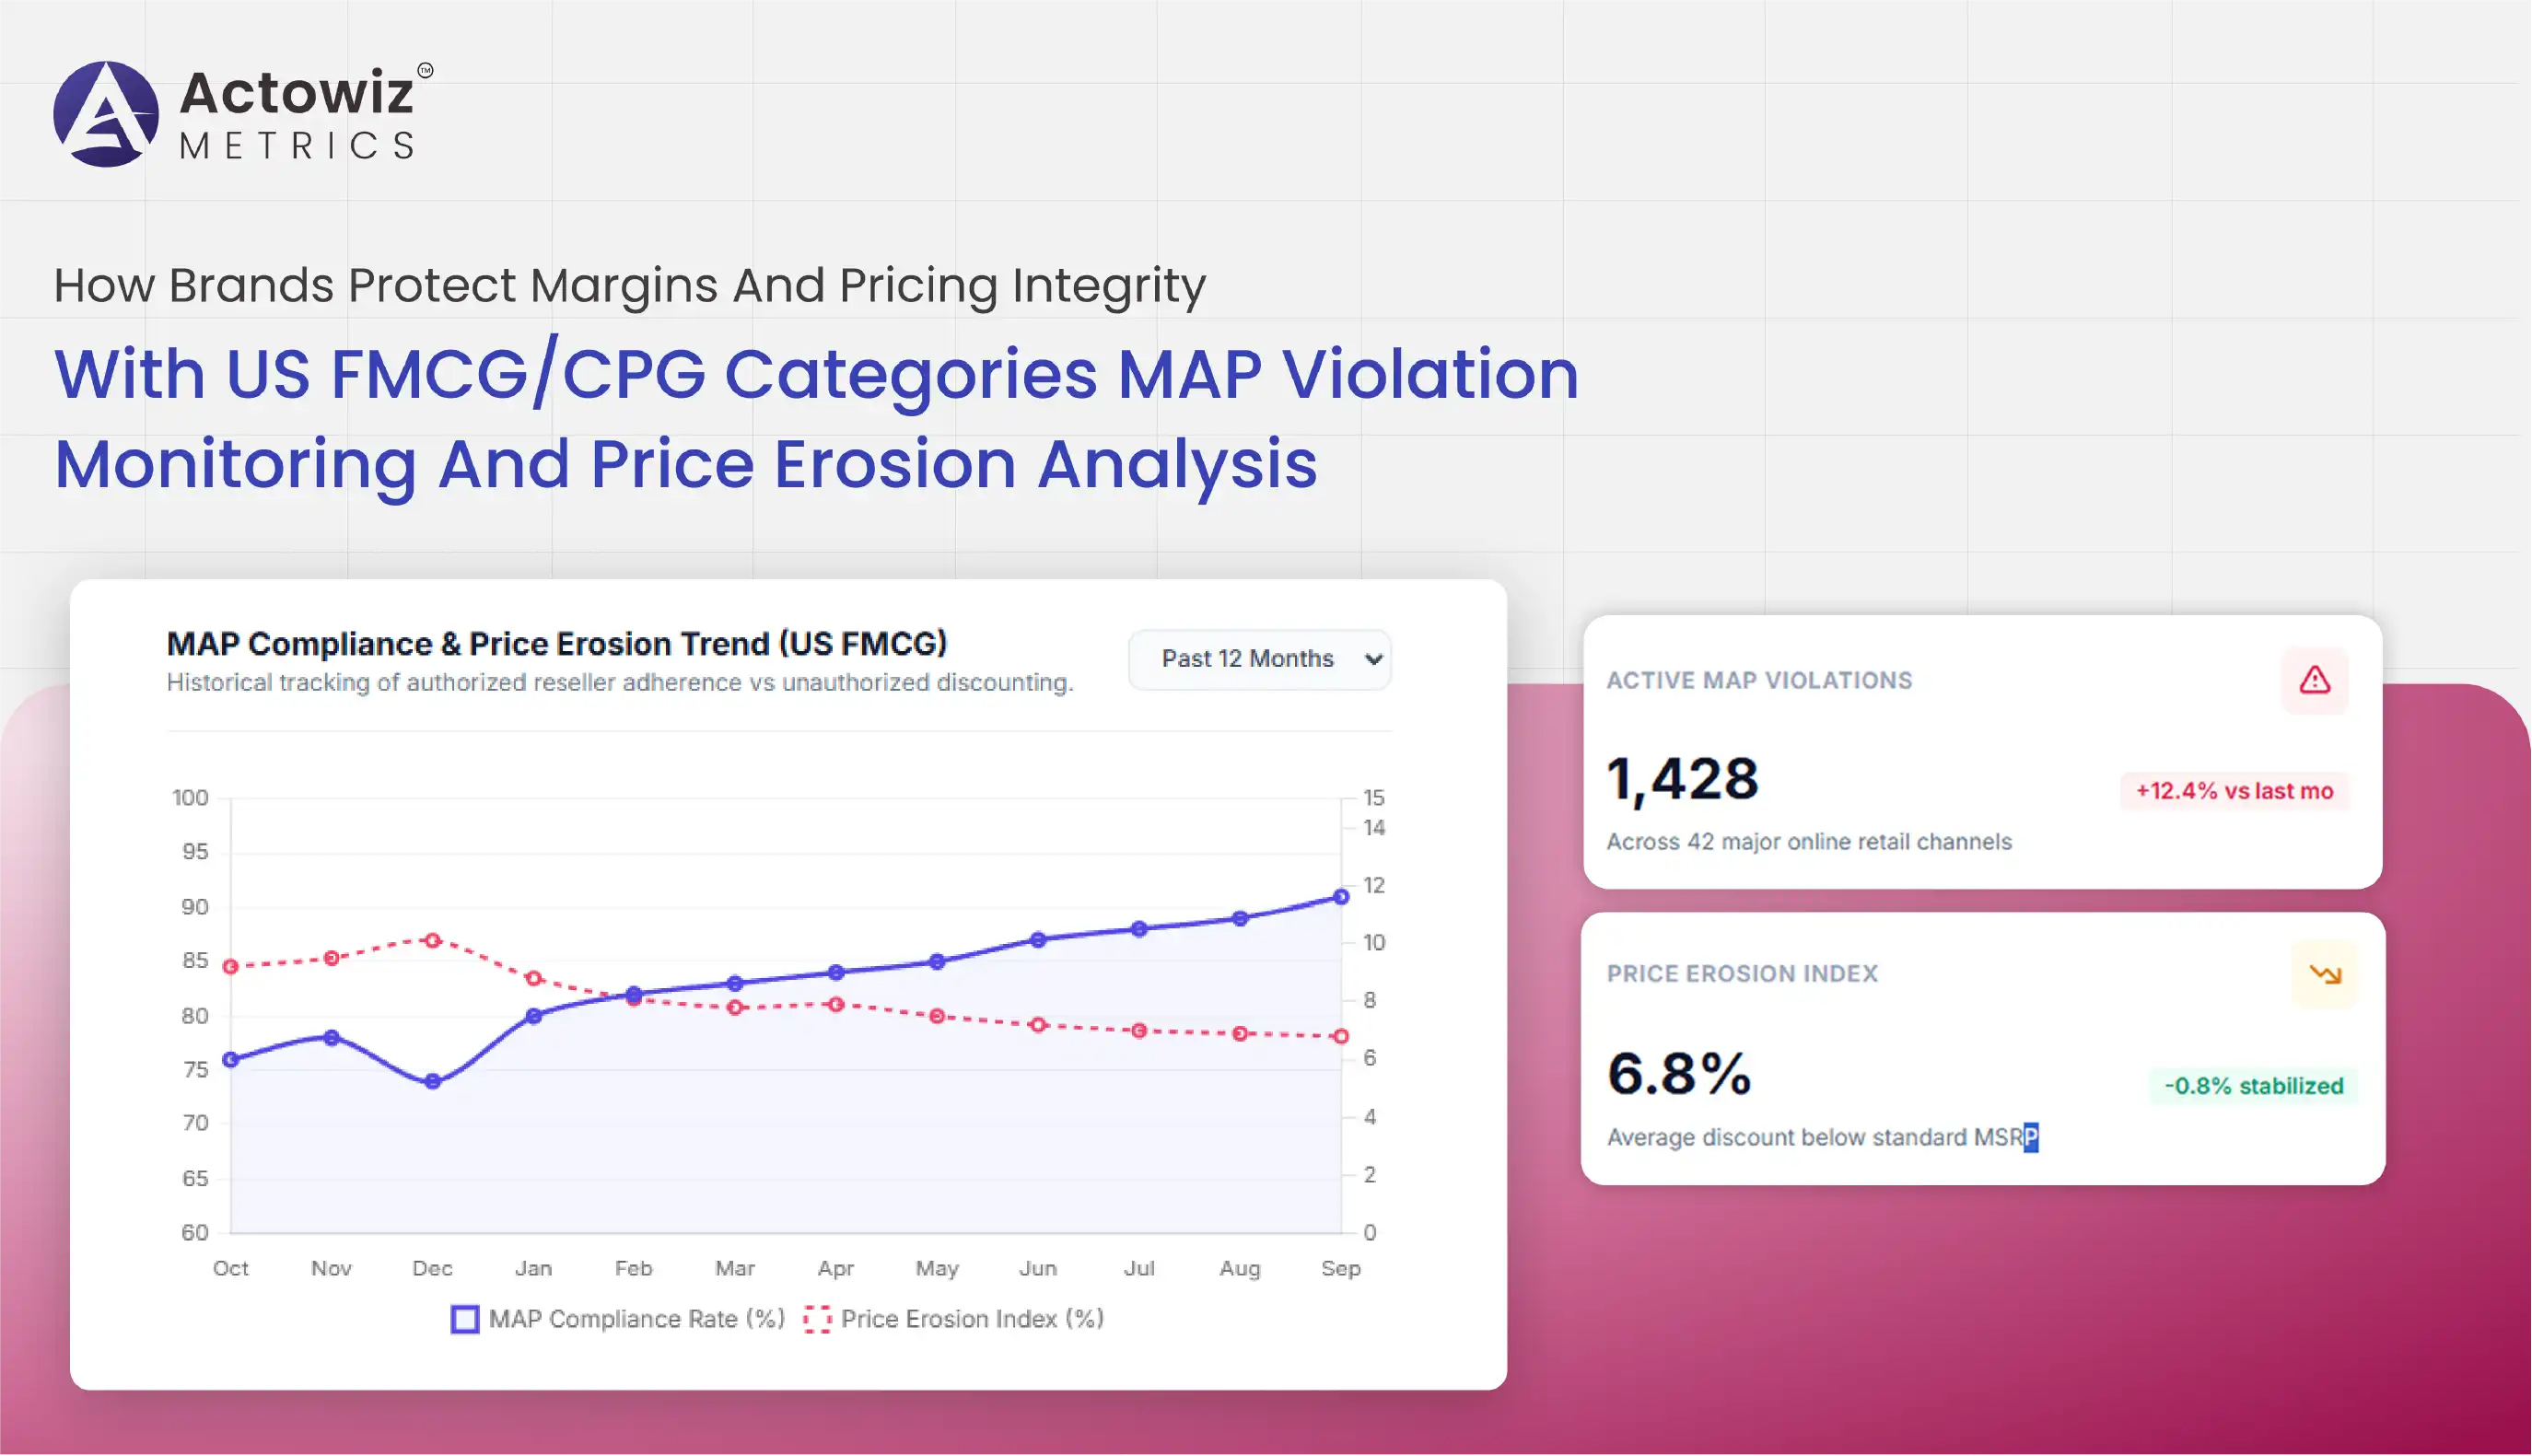
MAP Monitoring for Competitor Price Tracking helps brands identify unauthorized advertised price reductions, understand competitor pricing behavior, and protect their intended market positioning. For manufacturers, distributors, and consumer brands selling through multiple retailers and marketplaces, continuous price visibility is essential because advertised prices can change quickly across channels.
Effective monitoring also connects pricing observations with broader Competitor Analysis for Brands. Instead of checking retailer websites manually, brands can collect structured competitor price data, compare advertised prices against MAP policies, identify repeated violations, and prioritize retailers requiring attention. This creates a practical pricing intelligence workflow that supports brand protection and more consistent channel management.
The need is growing as e-commerce expands across marketplaces, direct-to-consumer websites, and omnichannel retail. U.S. retail e-commerce sales reached an estimated $1.23 trillion in 2025, according to the U.S. Census Bureau. A larger digital marketplace means more pricing observations to monitor and more opportunities for brands to detect deviations quickly.
Competitor Price Monitoring & MAP Compliance provides brands with a structured way to compare advertised prices across retailers, marketplaces, and product listings. MAP Monitoring for Competitor Price Tracking can collect product identifiers, retailer names, advertised prices, discounts, URLs, timestamps, and other accessible attributes needed for compliance analysis.
MAP, or Minimum Advertised Price, generally refers to a supplier's policy governing the minimum price at which a retailer may publicly advertise a product. It is important to distinguish an advertised-price policy from restrictions on the actual resale price. MAP policies and their legal implications can vary by jurisdiction and business arrangement, so brands should have their policies reviewed by appropriate legal counsel.
A practical monitoring system starts by creating a standardized product catalog. Each monitored SKU can be associated with its approved MAP threshold, brand, category, retailer, marketplace, and relevant geographic market. New observations can then be compared with the applicable threshold.
| Data Field | Purpose |
|---|---|
| Product/SKU ID | Identifies the monitored item |
| Brand | Groups products by manufacturer |
| Retailer | Identifies the selling channel |
| Advertised price | Measures current public pricing |
| MAP threshold | Establishes the comparison point |
| Discount | Identifies promotional reductions |
| Product URL | Enables listing verification |
| Timestamp | Establishes when the price was observed |
| Availability | Separates active from unavailable listings |
From 2020 through 2026, the growth of online retail has made price compliance more complex because consumers can compare offers across numerous digital channels. In the United States, e-commerce represented 16.1% of total retail sales in 2020, according to Census Bureau estimates. By 2025, annual U.S. e-commerce sales were estimated at $1.2337 trillion, representing 16.4% of total retail sales. The change is not simply about online sales volume; it also increases the number of public pricing points available to consumers and competitors. Between 2020 and 2026, brands increasingly needed monitoring systems capable of handling marketplaces, retailer websites, DTC stores, and multiple product variants. Automated collection can provide timestamped observations instead of relying on occasional manual checks. For pricing teams, this creates a historical record of advertised-price behavior. For channel managers, it can reveal which retailers repeatedly diverge from approved pricing policies. For executives, it provides a clearer view of whether pricing discipline is consistent across channels. The most effective programs therefore treat MAP compliance as an ongoing data-monitoring process rather than an occasional spreadsheet exercise.
MAP Violation Detection & Competitor Pricing becomes more effective when brands move from periodic checks to systematic exception detection. A monitoring workflow can compare observed advertised prices with product-specific thresholds and flag records that require investigation.
Not every low price should automatically be treated as a confirmed violation. Data can contain legitimate promotions, bundle offers, coupons, membership pricing, clearance activity, regional differences, or product-variant mismatches. Brands should therefore establish validation rules before escalating an observation.
A useful system can classify observations into categories such as compliant, below threshold, unavailable, unclear, or requiring manual verification. This reduces false positives and allows pricing teams to focus their attention on meaningful exceptions.
| Metric | What It Shows |
|---|---|
| MAP variance | Difference between advertised price and threshold |
| Violation frequency | Repeated occurrence by retailer |
| SKU coverage | Share of catalog being monitored |
| Retailer coverage | Number of monitored sellers |
| Violation duration | How long a deviation remains visible |
| Price-change frequency | Speed of price movement |
The 2020–2026 period has seen retailers and brands increasingly rely on digital pricing systems that can change product prices rapidly. A manual process that checks a limited number of websites once a week may miss short-lived price changes that disappear before the next review. This makes historical and timestamped data particularly valuable. Brands can compare the same SKU across multiple observation periods and distinguish isolated changes from recurring behavior. The growth of marketplace commerce also means that one brand can encounter many sellers offering similar or identical products. In 2022, U.S. retail e-commerce sales reached $1.034 trillion, while 2023 sales increased to approximately $1.118 trillion. By 2024, annual U.S. e-commerce sales were estimated at $1.1926 trillion. This expanding digital environment creates more data points for pricing teams to evaluate. During 2025 and 2026, brands can improve response times by combining automated price collection with threshold-based rules, retailer-level histories, and alerting systems. The goal is not simply to identify the cheapest listing. It is to establish a reliable evidence trail showing where, when, and how advertised pricing differed from the relevant policy.
Minimum Advertised Price Monitoring for Brands gives manufacturers and brand owners a structured view of advertised pricing across their authorized sales network. Consistent visibility can help identify channel inconsistencies, understand discounting patterns, and provide evidence for conversations with retailers or distributors.
A brand may manage thousands of products across multiple channels. Monitoring all of those products manually can become difficult as catalogs expand. Automated data collection can instead create recurring observations for priority SKUs and retailers.
Brands can also segment monitoring by category, product line, geography, retailer type, or marketplace. This allows teams to identify where pricing pressure is concentrated.
| Indicator | Business Question |
|---|---|
| Average advertised price | What is the typical market price? |
| Lowest advertised price | Where is the strongest price pressure? |
| MAP compliance rate | How consistently is policy followed? |
| Violations by retailer | Which channels require attention? |
| Violations by SKU | Which products are most affected? |
| Historical price movement | Is pricing becoming more volatile? |
Digital retail's continued expansion has increased the importance of consistent price visibility. In 2024, U.S. e-commerce sales increased 8.1% from 2023, while total retail sales increased 2.8%, according to Census Bureau estimates. This difference illustrates how quickly digital channels can become important sources of commercial activity and pricing information. From 2020 onward, consumers have also become accustomed to comparing prices across websites and marketplaces before purchasing. For brands, that behavior means an advertised price can influence perceptions of value even when the brand does not control the final transaction price. By 2026, monitoring programs can combine product-level observations with retailer, category, geographic, and temporal dimensions. Historical datasets help brands understand whether a deviation is isolated or part of a broader pattern. They can also help identify products that experience frequent discounting and categories where competitive pressure is particularly strong. The operational benefit is improved visibility: instead of discovering pricing inconsistencies through customer complaints or occasional manual research, teams can establish repeatable monitoring processes. This allows brand managers to investigate exceptions with greater context and maintain a documented record of observed marketplace conditions.
Competitor Price Data for MAP Compliance gives brands the historical evidence needed to understand how advertised prices change over time. MAP Monitoring for Competitor Price Tracking becomes more powerful when individual price observations are stored as a time series instead of being overwritten after each collection cycle.
Historical data can answer questions that a single price snapshot cannot. Brands can determine how frequently a retailer advertised below the threshold, whether the same SKU repeatedly experienced deviations, and whether pricing changes occurred around major promotional periods.
The same dataset can support broader competitive research. A brand can compare its products against competitor products, calculate price gaps, monitor category pricing, and identify emerging discount patterns.
| Measure | Application |
|---|---|
| Daily price history | Tracks short-term movement |
| Weekly average | Smooths temporary fluctuations |
| Minimum price | Identifies lowest observed positioning |
| MAP variance | Measures policy deviation |
| Violation count | Measures recurrence |
| Retailer trend | Identifies channel behavior |
The value of historical price data increased as e-commerce became more dynamic between 2020 and 2026. During the pandemic period, retailers experienced significant shifts in consumer demand and online purchasing behavior, followed by normalization and continued digital expansion. The result is a pricing environment where historical context matters. A price observed once may not represent a retailer's normal positioning. A six-month or twelve-month dataset can reveal recurring discount windows, seasonal movements, promotional behavior, and repeated deviations. U.S. Census Bureau data shows that quarterly e-commerce sales continued to grow through 2025, reaching an estimated $316.1 billion in the fourth quarter of 2025. For brands, this means monitoring can increasingly be treated as a longitudinal analytics problem. Data collected in 2026 can be compared with observations from previous years to identify structural changes in retailer behavior. Historical datasets also provide context when a brand reviews a suspected violation. Teams can see whether the retailer has previously advertised the SKU below the threshold, how long the listing remained at that level, and whether competitors made similar moves. This evidence-based approach can improve internal investigations while reducing reliance on isolated screenshots or manually maintained records.
Competitor Price Tracking & Pricing Intelligence connects MAP monitoring with broader market analysis. While MAP compliance focuses on a brand's pricing policy, competitor intelligence examines the wider pricing environment surrounding each product.
Brands can collect competitor product prices, retailer prices, promotions, stock status, product positioning, and other accessible information. When these records are standardized, analysts can calculate price gaps and identify changes in market positioning.
For example, a brand might discover that its MAP threshold remains unchanged while competitors consistently reduce advertised prices. That insight does not automatically mean the brand should change its policy, but it gives pricing teams evidence for reviewing market conditions, promotional strategies, and channel economics.
| Metric | Insight |
|---|---|
| Competitor price gap | Measures relative positioning |
| Price index | Compares prices against a benchmark |
| Promotion frequency | Tracks discount intensity |
| Assortment overlap | Measures competing product coverage |
| Availability rate | Shows market presence |
| Price volatility | Measures market movement |
From 2020 to 2026, pricing intelligence evolved from periodic competitor checks toward continuous digital monitoring. As online retail became a larger portion of total commerce, competitor prices became easier for consumers and businesses to observe. The U.S. Census Bureau reported annual e-commerce sales of approximately $1.1926 trillion in 2024 and $1.2337 trillion in 2025. For pricing teams, this expanding digital marketplace creates opportunities to collect larger volumes of comparable observations. Between 2020 and 2026, brands can increasingly combine competitor pricing with product attributes, retailer information, category data, and availability signals. This creates a richer analytical framework than simply recording the lowest price. Analysts can evaluate whether a competitor's price change is associated with a promotion, product variation, inventory movement, or broader category trend. Brands can also compare pricing behavior across retailers to identify channel-specific patterns. In 2026, the strongest pricing intelligence workflows can connect historical observations with current monitoring, allowing teams to understand both what is happening now and how current conditions compare with previous periods. This supports more informed discussions around pricing policies, promotions, assortment, and channel strategy without relying solely on manual market checks.
MAP Monitoring can become significantly more efficient when data collection, validation, comparison, and reporting are automated. Instead of asking employees to repeatedly search hundreds of retailer pages, brands can establish scheduled workflows that collect accessible pricing information and organize it into structured datasets.
An automated workflow can monitor selected SKUs and retailers at defined intervals. The resulting data can be normalized, validated, timestamped, and compared against relevant thresholds. Exceptions can then be routed to dashboards or alerting systems for review.
Automation also creates consistency. Every monitoring cycle can follow the same data schema and validation rules, making historical comparisons easier.
| Capability | Result |
|---|---|
| Scheduled collection | Regular market observations |
| Product matching | Consistent SKU comparison |
| Price comparison | Automated threshold checks |
| Historical storage | Trend analysis |
| Exception alerts | Faster investigation |
| Dashboard integration | Centralized visibility |
Automation became increasingly relevant as digital commerce expanded and the volume of pricing information increased. In 2020, many brands could still rely on relatively small manual competitor-monitoring programs, but the increasing number of marketplaces, retailers, product variants, and promotional events made manual approaches harder to scale. By 2024 and 2025, U.S. e-commerce sales had exceeded $1.19 trillion and $1.23 trillion respectively, according to Census Bureau estimates. This scale creates a practical case for automated data infrastructure. During 2026, brands can design monitoring systems that combine collection with product matching, price normalization, threshold comparisons, historical storage, and reporting. The objective is not to automate every business decision. Instead, automation can handle repetitive data tasks while pricing and channel teams focus on interpretation and follow-up. A well-designed system can also improve auditability by preserving timestamps and source URLs for observations. When brands can access current and historical records from a centralized dataset, they can investigate pricing anomalies more efficiently and identify recurring patterns. The result is a scalable monitoring framework that supports brand protection, competitor research, pricing intelligence, and channel management across a growing digital retail environment.
Actowiz Metrics can help brands turn fragmented marketplace and retailer pricing information into structured datasets for competitive intelligence and pricing analysis. Its data workflows can be designed around product catalogs, retailer lists, marketplaces, geographic markets, categories, and monitoring frequency.
For brands looking for Top Brand Promotion Strategies for Smart Pricing & Promotion, structured pricing intelligence can provide the evidence required to understand market conditions before, during, and after promotional campaigns.
Actowiz Metrics can collect accessible product and pricing information, normalize records, validate product matches, and organize historical observations for analysis. Brands can use these datasets to compare advertised prices, identify pricing changes, analyze retailer behavior, and monitor product availability.
MAP Monitoring for Competitor Price Tracking can also be incorporated into recurring data workflows. Instead of maintaining separate manual spreadsheets for each retailer, brands can create centralized datasets that support dashboards, reports, exception analysis, and historical comparisons.
The resulting intelligence can help pricing teams answer practical questions: Which products are changing price? Which retailers are repeatedly outside the expected advertised-price range? How does competitor pricing compare with the brand's positioning? Which categories show the strongest price pressure?
For organizations managing large catalogs, automated collection can also improve scalability. Monitoring rules can be applied consistently across thousands of products and multiple sales channels, while historical records can be retained for trend analysis.
Brands need continuous pricing visibility to protect channel consistency and understand competitive market movements. MAP Compliance Monitoring Analytics can transform recurring price observations into structured intelligence by connecting product information, advertised prices, retailers, timestamps, and historical trends.
Between 2020 and 2026, the expansion of digital commerce increased both the volume and frequency of publicly visible pricing changes. U.S. e-commerce sales reached an estimated $1.2337 trillion in 2025, according to the Census Bureau. This scale makes manual monitoring increasingly difficult for brands managing large catalogs and numerous retail partners.
A structured monitoring program can help brands identify pricing anomalies, investigate recurring patterns, compare competitor positioning, and maintain better visibility across digital channels. Historical datasets also make it possible to distinguish isolated changes from persistent pricing behavior.
Ready to strengthen your pricing intelligence? Connect with Actowiz Metrics to build scalable competitor price and MAP monitoring datasets for smarter brand and channel decisions!
Expert blogs, research reports and infographics — practical, data-driven reading across e-commerce and quick-commerce.
Most fields are optional — the more you share, the better your sample.
.webp "infographics")
.webp "infographics")