BLOG


Australia’s liquor retail market is becoming increasingly competitive as consumers compare prices across liquor chains, supermarkets, online delivery apps, and specialty beverage stores. In this evolving environment, businesses need accurate pricing intelligence to optimize promotions, track competitors, and understand buying behavior. This is where Liquor Price Analytics in Liquor Stores & Grocery Stores - Australia becomes essential for data-driven retail success.
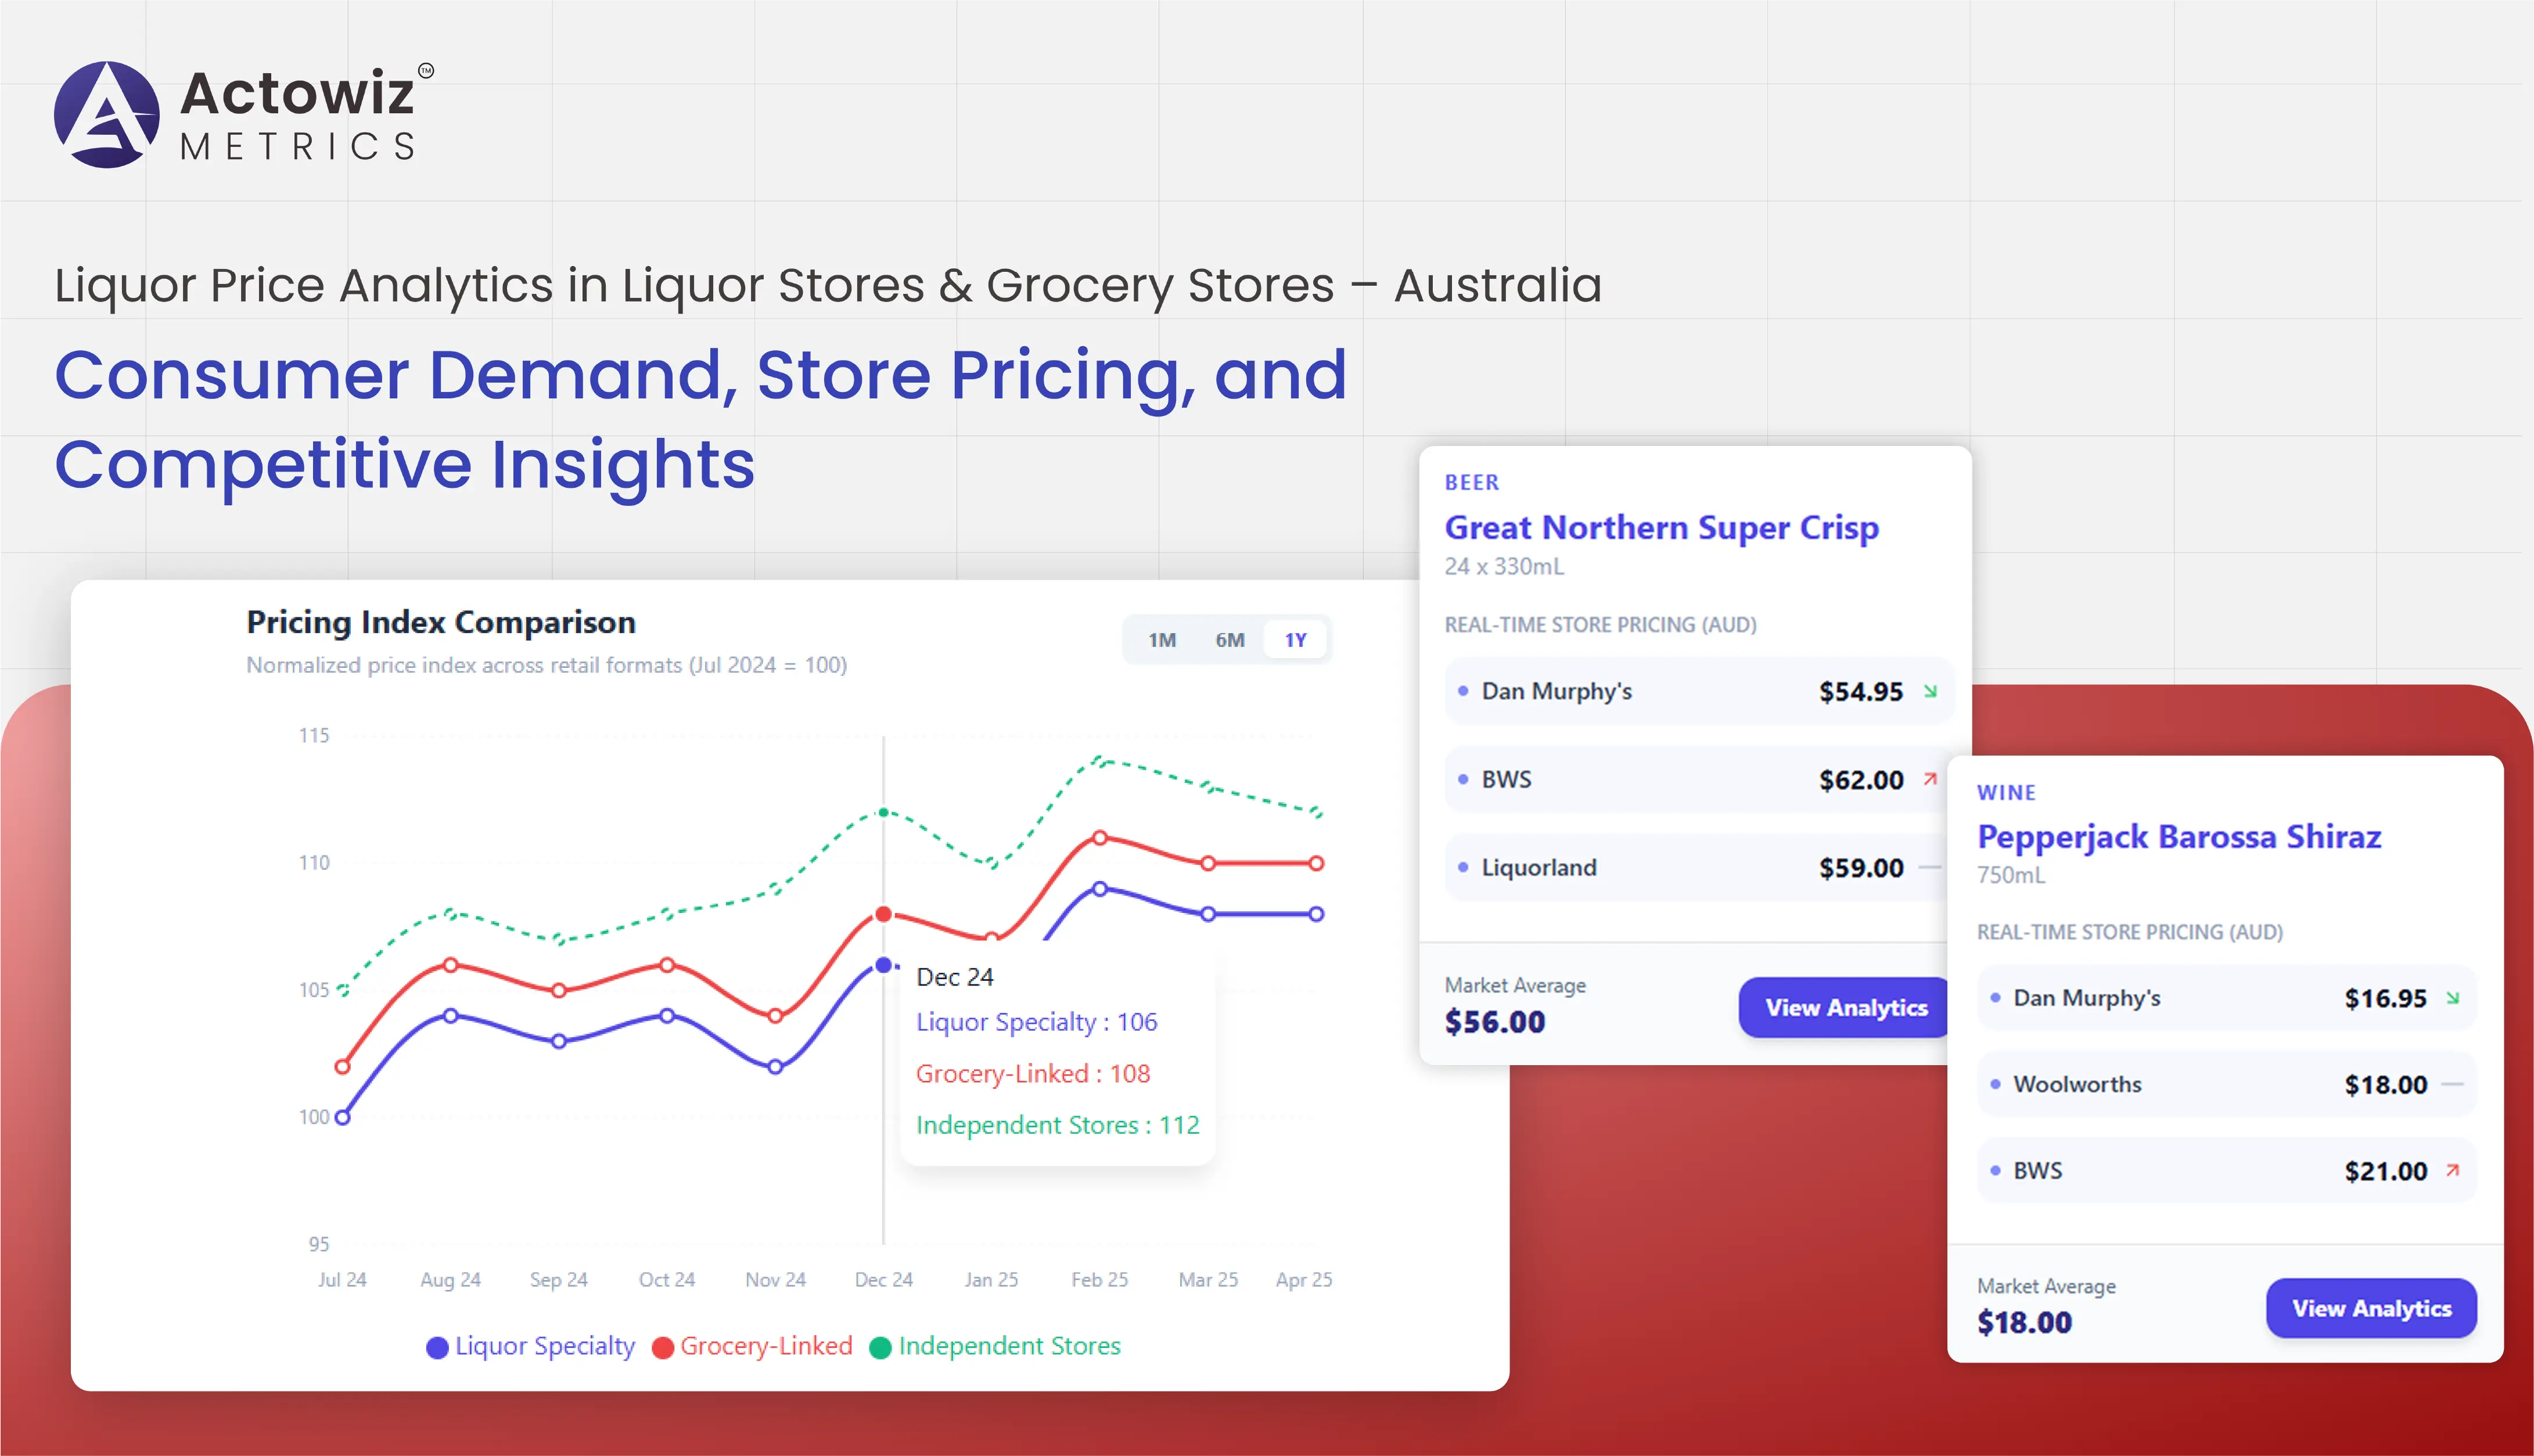
From wine and beer to premium spirits and ready-to-drink beverages, pricing in Australia varies significantly by location, retailer, season, and promotional activity. With advanced Liquor Data Analytics, retailers, distributors, and beverage brands can monitor shelf pricing, detect market shifts, and improve category strategies.
As inflation, taxes, logistics costs, and consumer preferences reshape liquor purchasing decisions, real-time pricing visibility has become critical. This research report explores how liquor price intelligence helps businesses improve competitive positioning, optimize store pricing, and forecast demand across Australia’s liquor retail ecosystem between 2020 and 2026.
To compete effectively, beverage brands and retailers must understand how prices vary across stores, regions, and product categories. The first step is to Extract Alcohol Prices from Australian Retail Stores to capture live shelf prices, discounts, bundle offers, and seasonal markdowns.
Alcohol price extraction helps businesses:
This data supports better:
| Year | Avg Liquor SKU Price (AUD) | Promo Share (%) | Consumer Price Sensitivity (%) |
|---|---|---|---|
| 2020 | 22.5 | 18 | 41 |
| 2021 | 23.2 | 20 | 44 |
| 2022 | 24.6 | 22 | 47 |
| 2023 | 26.1 | 25 | 51 |
| 2024 | 27.4 | 28 | 54 |
| 2025 | 28.8 | 31 | 57 |
| 2026 | 30.3 | 34 | 60 |
Retailers using live pricing intelligence improve response to competitor changes by up to 35%.
As liquor retail increasingly shifts online, businesses need stronger visibility into digital shelf pricing and promotions. This is where Web Scraping Liquor Prices in Australia, Digital Shelf Analytics delivers strategic value.
Web scraping enables:
Digital shelf analytics helps:
| Metric | Traditional Monitoring | Digital Shelf Analytics |
|---|---|---|
| Promo Response Speed | Slow | Fast |
| Price Update Accuracy | 61% | 92% |
| Stock Visibility | Limited | High |
| Shelf Optimization | Low | Strong |
Brands using digital shelf insights improve online conversion rates and reduce missed sales opportunities.
Supermarkets are a major alcohol sales channel in Australia, offering competitive prices and promotional bundles. Businesses can gain strong market insights when they Scrape Alcohol Prices from Australian Supermarkets.
Supermarket price scraping helps monitor:
Key benefits:
| Year | Grocery Liquor Share (%) | Avg Promo Discount (%) |
|---|---|---|
| 2020 | 36 | 11 |
| 2021 | 38 | 13 |
| 2022 | 41 | 15 |
| 2023 | 44 | 18 |
| 2024 | 47 | 20 |
| 2025 | 50 | 22 |
| 2026 | 53 | 24 |
Supermarket insights help brands fine-tune pricing and improve retail partnerships.
Liquor prices often fluctuate based on promotions, stock levels, holidays, and competitor actions. Businesses need to Track Daily Liquor Prices Across Australian Retailers to stay agile in a volatile market.
Daily tracking supports:
Use cases include:
| Year | Avg Monthly Price Changes per SKU | Retail Promo Frequency (%) |
|---|---|---|
| 2020 | 2.1 | 19 |
| 2021 | 2.5 | 22 |
| 2022 | 3.0 | 25 |
| 2023 | 3.6 | 29 |
| 2024 | 4.1 | 33 |
| 2025 | 4.7 | 36 |
| 2026 | 5.2 | 40 |
Daily pricing intelligence improves retail decision-making and promotional efficiency.
Australia’s liquor retail landscape varies significantly by region, retailer format, and customer demographics. Businesses can gain local market visibility through Australian Liquor Store Price Data Extraction.
Store-level insights help:
| Region | Avg Wine Price (AUD) | Avg Spirit Price (AUD) |
|---|---|---|
| Sydney | 28 | 46 |
| Melbourne | 27 | 44 |
| Brisbane | 26 | 42 |
| Perth | 29 | 47 |
| Adelaide | 25 | 41 |
Regional data helps brands localize pricing and improve store-level execution.
Grocery stores offer large-scale alcohol sales opportunities. Businesses can scale category insights using Australia Liquor Price Scraper from Grocery Stores to monitor assortment, pricing, and promotions across chains.
Grocery liquor intelligence helps:
| Year | Grocery Alcohol Analytics Spend (AUD Million) |
|---|---|
| 2020 | 180 |
| 2021 | 215 |
| 2022 | 256 |
| 2023 | 304 |
| 2024 | 362 |
| 2025 | 428 |
| 2026 | 501 |
Scalable grocery intelligence improves national pricing strategies and category performance.
Actowiz Metrics helps beverage brands, retailers, and distributors gain complete visibility into Australia’s liquor retail pricing ecosystem.
Our capabilities include:
We specialize in Price Benchmarking and advanced Liquor Price Analytics in Liquor Stores & Grocery Stores - Australia to help brands improve pricing strategy, margin control, and market performance.
Actowiz Metrics delivers:
Our analytics empower businesses to make faster, smarter retail decisions.
Australia’s liquor retail market is evolving fast, with rising price sensitivity, growing digital competition, and frequent promotional shifts. Businesses that invest in pricing intelligence gain a significant edge in demand forecasting, promotion planning, and market positioning.
With advanced Product Data Tracking and Liquor Price Analytics in Liquor Stores & Grocery Stores - Australia, businesses can improve profitability, respond to competitor moves faster, and optimize retail strategies.
Partner with Actowiz Metrics to unlock actionable liquor price intelligence and transform your retail growth strategy with smarter data.
Contact Actowiz Metrics today to access accurate, scalable, and real-time liquor pricing insights tailored to your business needs!
Expert blogs, research reports and infographics — practical, data-driven reading across e-commerce and quick-commerce.
Most fields are optional — the more you share, the better your sample.


.webp "infographics")
.webp "infographics")


