BLOG


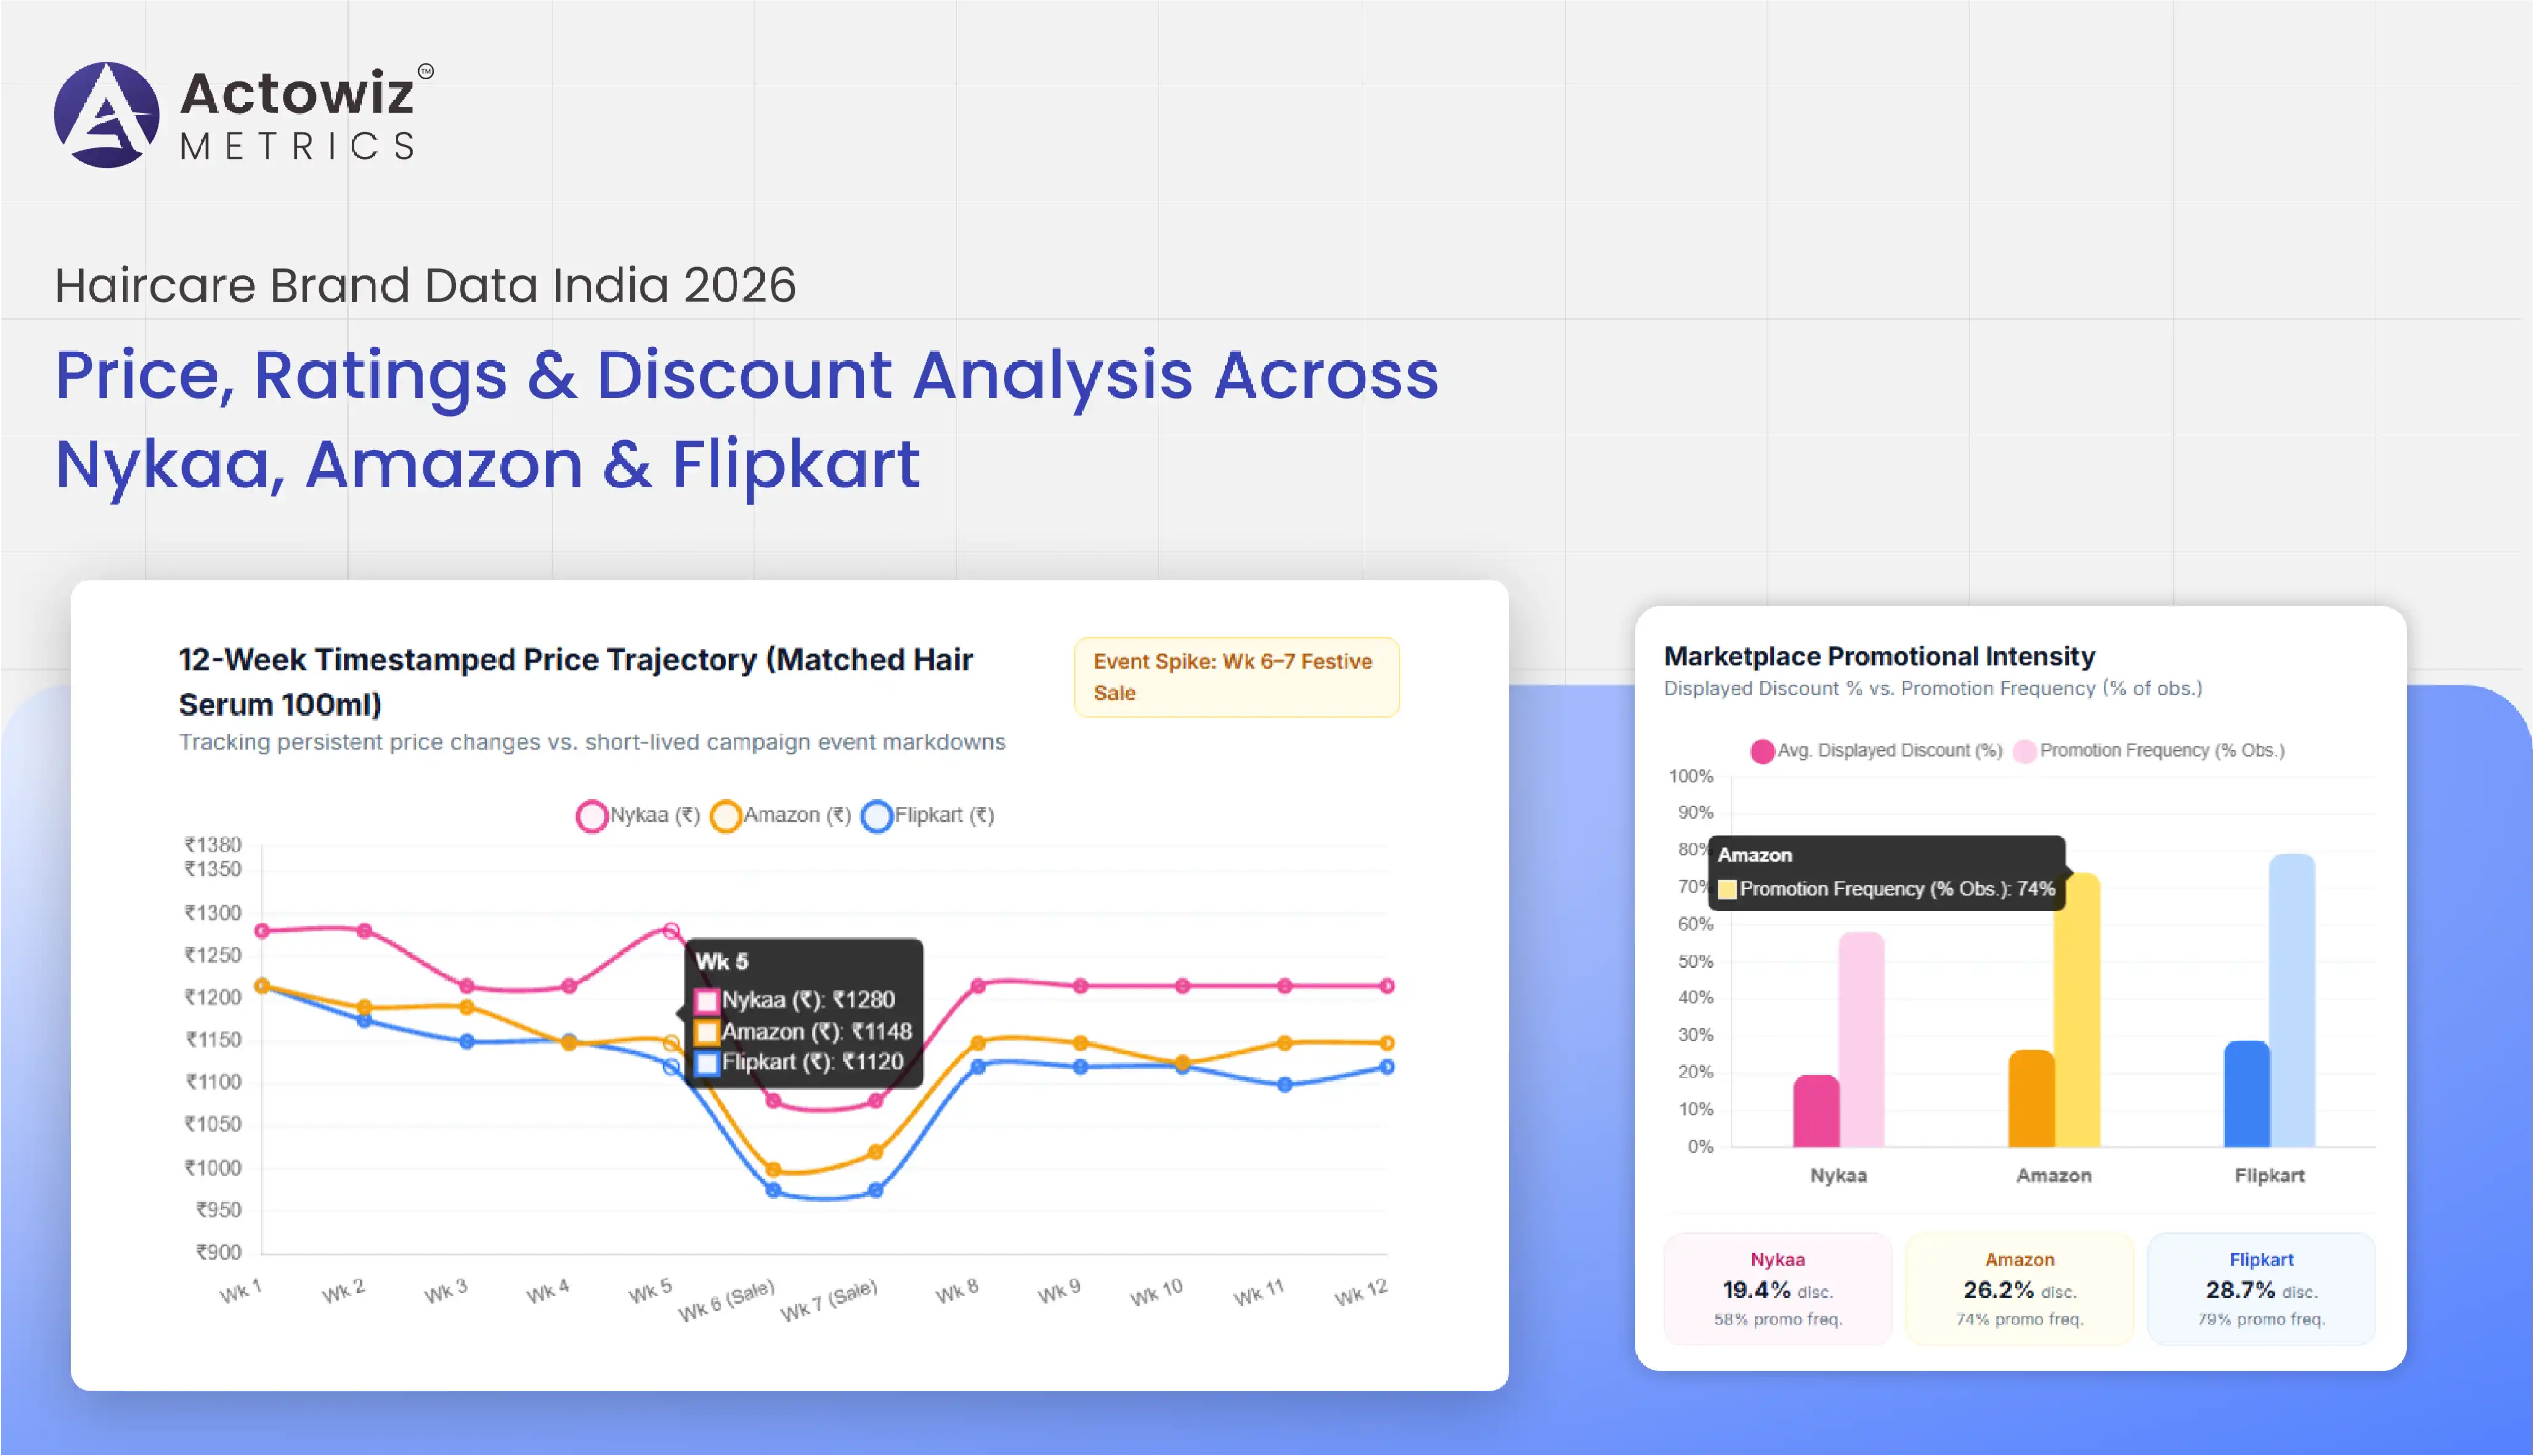
In 2026, haircare brands in India need reliable marketplace data to compare prices, monitor discounts, understand customer feedback, and evaluate competing products across Nykaa, Amazon, and Flipkart. haircare brand data India can support these decisions when product listings are matched consistently and observations are tracked over time. For brands selling through marketplaces and direct-to-consumer channels, E-commerce & D2C analytics connects pricing, assortment, ratings, and review trends to practical decisions about positioning, promotions, and product performance.
The central challenge is comparability. A shampoo listed in different pack sizes, a conditioner sold in a bundle, and a hair serum offered with a coupon are not directly equivalent products. A dependable report must distinguish listed prices from effective promotional prices, preserve pack-size information, and separate verified observations from assumptions. This report uses public market indicators and official platform resources to establish the research framework. It does not invent a cross-marketplace ranking or claim live 2026 product prices without a verified, dated product dataset.
India D2C haircare brand market intelligence 2026 should combine market-level demand signals with product-level marketplace observations. The broader beauty and personal care industry provides important context, but its growth figures should not be presented as haircare-only statistics. Brands need to understand both the market’s direction and how individual products perform across retail channels.
The India Brand Equity Foundation (IBEF), citing NielsenIQ, reported that beauty e-commerce and quick-commerce sales grew 39% in value between June and November 2024 compared with the same period in 2023. The report also noted that the share of Indian consumers purchasing beauty products online increased from 13% in 2023 to 17% in 2024. These figures cover beauty products broadly, rather than haircare alone.
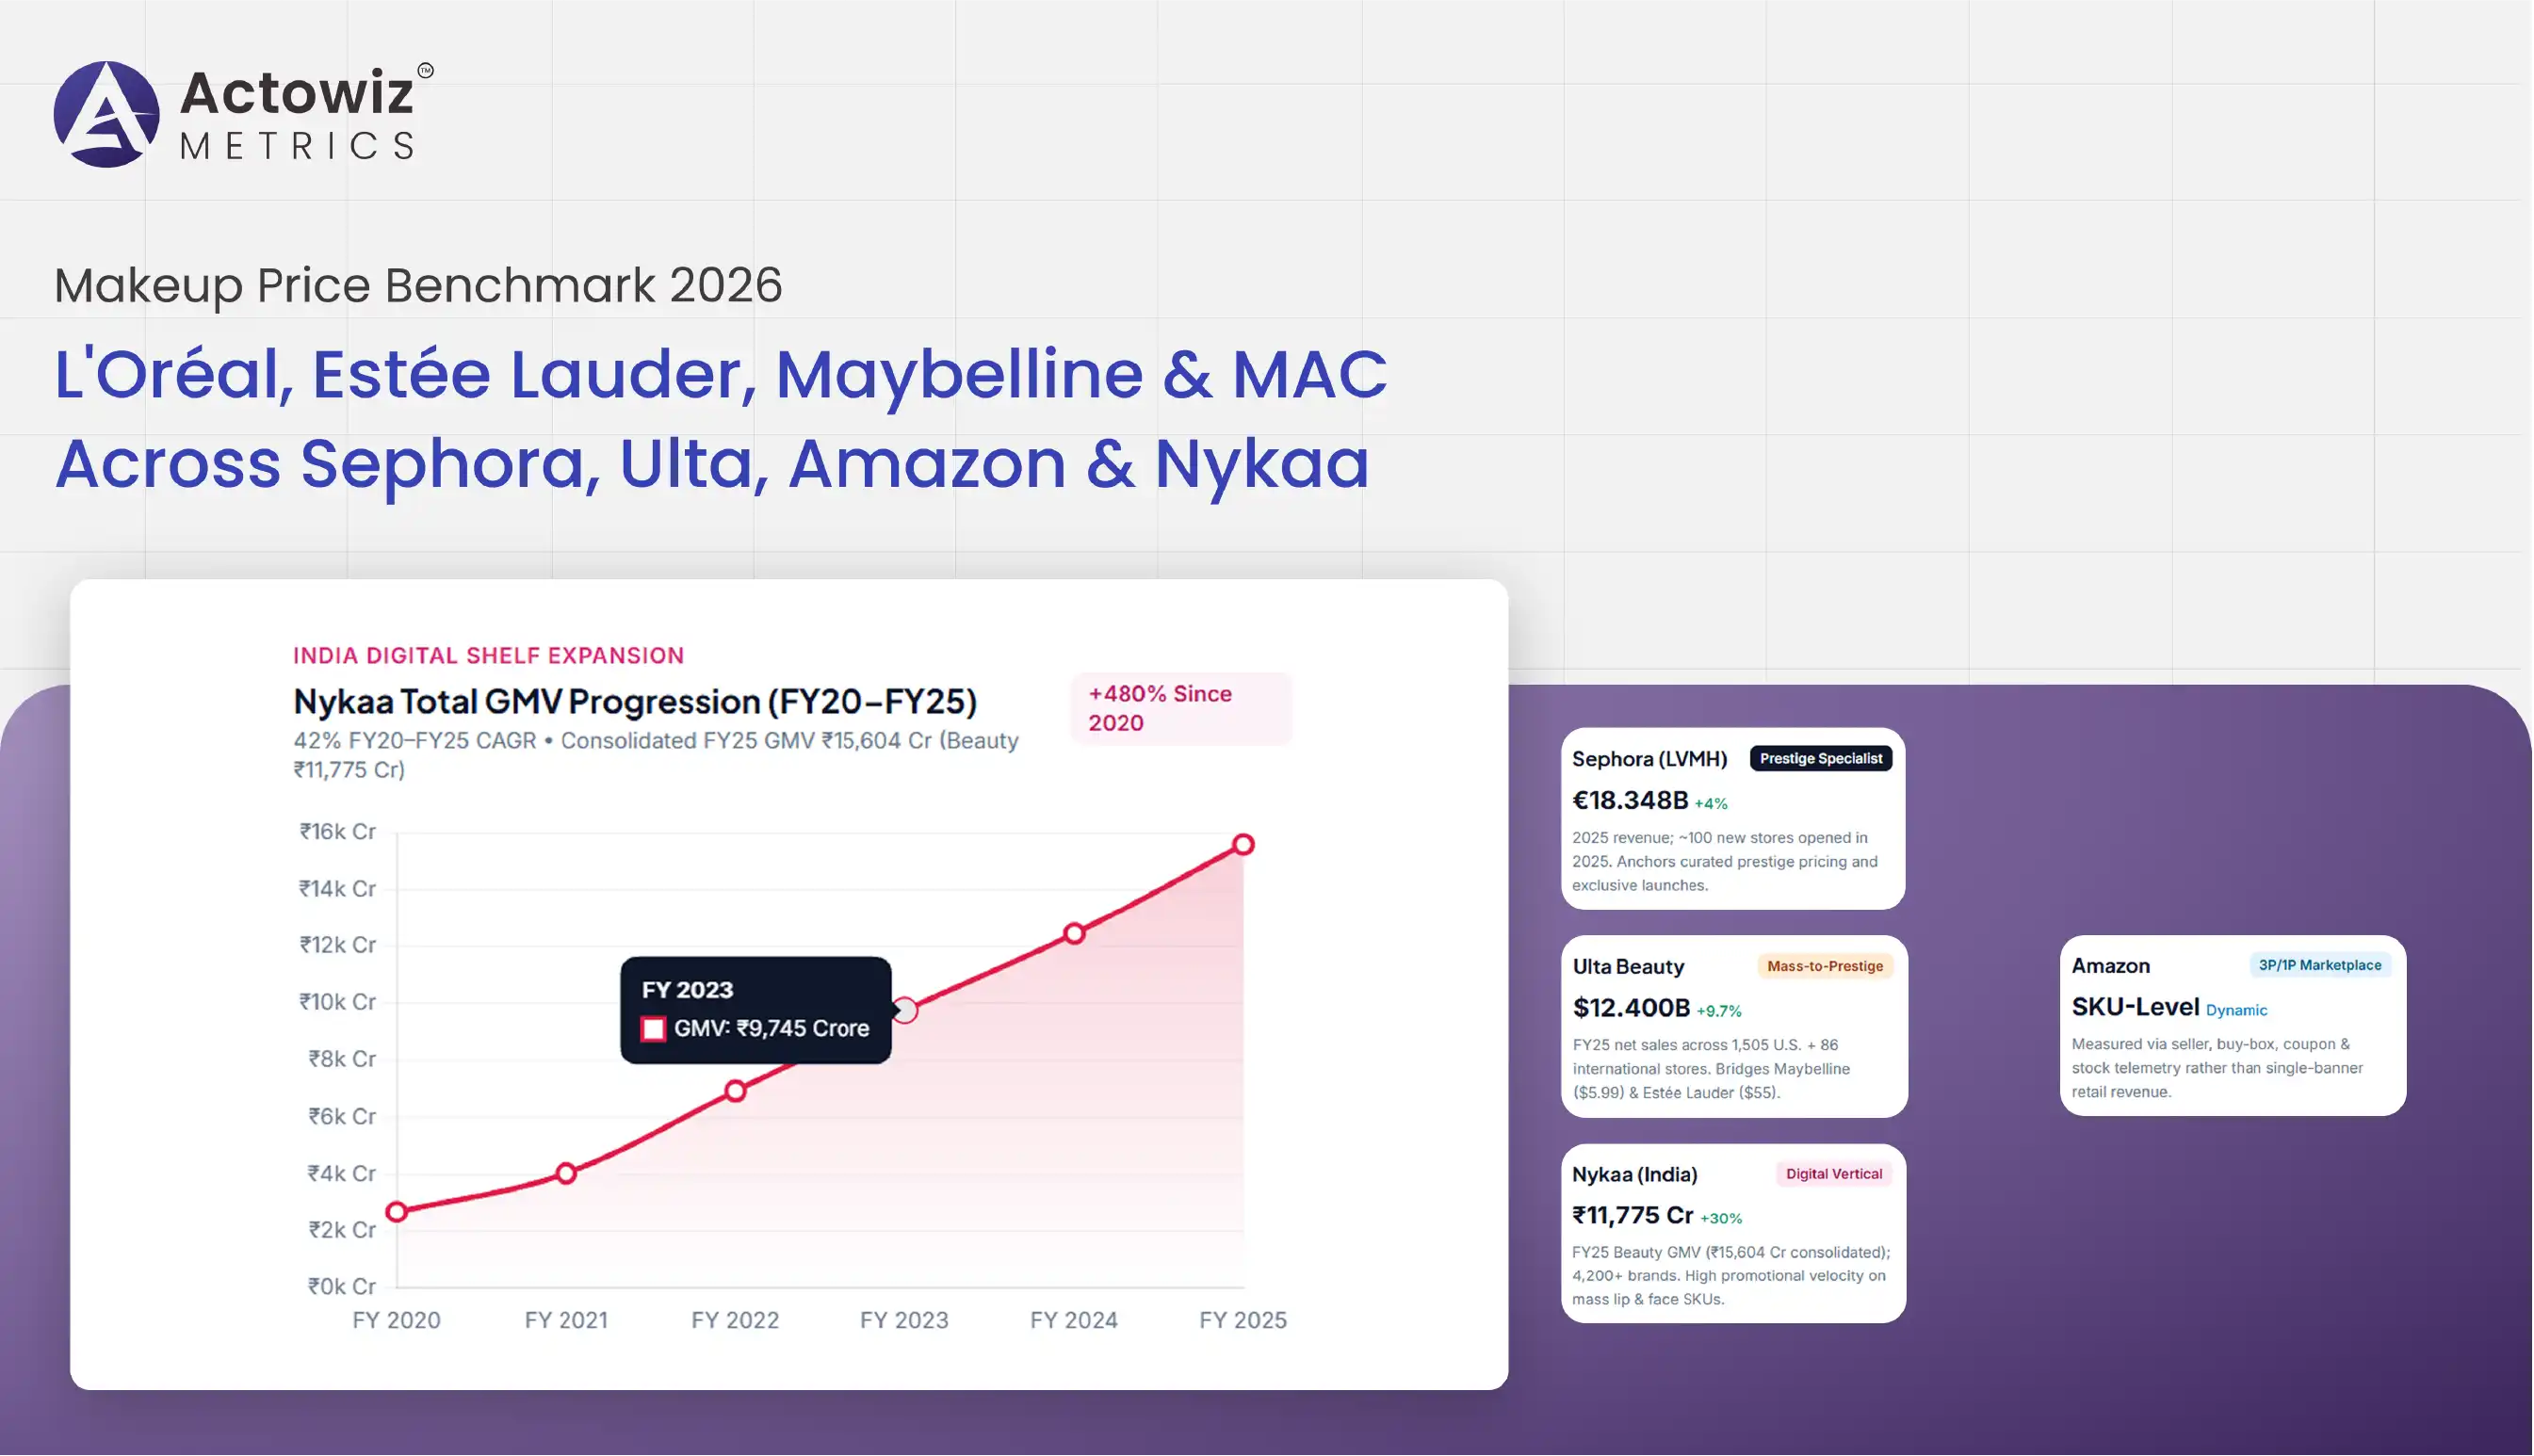
Nykaa’s FY2024–25 annual report offers another useful business indicator. Its beauty vertical recorded gross merchandise value (GMV) of ₹11,775 crore, up 30% year over year, and the company reported more than 4,200 brands across beauty and personal care as of March 31, 2025. These figures illustrate the scale of its broader beauty business; they do not represent haircare-only GMV or the number of haircare brands.
| Year | Verified market signal | Relevance to haircare brands |
|---|---|---|
| 2020 | Personal care, beauty and wellness e-commerce order volume grew 95% year over year in Q4 2020. | Indicates the pandemic-era acceleration of online demand across a broad category. |
| 2021 | The cited sources do not establish a comparable national haircare marketplace price index. | Establish a baseline from dated product records rather than infer prices. |
| 2022 | Online beauty and grooming device brands reached 399, according to a 2025 IBEF report citing NielsenIQ. | Provides adjacent evidence of expanding online grooming choice, not a haircare brand count. |
| 2023 | The cited sources do not establish comparable haircare-specific discount or rating averages. | Use consistent definitions for future tracking. |
| 2024 | Beauty e-commerce and quick-commerce sales grew 39% in value from June to November year over year. | Highlights the importance of monitoring online price and promotion activity. |
| 2025 | Nykaa reported ₹11,775 crore in beauty GMV for FY2024–25, up 30% year over year. | Indicates the scale of the wider beauty channel. |
| 2026 | Flipkart reported 50% year-over-year growth in its overall Beauty and Personal Care category in June 2026. | A current platform-level signal, not a haircare-only growth rate. |
For decision-makers, the next step is to build a product-level panel that captures shampoo, conditioner, hair oil, hair serum, masks, scalp treatments, styling products, and hair-colour products separately. A market-growth statistic cannot tell a brand whether its own shampoo is overpriced or whether its competitors are offering deeper discounts. That requires matched products, dated observations, and clear category definitions.
Nykaa, Amazon & Flipkart haircare product data collection should produce comparable, timestamped records rather than disconnected snapshots of product pages. The goal is to make it possible to identify the same product across platforms, measure price differences, and track changes in ratings, review counts, availability, and promotional terms.
The first step is product identity. A 180 ml shampoo should not be compared directly with a 340 ml bottle using only the displayed price. Similarly, a shampoo-and-conditioner bundle should not be treated as a single shampoo product. The dataset should retain the brand, product title, variant, size, pack count, seller where displayed, listed price, sale price, promotion conditions, rating, review count, availability, product URL, and observation timestamp.
Amazon India’s official seller information confirms that its Beauty and Personal Care category includes haircare and provides a channel for manufacturers and suppliers to sell these products. Nykaa describes its assortment as covering haircare alongside other beauty categories. These official resources establish category relevance, but they do not guarantee that every product field will be visible or consistently available across all listings.
| Data field | Collection rule | Why it matters |
|---|---|---|
| Brand and product name | Preserve the displayed values | Supports identification and competitor grouping |
| Variant and pack size | Capture volume, weight, count, and variant | Prevents mismatched comparisons |
| Listed price | Store the displayed price and timestamp | Creates a historical reference |
| Sale price | Record separately from listed price | Supports discount calculations |
| Rating and review count | Record the displayed values at the same time | Makes review changes interpretable |
| Seller and availability | Capture where displayed | Helps explain listing and price differences |
| Product URL | Preserve the source listing | Enables validation and auditing |
Collection frequency should reflect business needs and applicable platform rules. Frequently promoted products may warrant more regular observation than stable, low-volume products. Brands should also distinguish between a missing value and a confirmed absence: if a rating is not visible during collection, it should be recorded as unavailable rather than automatically treated as zero.
A strong pipeline includes validation checks for duplicate records, unexpected pack-size changes, missing prices, currency inconsistencies, and abrupt rating changes. Before the data is used for a pricing decision, the source listing and product match should be checked, particularly where variants have similar names.
Indian haircare brand discount tracking across marketplaces requires a consistent distinction between the regular displayed price, the current selling price, and the final price available under specific promotional conditions. A headline discount can be misleading when a coupon, bank offer, membership requirement, or minimum order value changes the actual amount a customer pays.
A reliable calculation starts with the displayed regular price and the displayed sale price. The discount percentage can then be calculated as the difference divided by the regular price, multiplied by 100. This measure should be labelled as the displayed discount if additional offers are not included. If coupon or payment-based offers are captured, they should be stored as separate fields with their eligibility conditions.
The table below defines metrics rather than presenting unverified marketplace results. No dated, comparable 2020–2026 discount history for identical haircare products across all three platforms has been established by the sources cited in this report.
| Metric | Calculation | Business use |
|---|---|---|
| Displayed discount | (Regular price − sale price) ÷ regular price × 100 | Compares advertised markdowns |
| Price gap | Brand’s reference price − competitor price | Identifies relative pricing differences |
| Unit price | Price ÷ product quantity in a consistent unit | Compares different pack sizes |
| Promotion frequency | Promotional observations ÷ valid observations | Shows how often a discount was observed |
| Price-change frequency | Number of observed price changes in a period | Highlights unstable pricing |
| Promotion duration | Time between first and last observation of the same promotion | Measures observed promotion persistence |
The 2020 e-commerce trend report from Unicommerce and Kearney found that personal care, beauty and wellness order volume rose 95% in Q4 2020 compared with the same quarter a year earlier, while category order value rose 69%. Average order value declined 14%. Those results covered a broad category and a specific period, so they should not be interpreted as haircare-specific discount statistics.
For a brand, the actionable question is whether a competitor’s price reduction is temporary, recurring, or linked to a specific event. Repeated observations can reveal these patterns more reliably than a single screenshot. However, an observed sale price does not prove the retailer’s margin, the brand’s funding contribution, or the reason the promotion was introduced.
India haircare product ratings and reviews analytics can help brands identify recurring customer concerns, compare product perception, and understand how feedback differs across product types. Average star ratings are useful, but they do not explain why customers like or dislike a product. Review text, rating distribution, review volume, and the time period in which feedback was collected provide additional context.
For example, shampoo reviews may discuss cleansing, fragrance, scalp comfort, or perceived dryness. Hair-serum reviews may focus on texture, application, frizz control, or finish. These are useful categories for classifying customer feedback, not claims about what Indian shoppers currently prefer. Actual conclusions should be based on the reviews collected from the relevant listings.
Flipkart’s 2025 Glam Up beauty trends report, produced with NielsenIQ, described a shift toward more targeted, ingredient-led beauty routines and reported growth in hair-serum sales on its platform. Its 2026 beauty announcement also highlighted haircare-related searches involving scalp concerns. These are platform-reported signals; they should not be generalized into a national preference ranking without further evidence.
| Review indicator | What it can show | Important limitation |
|---|---|---|
| Average rating | Overall displayed customer score | Does not explain the reasons behind ratings |
| Rating distribution | Balance of high and low ratings | May be affected by the number and age of reviews |
| Review count | Volume of visible customer feedback | Is not the same as units sold |
| Recent review themes | Issues or benefits mentioned in newer feedback | Reviewers may not represent all buyers |
| Repeated complaints | Potential product or communication problems | Requires manual or automated validation |
| Ingredient mentions | Topics customers discuss explicitly | Mentions do not prove clinical effectiveness |
A practical workflow classifies reviews into a controlled taxonomy, such as fragrance, texture, packaging, delivery, perceived performance, value for money, and scalp-related concerns. Automated sentiment analysis can accelerate classification, but teams should validate ambiguous language, mixed-language reviews, sarcasm, and duplicated content.
Ratings should also be compared cautiously across platforms. The same product may have different review histories, variant groupings, or displayed scores. Analysts should record the observation date and retain the platform-specific product identifier. They should not combine ratings into a single score unless the weighting method, review counts, and matching rules are clearly documented.
For product teams, the strongest outcome is a traceable summary of recurring feedback that can guide further investigation. Reviews can identify issues worth testing; they cannot independently establish a product’s medical effectiveness or prove that a formulation caused a reported result.
Nykaa, amazon & flipkart hair care competitor analysis should compare like-for-like products while accounting for each platform’s assortment, displayed promotions, and review history. A brand may have different variants, pack sizes, or sellers across marketplaces. A simple comparison of the lowest displayed price can therefore produce a misleading result if it compares different quantities or bundles.
The first stage is to create a matched-product list. Exact product identifiers and pack sizes should take priority. Where identifiers are unavailable, matching can use brand, product name, variant, quantity, and packaging details, with uncertain matches flagged for manual review. Products that cannot be matched confidently should be excluded from the same-item price index and retained in a separate assortment analysis.
| Comparison dimension | Recommended analysis | Decision supported |
|---|---|---|
| Same-SKU price | Compare equivalent product listings | Identify price differences on matching items |
| Unit price | Normalize quantity into a consistent unit | Compare pack sizes fairly |
| Discount depth | Compare displayed regular and sale prices | Review relative promotional intensity |
| Assortment breadth | Count distinct matched products by category | Understand visible category coverage |
| Rating and review count | Compare product-level feedback indicators | Identify products needing deeper review analysis |
| Availability | Track displayed stock or availability status | Avoid confusing missing listings with price changes |
| Seller information | Record seller details where shown | Investigate differences between offers |
Nykaa’s FY2024–25 annual report provides a useful example of why platform context matters: its beauty business reported ₹11,775 crore in GMV and a portfolio spanning more than 4,200 brands across beauty and personal care as of March 31, 2025. Flipkart separately reported 50% year-over-year growth in its overall Beauty and Personal Care category in June 2026. These figures refer to different reporting periods and scopes, so they cannot be used to rank the marketplaces directly or establish haircare market share.
A good competitor dashboard should show the number of valid product matches alongside every price comparison. If only a small share of the intended basket can be matched, the results may reflect assortment differences rather than genuine pricing differences. Brands should also segment products by mass-market, premium, salon-oriented, and specialist positioning where these classifications can be supported by product information.
The final output should identify specific, verifiable observations: a matched product with a changed price, a category with limited comparable coverage, or a repeated review theme. It should not infer market share, sales volume, or profitability from listing counts and public ratings alone.
Nykaa analytics should combine product pricing, assortment, availability, promotional information, and review signals in a consistent reporting structure. Nykaa’s official company information describes an assortment spanning haircare and other beauty categories, while its FY2024–25 report provides company-level metrics for the broader beauty business. Neither source publishes a complete, standardized haircare-only price index covering Nykaa, Amazon, and Flipkart.
For haircare brands, a Nykaa-focused dashboard should begin with a defined list of priority products. Each record should include the displayed price, sale price when available, product variant, pack size, rating, review count, availability, and timestamp. The same product identifiers should then be used to compare corresponding listings on Amazon and Flipkart. Where a product is exclusive to one retailer or cannot be matched confidently, it should remain in the assortment report rather than distort the price comparison.
| Dashboard component | Recommended output | Review frequency |
|---|---|---|
| Price monitoring | Current price and change history for matched items | Based on promotion intensity and business need |
| Discount tracking | Displayed discount and promotion conditions | During key campaigns and regular monitoring |
| Product availability | Visible availability status by product | Alongside each price observation |
| Ratings and reviews | Rating, review count, and validated themes | On a defined reporting schedule |
| Assortment coverage | Product and category coverage across retailers | Weekly or monthly, depending on scope |
| Data-quality status | Match confidence, missing fields, and validation flags | With every collection cycle |
The dashboard should include a source URL and observation timestamp so analysts can verify any unusual movement. Price alerts should be triggered by defined business rules, such as a material change in a priority product’s displayed price. The threshold should be configured by the brand; there is no universal percentage that is appropriate for every haircare category.
A useful monthly report can summarize price changes, discount patterns, category coverage, availability, and review themes. A separate event-period report can examine changes around major shopping campaigns, provided the data has been captured before, during, and after the event. This structure helps teams distinguish a short-lived promotional observation from a persistent change.
The value of the dashboard is not simply collecting more listings. It is creating a consistent evidence trail that helps pricing, marketing, category management, and e-commerce teams investigate changes without confusing incomplete data with real market movement.
Actowiz Metrics can help haircare brands, distributors, and e-commerce teams structure marketplace intelligence around their specific product portfolios and commercial objectives. The key requirement is not merely to collect product listings, but to transform them into comparable records that support pricing decisions, promotional planning, assortment reviews, and customer-feedback analysis.
A suitable engagement can be designed around the following capabilities:
For businesses that require Amazon analytics, the monitoring scope can be organized around eligible product listings, seller information where available, price changes, and review indicators. The exact fields depend on authorized access and what the source makes available.
The implementation should begin with a defined set of brands, product categories, target marketplaces, reporting frequency, and business questions. Actowiz Metrics can then help establish the data model, validation rules, and reporting requirements. Any claims about improved conversion, revenue, or pricing efficiency should be evaluated against a measured baseline rather than assumed in advance.
The Indian haircare market is increasingly influenced by digital discovery, online assortment, promotional activity, and customer feedback. Public industry reports establish the importance of online beauty retail, while company disclosures from Nykaa and Flipkart offer useful context about the broader beauty and personal care category. However, these market-level indicators do not replace a verified product-level comparison.
For 2026, brands should prioritize three steps: build a consistent product catalogue across Nykaa, Amazon, and Flipkart; monitor comparable prices and promotional conditions over time; and analyze ratings and reviews without treating them as direct measures of sales or product effectiveness.
A reliable Flipkart analytics workflow can complement marketplace-wide monitoring by organizing available product, pricing, and customer-feedback indicators into a consistent reporting process. Combined with comparable observations from the other marketplaces, this can help teams identify pricing differences, assortment gaps, and customer concerns that warrant further investigation.
Ready to strengthen your marketplace intelligence? Contact Actowiz Metrics to discuss a tailored haircare data solution covering price tracking, discount monitoring, ratings, reviews, and competitor analysis across India’s leading e-commerce platforms!
Expert blogs, research reports and infographics — practical, data-driven reading across e-commerce and quick-commerce.
Most fields are optional — the more you share, the better your sample.
.webp "infographics")
.webp "infographics")