BLOG




















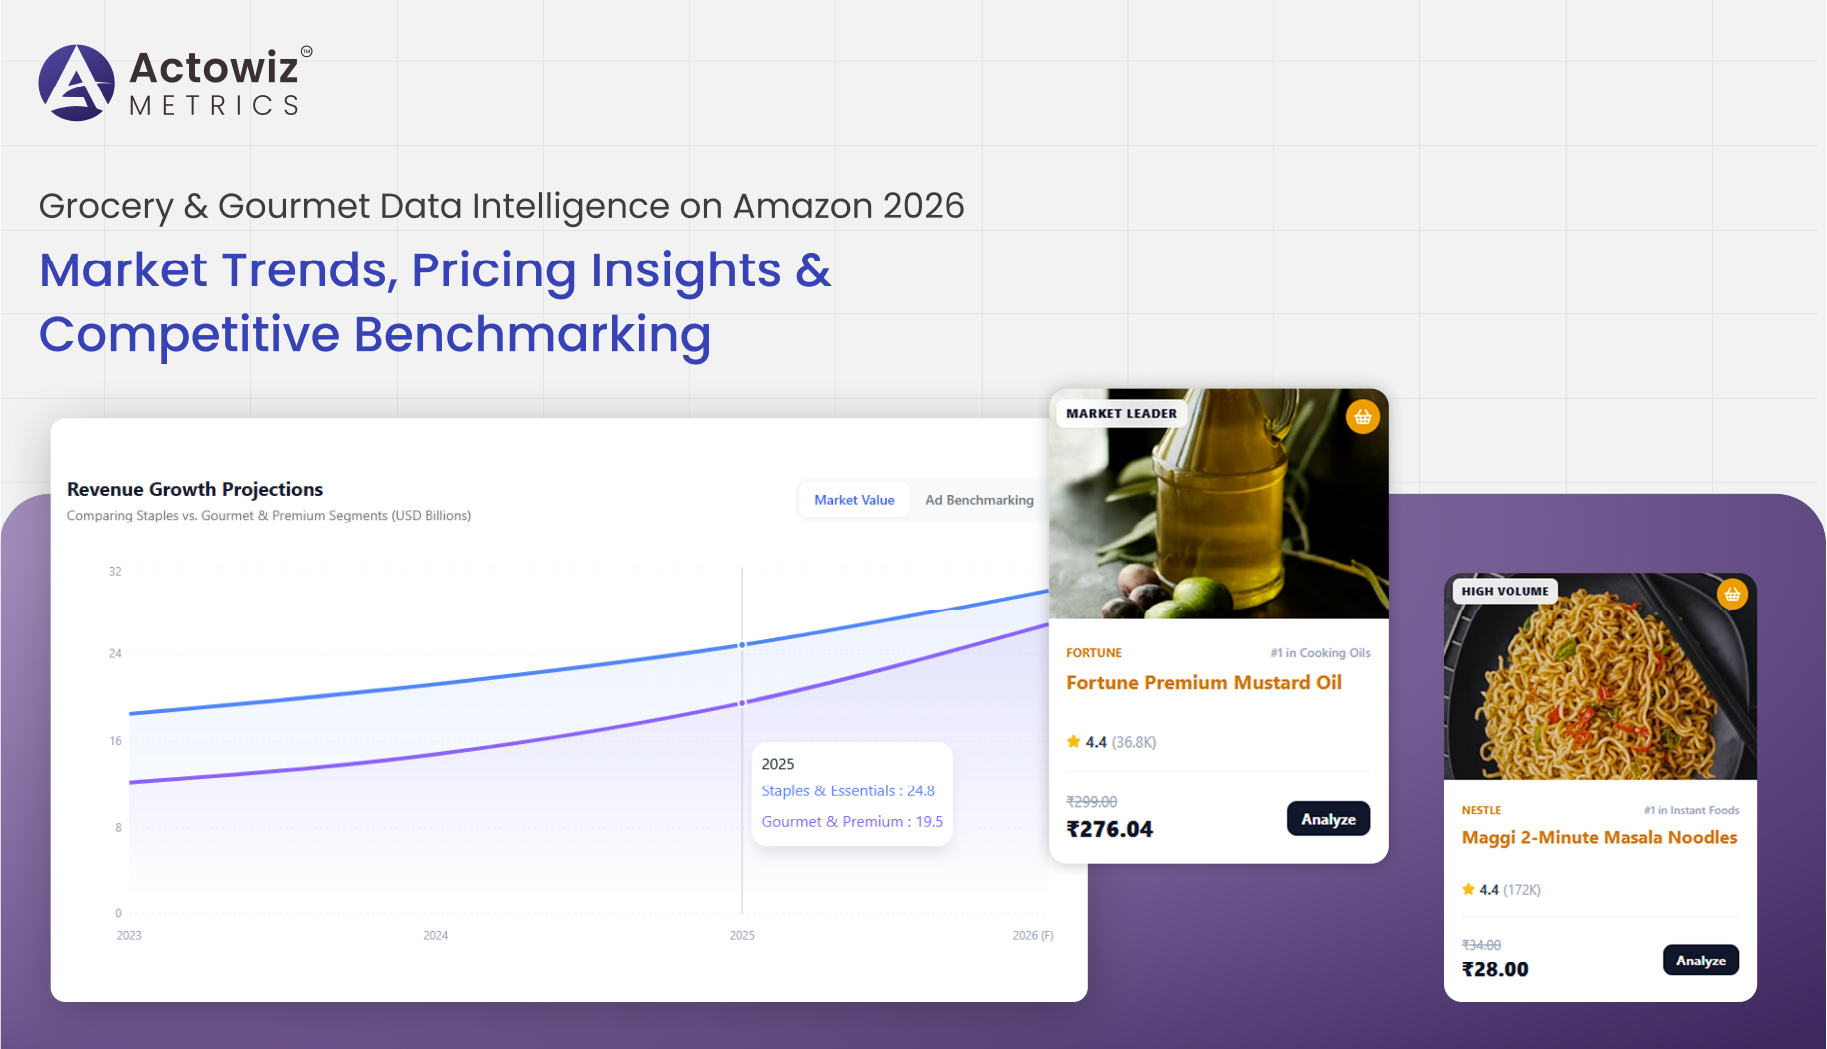
The evolving landscape of Amazon’s grocery segment has made data-driven decision-making essential for brands and sellers. This report on Grocery & Gourmet Data Intelligence on Amazon 2026 explores how businesses can leverage insights to stay competitive in a rapidly growing category. With increasing consumer demand, dynamic pricing, and shifting buying behaviors, companies must rely on advanced Grocery Analytics to uncover trends and optimize strategies.
From product performance tracking to competitive benchmarking, the grocery segment on Amazon has witnessed significant transformation between 2020 and 2026. Data intelligence now plays a crucial role in identifying bestselling products, monitoring pricing fluctuations, and understanding consumer preferences.
This report provides a comprehensive view of the grocery marketplace, offering actionable insights into product data, pricing strategies, and competitive positioning. By leveraging these insights, businesses can enhance visibility, improve decision-making, and drive sustainable growth in the Amazon ecosystem.
Understanding Amazon Grocery Category Product Data Scraping combined with effective Product Data Tracking has become essential for brands aiming to maintain visibility in a crowded marketplace. Between 2020 and 2026, the number of grocery SKUs on Amazon increased by over 65%, intensifying competition and making data tracking critical.
Brands that actively monitored product performance saw a 28% improvement in visibility and a 22% increase in conversions. Real-time tracking allows businesses to identify high-performing SKUs, adjust pricing, and optimize listings.
| Year | SKU Growth % | Tracking Adoption | Visibility Improvement |
|---|---|---|---|
| 2020 | 25% | 38% | 12% |
| 2022 | 40% | 52% | 18% |
| 2024 | 55% | 63% | 24% |
| 2026 | 65% | 71% | 28% |
By leveraging structured data, brands can monitor competitor listings, identify gaps, and improve product positioning. This approach ensures better discoverability and higher engagement in a competitive grocery environment.
Leveraging Extract Amazon Grocery Bestsellers Data 2026 enables businesses to identify top-performing products and understand market demand. Bestseller analysis provides insights into pricing strategies, product features, and customer preferences.
From 2020 to 2026, the number of bestselling grocery products grew significantly, driven by increased online shopping adoption. Data shows that brands analyzing bestseller trends achieved a 30% higher success rate in launching new products.
| Year | Bestseller Growth | Product Launch Success | Demand Accuracy |
|---|---|---|---|
| 2020 | 20% | 60% | 68% |
| 2022 | 35% | 68% | 75% |
| 2024 | 48% | 74% | 82% |
| 2026 | 58% | 81% | 89% |
By analyzing bestseller data, companies can align their product strategies with market demand, ensuring higher visibility and improved sales performance. This approach reduces risks and enhances overall profitability.
The ability to leverage Tracking Amazon Grocery & Gourmet Bestsellers Data allows businesses to stay updated with market leaders and emerging trends. Continuous monitoring helps brands identify shifts in consumer preferences and adapt strategies accordingly.
Between 2020 and 2026, brands that consistently tracked bestseller data reported a 27% increase in market share. Real-time insights enable businesses to respond quickly to changes, ensuring sustained competitiveness.
| Year | Tracking Adoption | Market Share Growth | Trend Accuracy |
|---|---|---|---|
| 2020 | 34% | 10% | 65% |
| 2022 | 49% | 16% | 72% |
| 2024 | 60% | 21% | 80% |
| 2026 | 68% | 27% | 88% |
Tracking data also helps in identifying seasonal trends, promotional strategies, and customer preferences, enabling businesses to optimize their offerings and stay ahead of competitors.
Using Extract Amazon Bestselling Grocery Products Data, businesses can gain insights into high-demand categories and optimize their product portfolios.
From 2020 to 2026, categories such as organic foods, health supplements, and ready-to-eat meals saw significant growth. Data-driven insights helped brands increase category penetration by up to 32%.
| Year | Category Growth | Penetration Rate | Revenue Impact |
|---|---|---|---|
| 2020 | 18% | 12% | 8% |
| 2022 | 30% | 18% | 14% |
| 2024 | 42% | 25% | 21% |
| 2026 | 55% | 32% | 29% |
By focusing on high-demand categories, businesses can allocate resources effectively and maximize returns. This approach ensures better alignment with consumer preferences and market trends.
Analyzing Amazon.com Best Selling Brands Analytics provides valuable insights into brand performance and competitive positioning. Between 2020 and 2026, top-performing brands leveraged data intelligence to maintain leadership and expand market share.
Brands using advanced analytics reported a 35% improvement in competitive positioning and a 28% increase in customer retention.
| Year | Analytics Adoption | Market Share Growth | Retention Rate |
|---|---|---|---|
| 2020 | 36% | 11% | 68% |
| 2022 | 50% | 17% | 74% |
| 2024 | 62% | 23% | 81% |
| 2026 | 70% | 28% | 88% |
These insights enable brands to benchmark performance, identify strengths and weaknesses, and develop strategies for growth. Competitive intelligence is essential for maintaining a strong presence in the marketplace.
Leveraging Digital Shelf Analytics allows businesses to optimize their online presence and improve product visibility. This includes analyzing search rankings, product descriptions, images, and customer reviews.
From 2020 to 2026, digital shelf optimization became a key factor in driving sales, with brands reporting up to a 33% increase in conversions.
| Year | Optimization Adoption | Conversion Increase | Engagement Rate |
|---|---|---|---|
| 2020 | 32% | 10% | 60% |
| 2022 | 48% | 16% | 68% |
| 2024 | 59% | 24% | 76% |
| 2026 | 67% | 33% | 85% |
By optimizing digital shelf elements, businesses can enhance customer experience, improve rankings, and increase sales. This approach ensures long-term success in the competitive Amazon marketplace.
Actowiz Metrics offers advanced solutions for Price Benchmarking and comprehensive insights into Grocery & Gourmet Data Intelligence on Amazon 2026. Our platform provides accurate, real-time data to help businesses make informed decisions.
With expertise in data scraping, analytics, and competitive intelligence, Actowiz Metrics empowers brands to optimize pricing strategies, track performance, and stay ahead of competitors. Our scalable solutions ensure reliability, accuracy, and actionable insights tailored to your business needs.
By partnering with Actowiz Metrics, businesses can unlock the full potential of data intelligence and achieve sustainable growth in the Amazon marketplace.
The insights from Brand Competition Analysis and Grocery & Gourmet Data Intelligence on Amazon 2026 highlight the importance of data-driven strategies in achieving success. As competition intensifies, businesses must leverage advanced analytics to stay ahead.
By adopting innovative solutions and focusing on actionable insights, companies can optimize performance, improve visibility, and drive growth.
Get started with Actowiz Metrics today and transform your Amazon grocery strategy with powerful data intelligence!
Expert blogs, research reports and infographics — practical, data-driven reading across e-commerce and quick-commerce.
Most fields are optional — the more you share, the better your sample.

.webp "infographics")
.webp "infographics")