BLOG
HALLOWEEN SPECIAL OFFER
Data Analytics & Intelligence Solutions
Turn Data into Smarter Business Decisions!
Offer Terms & Conditions Apply


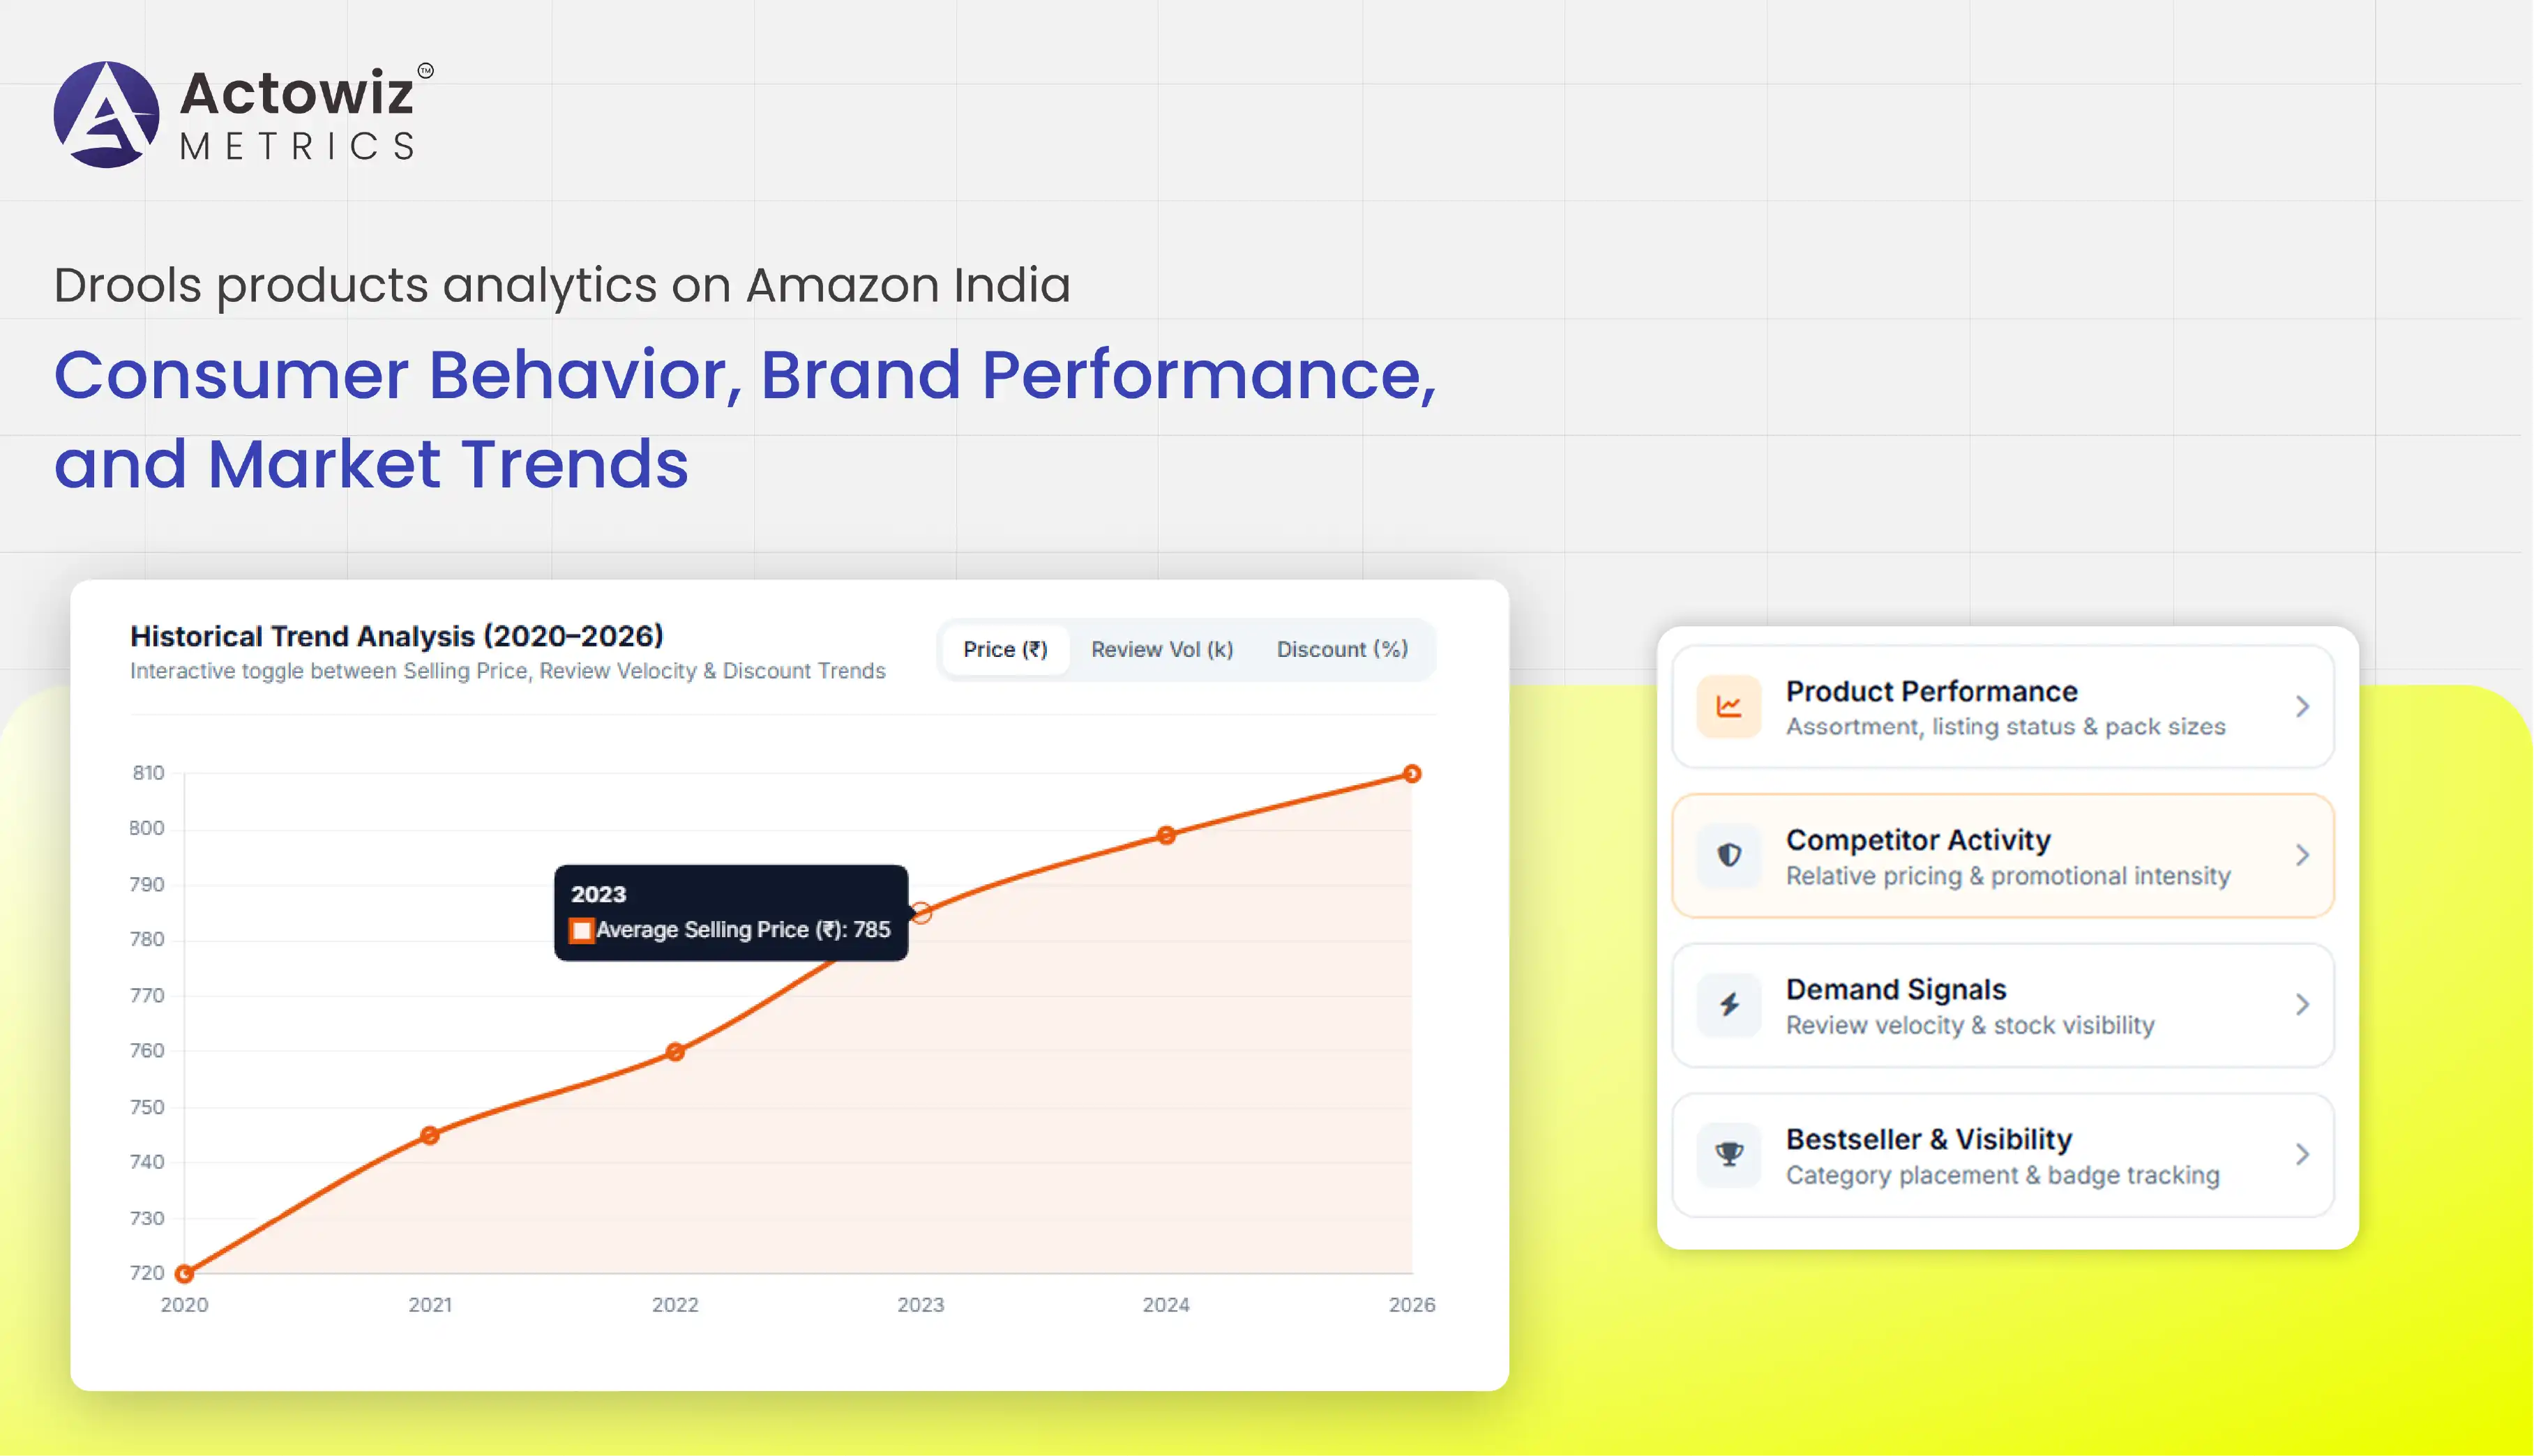
India's pet-care ecosystem has expanded significantly as pet ownership, urbanization, awareness of pet health, and online purchasing continue to influence consumer behavior. Euromonitor reported that India's overall pet population grew by approximately 5% in 2024 and was expected to reach 39 million pets in 2025. At the same time, digital channels have become increasingly relevant for pet-food discovery and purchasing. One industry estimate puts India's pet-care e-commerce revenue at US$2.214 billion in 2023, with an expected 11% CAGR from 2024 to 2030.
In this environment, Drools products analytics on Amazon India can help businesses examine product availability, pricing, discounts, customer reviews, ratings, assortment, and marketplace visibility through structured data. Rather than relying on occasional manual checks, historical product datasets can reveal how marketplace conditions change over time.
The concept of Digital shelf analytics is particularly relevant because a marketplace product page contains multiple signals that influence customer consideration. Price, promotional messaging, product images, specifications, ratings, reviews, and availability can all be monitored to understand how products are presented and how their marketplace presence evolves.
This research report examines six analytical dimensions from 2020 to 2026, covering product performance, competitor activity, pricing, demand, ratings, and bestseller signals.
Drools product performance analytics Amazon India can combine multiple marketplace attributes to create a structured view of how individual products perform. Relevant fields can include product name, ASIN, category, pack size, price, discount, rating, review count, availability, seller information, product URL, and other accessible attributes.
A recurring dataset makes it possible to compare the same product across multiple observation dates. This helps distinguish temporary changes from longer-term marketplace patterns.
| Metric | Analytical Purpose |
|---|---|
| Product count | Measures assortment breadth |
| Listed price | Tracks price positioning |
| Discount | Identifies promotional activity |
| Rating | Measures customer feedback |
| Review count | Tracks engagement over time |
| Availability | Monitors stock visibility |
| Seller count | Tracks marketplace participation |
| Pack size | Enables price-per-unit analysis |
The 2020-2026 period captures major changes in India's digital commerce and pet-care environment. Amazon India reported that its marketplace had more than 8.5 lakh sellers in 2021, while its seller base crossed 20 lakh in September 2026, illustrating the substantial expansion of marketplace participation.
For pet-care brands, this expanding marketplace environment creates more opportunities but also increases the amount of information that needs to be monitored. Product-level tracking can reveal whether listings remain available, whether prices change frequently, and whether customer engagement continues to grow.
Historical product datasets are particularly useful for identifying lifecycle patterns. A product launched several years ago may have accumulated substantial review history, while a newer SKU may show rapid changes in pricing and availability. Comparing these products on common metrics creates a more consistent analytical framework.
The wider pet-care market also provides useful context. Canada's agriculture ministry, citing Euromonitor, reported that dog food was India's largest pet-food category by retail value in 2025, at US$540.1 million, representing approximately 70% of the market. It also reported cat-food retail sales of US$213.9 million, or approximately 28%.
For marketplace analytics, these category-level trends can be combined with product-level observations to understand how individual listings participate in broader market developments.
Drools competitor analysis on Amazon India can help businesses compare relevant products across price, ratings, reviews, discounts, assortment, pack sizes, and availability. A competitive dataset can group comparable products and track changes over time rather than relying on isolated competitor checks.
| Competitive Indicator | What It Helps Analyze |
|---|---|
| Competitor price | Relative pricing position |
| Discount percentage | Promotional intensity |
| Rating | Customer perception |
| Review volume | Customer engagement |
| Product assortment | Category breadth |
| Pack size | Value comparison |
| Availability | Marketplace presence |
| Seller count | Competitive participation |
Drools products analytics on Amazon India can complement this comparison by creating a historical view of the brand's own product portfolio alongside competing listings.
Competitive monitoring became more important as India's online pet-care ecosystem expanded. The country's pet population has grown alongside increasing awareness of nutrition and pet wellness, creating opportunities for established brands and new market participants. Euromonitor reported that India's pet population grew by approximately 5% in 2024, with similar growth anticipated in 2025.
A six-year competitive dataset can help identify changes in category structure. For example, businesses can examine whether the number of comparable products increased, whether pricing became more fragmented, or whether certain product formats became more common.
Price comparisons should account for pack size and product specifications. A larger package may have a higher listed price but a lower unit cost. Therefore, structured product attributes are important for creating meaningful competitive comparisons.
Review and rating trends can provide additional context. Products with rapidly increasing review volumes may warrant closer monitoring, while changes in ratings can indicate evolving customer feedback. These signals do not independently establish sales volume, but they can contribute to a broader marketplace assessment.
By monitoring competitors continuously, businesses can identify price movements, new product introductions, assortment changes, and shifts in marketplace visibility. This creates a more detailed competitive intelligence framework than periodic manual observation.
Drools pricing intelligence Amazon India can provide a structured view of listed prices, selling prices, discounts, price changes, and promotional patterns. Historical price collection allows businesses to determine whether observed price movements are temporary or part of a recurring trend.
| Pricing Metric | Business Application |
|---|---|
| List price | Reference-price tracking |
| Selling price | Current marketplace pricing |
| Discount percentage | Promotion measurement |
| Price change | Trend identification |
| Price-per-unit | Pack-size comparison |
| Competitor price | Benchmarking |
| Promotion frequency | Promotional strategy analysis |
| Price range | Volatility measurement |
Pricing has become an important element of online pet-care competition as consumers can compare multiple products quickly. India's pet-food market has also experienced significant category development. Agriculture and Agri-Food Canada reported that dog-food retail sales increased from US$292.7 million in 2020 to US$540.1 million in 2025, while cat-food retail sales increased from US$55.2 million to US$213.9 million over the same period.
For analytics teams, historical pricing data can help explain how products were positioned during this period of market development. A price history can identify discount-heavy periods, changes in list prices, and shifts in the relationship between competing products.
Promotional monitoring is also important because a product's displayed selling price may differ substantially from its regular price. Tracking both values helps establish a clearer picture of pricing behavior.
Pack-size normalization can further improve analysis. Comparing a 1 kg product directly with a 3 kg product using only headline prices can produce misleading conclusions. Unit-price calculations can make competitive comparisons more meaningful.
Recurring price datasets can also support alert systems. Businesses can establish thresholds for significant price changes and investigate events that cross those thresholds. This approach reduces the need for manual price checks across large product portfolios.
Drools product demand analytics Amazon India can use observable marketplace signals to study changes in customer engagement and product visibility. Relevant indicators include review growth, ratings, availability, price movement, discounts, assortment changes, and product positioning.
Drools products analytics on Amazon India can bring these indicators together into historical dashboards that allow teams to compare products across different periods.
| Demand Signal | Analytical Interpretation |
|---|---|
| Review growth | Customer engagement signal |
| Rating movement | Feedback trend |
| Availability | Stock visibility |
| Discount frequency | Promotional activity |
| Price movement | Pricing response |
| Product assortment | Portfolio expansion |
| Review velocity | Change in engagement rate |
The development of India's pet-care market between 2020 and 2026 provides a useful backdrop for demand analysis. Industry data indicates that online purchasing has become an increasingly relevant channel for pet food. One source reported that online channels accounted for 14.5% of India's pet-food retail sales in 2023.
Demand analysis should nevertheless distinguish between direct sales data and marketplace signals. Review counts, for example, can indicate customer engagement but should not be treated as an exact measure of units sold. Similarly, product availability can show whether a listing is visible but does not independently prove demand.
Combining multiple indicators creates a stronger analytical framework. If review growth, availability, and customer ratings all change together, the pattern may justify further investigation. Likewise, a sharp discount accompanied by increased review activity may indicate a period of heightened customer engagement.
Seasonal analysis can provide additional context. Pet-care purchases may vary according to household routines, promotions, and marketplace events. Comparing recurring periods across multiple years can reveal patterns that are difficult to detect from one-time observations.
A structured demand dataset therefore provides an evidence base for identifying products that warrant deeper commercial analysis.
Drools ratings analysis on Amazon India can help businesses track changes in customer ratings and review volumes across products. Rating analysis can be performed at SKU, category, pack-size, or portfolio level.
A historical dataset can capture both average rating and review-count changes, enabling businesses to distinguish established products from newer listings.
| Review Metric | Analytical Use |
|---|---|
| Average rating | Customer perception |
| Rating distribution | Feedback spread |
| Review count | Engagement scale |
| Review growth | Engagement trend |
| Rating change | Reputation movement |
| Product-level comparison | Portfolio benchmarking |
Customer reviews became an increasingly important part of digital product discovery during the 2020-2026 period. As e-commerce adoption expanded, customers gained greater access to product information and peer feedback before purchasing.
For pet products, reviews can contain information about factors such as palatability, packaging, product suitability, perceived quality, and repeat purchase experiences. Structured review monitoring can organize these signals for longitudinal analysis.
Rating trends should be interpreted carefully. A product with thousands of reviews and a stable rating represents a different analytical situation from a new product with a small review base and a similar rating. Review volume provides important context when comparing ratings across products.
A six-year dataset can also identify rating changes over time. Businesses can examine whether products maintain relatively stable customer feedback or whether ratings shift after changes in packaging, formulation, pricing, or product positioning. Such relationships require additional validation and should not be assumed from marketplace data alone.
Review analysis can also be extended through text classification and sentiment analysis where review content is accessible and permitted for collection. Common themes can be categorized to identify recurring customer concerns and positive attributes.
Drools bestseller analytics Amazon India can help businesses monitor marketplace indicators associated with product visibility and bestseller positioning. Relevant fields may include bestseller badges or rankings where publicly displayed, category placement, product ratings, review counts, pricing, availability, and other accessible marketplace signals.
Amazon India's scale makes marketplace visibility increasingly relevant for brands competing in consumer categories. During the 2024 Great Indian Festival, Amazon reported 140 crore customer visits, more than 25,000 new product launches from top brands, and more than 3 crore products delivered the same day or next day.
These figures illustrate the scale and activity level of India's online marketplace environment. For a pet-care brand, monitoring visible ranking and product signals can therefore provide useful context around marketplace presence.
Bestseller or ranking information should be interpreted within its category and observation period. A rank in one category cannot necessarily be compared directly with a rank in another category. Recurring collection helps overcome this limitation by creating time-series observations for the same product and category.
Historical ranking changes can be analyzed alongside pricing, discounts, reviews, and availability. This enables businesses to investigate whether ranking movements coincide with observable marketplace changes.
The objective is not to treat bestseller rankings as direct sales figures. Instead, rankings can function as one component of a broader marketplace intelligence framework. Combined with other signals, they can help identify products that merit additional monitoring.
Actowiz Metrics provides structured e-commerce data collection and analytics solutions designed to help businesses convert marketplace information into usable datasets. For pet-care brands, the approach can cover product, pricing, competitor, review, rating, availability, and digital shelf information.
Modern Amazon analytics requires more than collecting isolated product records. Businesses need normalized datasets, recurring collection, historical snapshots, validation, and reporting structures that make information easier to analyze.
For a brand such as Drools, Drools products analytics on Amazon India can be organized around specific business requirements, including:
Actowiz Metrics can also customize data fields and collection frequency according to the analytical requirements of a business. Structured outputs can support dashboards, business intelligence systems, spreadsheets, databases, or other internal analytics workflows.
The combination of recurring data collection and historical analysis helps businesses move beyond manual marketplace observation toward a repeatable intelligence process.
India's pet-care market has entered a period of expanding digital participation, supported by rising pet ownership, greater awareness of pet nutrition, urbanization, and increased access to online purchasing. Industry sources indicate continued growth in both pet populations and digital pet-care channels.
For brands operating in this environment, Pet care analytics can help connect marketplace observations with broader category trends. Product pricing, availability, reviews, ratings, competitive activity, and ranking signals can be tracked systematically to create a historical view of marketplace performance.
A structured approach to Drools products analytics on Amazon India can support product monitoring, competitor research, pricing analysis, demand-signal evaluation, customer feedback tracking, and digital shelf intelligence. When collected consistently, these datasets can help business teams identify marketplace changes more efficiently and build evidence-based analytical workflows.
Partner with Actowiz Metrics to build customized Amazon India product, pricing, competitor, review, and digital shelf datasets for actionable pet-care market intelligence!
Expert blogs, research reports and infographics — practical, data-driven reading across e-commerce and quick-commerce.
Most fields are optional — the more you share, the better your sample.
.webp "infographics")
.webp "infographics")