BLOG


The global power tools industry is undergoing rapid transformation driven by digital retail expansion, evolving consumer preferences, and increasing competition among leading brands. This report, Best Power Tools Market Data Analysis 2026, provides a comprehensive view of pricing dynamics, demand fluctuations, and competitive positioning across major global markets. With the rise of online marketplaces and direct-to-consumer strategies, businesses are increasingly relying on E-commerce Analytics to make data-driven decisions and stay competitive.
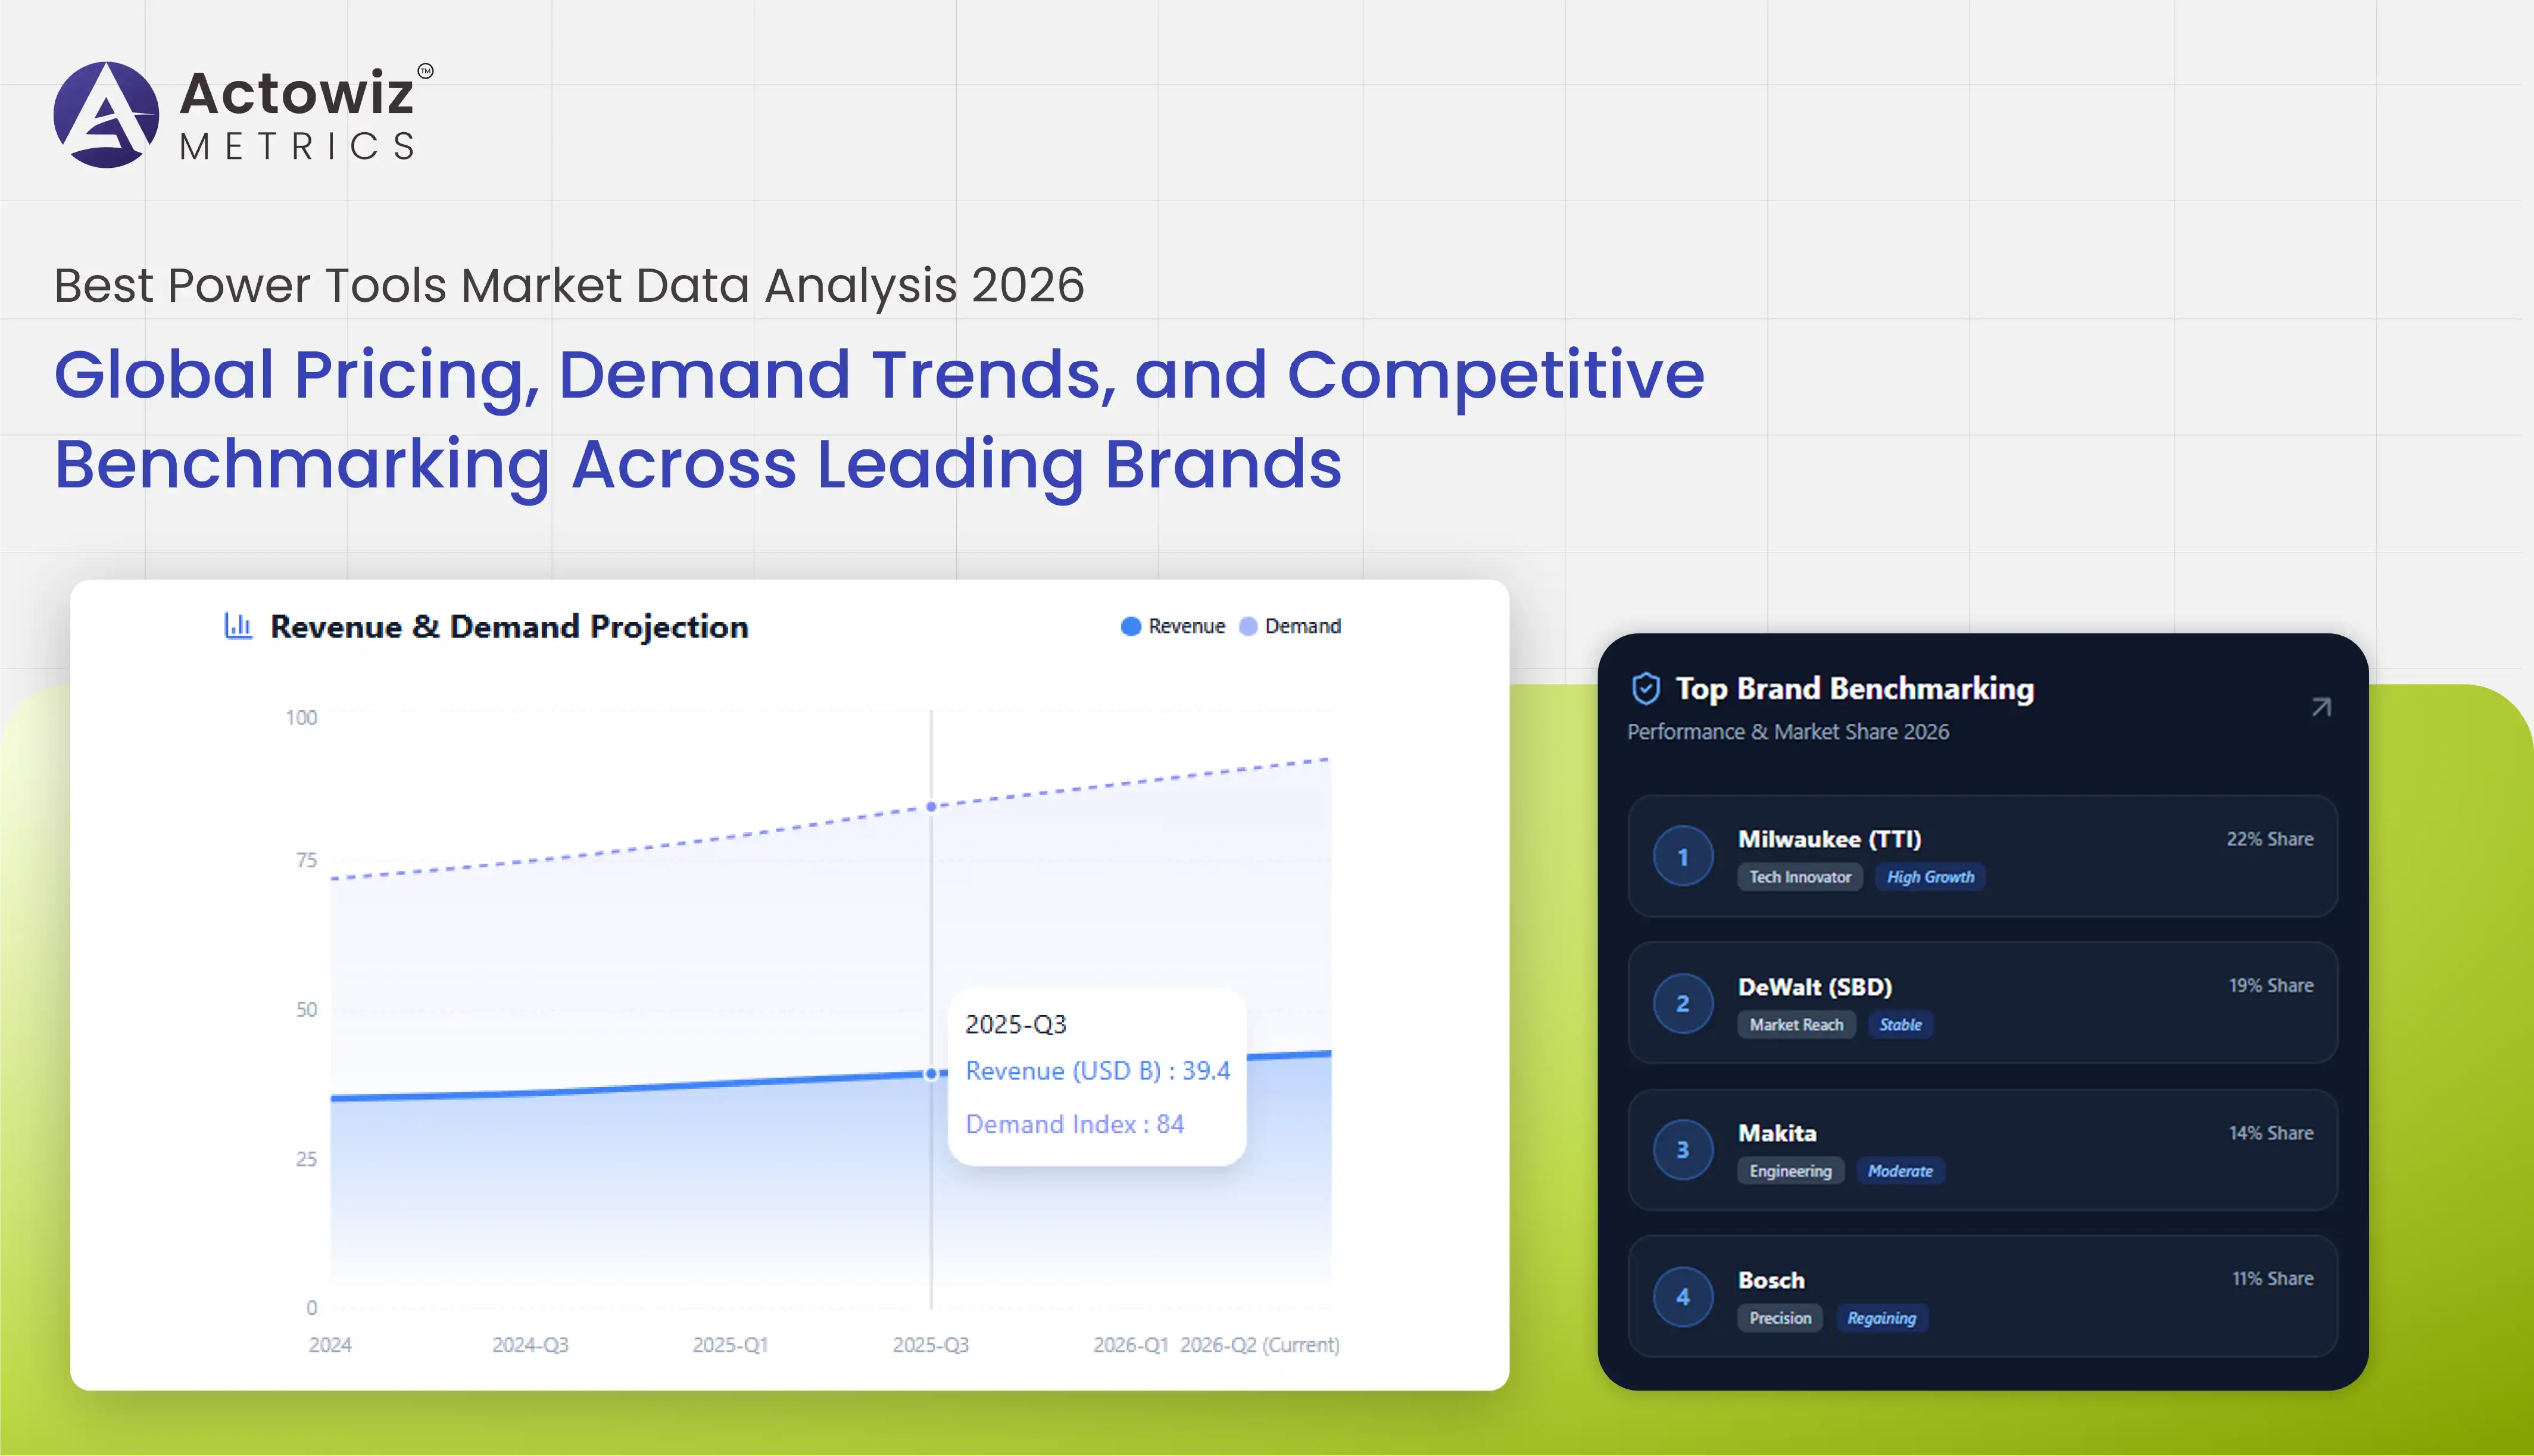
From 2020 to 2026, the power tools market has seen consistent growth, with global revenues projected to surpass $50 billion by 2026. Cordless tools, DIY culture, and professional construction demand have contributed significantly to this growth. At the same time, pricing volatility, promotional strategies, and regional variations have made it critical for brands and retailers to monitor data in real time.
This report explores key performance metrics such as pricing trends, ratings, product availability, and market share insights across regions like North America, Europe, and Asia-Pacific. By leveraging advanced analytics and structured datasets, businesses can identify opportunities, optimize pricing strategies, and improve their digital shelf presence.
The power tools market has experienced strong growth over the past six years, driven by increased construction activity, infrastructure development, and DIY adoption. Leveraging Best Power Tools Market Data Scraping, Product Data Tracking, companies are now able to monitor product performance across multiple online channels with greater accuracy.
Between 2020 and 2026, global demand for power tools has grown at a CAGR of approximately 5.8%. Cordless tools have gained significant traction, accounting for nearly 60% of total sales by 2026. E-commerce channels have also expanded rapidly, contributing over 35% of total revenue compared to just 20% in 2020.
| Year | Market Size ($Bn) | E-commerce Share (%) | Avg Price ($) | Growth Rate (%) |
|---|---|---|---|---|
| 2020 | 32 | 20 | 85 | 4.5 |
| 2022 | 38 | 28 | 90 | 5.2 |
| 2024 | 44 | 32 | 95 | 5.7 |
| 2026 | 50+ | 35 | 102 | 5.8 |
In-depth product-level tracking has enabled brands to optimize inventory, identify top-performing SKUs, and adapt to regional demand variations. Data scraping solutions ensure continuous monitoring of pricing, availability, and promotions, helping businesses stay competitive in a rapidly evolving market landscape.
Regional analysis plays a crucial role in understanding demand variations and competitive intensity. By leveraging Extract Best Power Tools Market Data, Map Monitoring, businesses can identify geographic trends and optimize distribution strategies.
North America remains the largest market, driven by high construction spending and strong DIY culture. Europe follows closely, with sustainability trends influencing product innovation. Asia-Pacific is the fastest-growing region, fueled by urbanization and infrastructure projects.
| Region | Market Share (%) | Avg Price ($) | Growth Rate (%) | Key Drivers |
|---|---|---|---|---|
| North America | 35 | 110 | 5.2 | DIY, construction |
| Europe | 28 | 105 | 5.0 | Sustainability |
| Asia-Pacific | 25 | 85 | 6.5 | Urbanization |
| Rest of World | 12 | 80 | 4.8 | Emerging markets |
Mapping tools allow businesses to visualize product availability, pricing differences, and competitor presence across regions. This enables more precise targeting and efficient allocation of resources. As competition intensifies, geographic intelligence becomes a key differentiator in market success.
Consumer reviews and ratings are critical indicators of product quality and customer satisfaction. By utilizing Best Power Tools Ratings & Review Data Intelligence, companies can gain actionable insights into product performance and customer preferences.
From 2020 to 2026, average product ratings have remained consistently high, typically ranging between 4.2 and 4.6. Products with higher ratings tend to achieve better visibility and conversion rates on e-commerce platforms.
| Category | Avg Rating | Review Volume Growth (%) | Return Rate (%) |
|---|---|---|---|
| Drills | 4.5 | 18 | 6 |
| Saws | 4.4 | 15 | 7 |
| Sanders | 4.3 | 12 | 5 |
| Grinders | 4.4 | 14 | 6 |
Analysis of reviews reveals that durability, battery life, and performance are the most important factors influencing customer satisfaction. Negative reviews often highlight issues such as overheating, short battery life, or poor build quality.
By analyzing feedback data, brands can improve product design, enhance customer experience, and strengthen brand loyalty.
In a highly dynamic market, real-time data tracking is essential for staying competitive. Leveraging Real Time Best Power Tools Market Data Tracking, businesses can monitor pricing changes, stock availability, and promotional activities as they happen.
Between 2020 and 2026, the frequency of price changes has increased significantly, especially during peak sales periods such as Black Friday and seasonal promotions. Real-time tracking enables businesses to respond quickly to market shifts and adjust pricing strategies accordingly.
| Metric | 2020 | 2023 | 2026 |
|---|---|---|---|
| Daily Price Changes (%) | 12 | 18 | 25 |
| Stock Availability (%) | 85 | 88 | 92 |
| Promo Frequency (%) | 20 | 30 | 40 |
Real-time insights help businesses optimize pricing, reduce stockouts, and improve customer satisfaction. Automated systems ensure continuous monitoring, enabling faster decision-making and improved operational efficiency.
Pricing remains a key factor influencing purchasing decisions in the power tools market. Through Best Power Tools Price Benchmarking, companies can compare their pricing strategies against competitors and identify opportunities for optimization.
From 2020 to 2026, average prices have increased due to rising raw material costs and technological advancements. However, competitive pricing strategies and promotional discounts continue to play a crucial role in driving sales.
| Brand Tier | Avg Price ($) | Discount Range (%) | Market Share (%) |
|---|---|---|---|
| Premium | 120–250 | 10–20 | 40 |
| Mid-range | 70–120 | 15–25 | 35 |
| Budget | 30–70 | 20–35 | 25 |
Benchmarking allows businesses to identify pricing gaps, optimize margins, and improve competitiveness. By analyzing competitor pricing strategies, companies can develop more effective pricing models and enhance profitability.
The digital shelf plays a critical role in influencing purchasing decisions. Leveraging Digital Shelf Analytics, businesses can optimize product visibility, improve search rankings, and enhance conversion rates.
Between 2020 and 2026, the importance of digital shelf performance has grown significantly, with over 70% of consumers relying on online research before making a purchase. Factors such as product images, descriptions, and ratings have a direct impact on sales.
| Metric | Impact on Sales (%) |
|---|---|
| Product Images | 25 |
| Customer Reviews | 30 |
| Pricing Visibility | 20 |
| SEO Optimization | 25 |
Optimizing the digital shelf ensures better product discoverability and higher conversion rates. Businesses that invest in digital shelf strategies are better positioned to capture market share and drive growth.
Actowiz Metrics provides advanced data intelligence solutions tailored to the needs of modern businesses. With expertise in Price Benchmarking and Best Power Tools Market Data Analysis 2026, Actowiz enables companies to gain deep insights into market trends, competitor strategies, and customer behavior.
Their solutions offer real-time data tracking, comprehensive analytics, and customizable dashboards, helping businesses make informed decisions and stay ahead of the competition. By leveraging cutting-edge technologies and scalable infrastructure, Actowiz Metrics ensures accurate, reliable, and actionable insights.
The power tools market is evolving rapidly, driven by technological advancements, changing consumer preferences, and increasing competition. Through Brand Competition Analysis and Best Power Tools Market Data Analysis 2026, businesses can gain a comprehensive understanding of market dynamics and make strategic decisions.
From pricing trends to customer insights and digital shelf performance, data-driven strategies are essential for success in today’s competitive landscape. Companies that leverage advanced analytics and real-time data tracking will be better equipped to adapt to market changes and achieve sustainable growth.
Get ahead of the competition with Actowiz Metrics unlock powerful insights and transform your pricing and market strategy today!
Expert blogs, research reports and infographics — practical, data-driven reading across e-commerce and quick-commerce.
Most fields are optional — the more you share, the better your sample.


.webp "infographics")
.webp "infographics")


