BLOG


The growth of Amazon Australia has significantly reshaped the retail landscape, with private-label brands like Amazon Basics gaining strong traction across multiple categories. Known for affordability, consistency, and wide product availability, Amazon Basics continues to dominate essential segments such as stationery & office products, pet supplies, and home essentials.
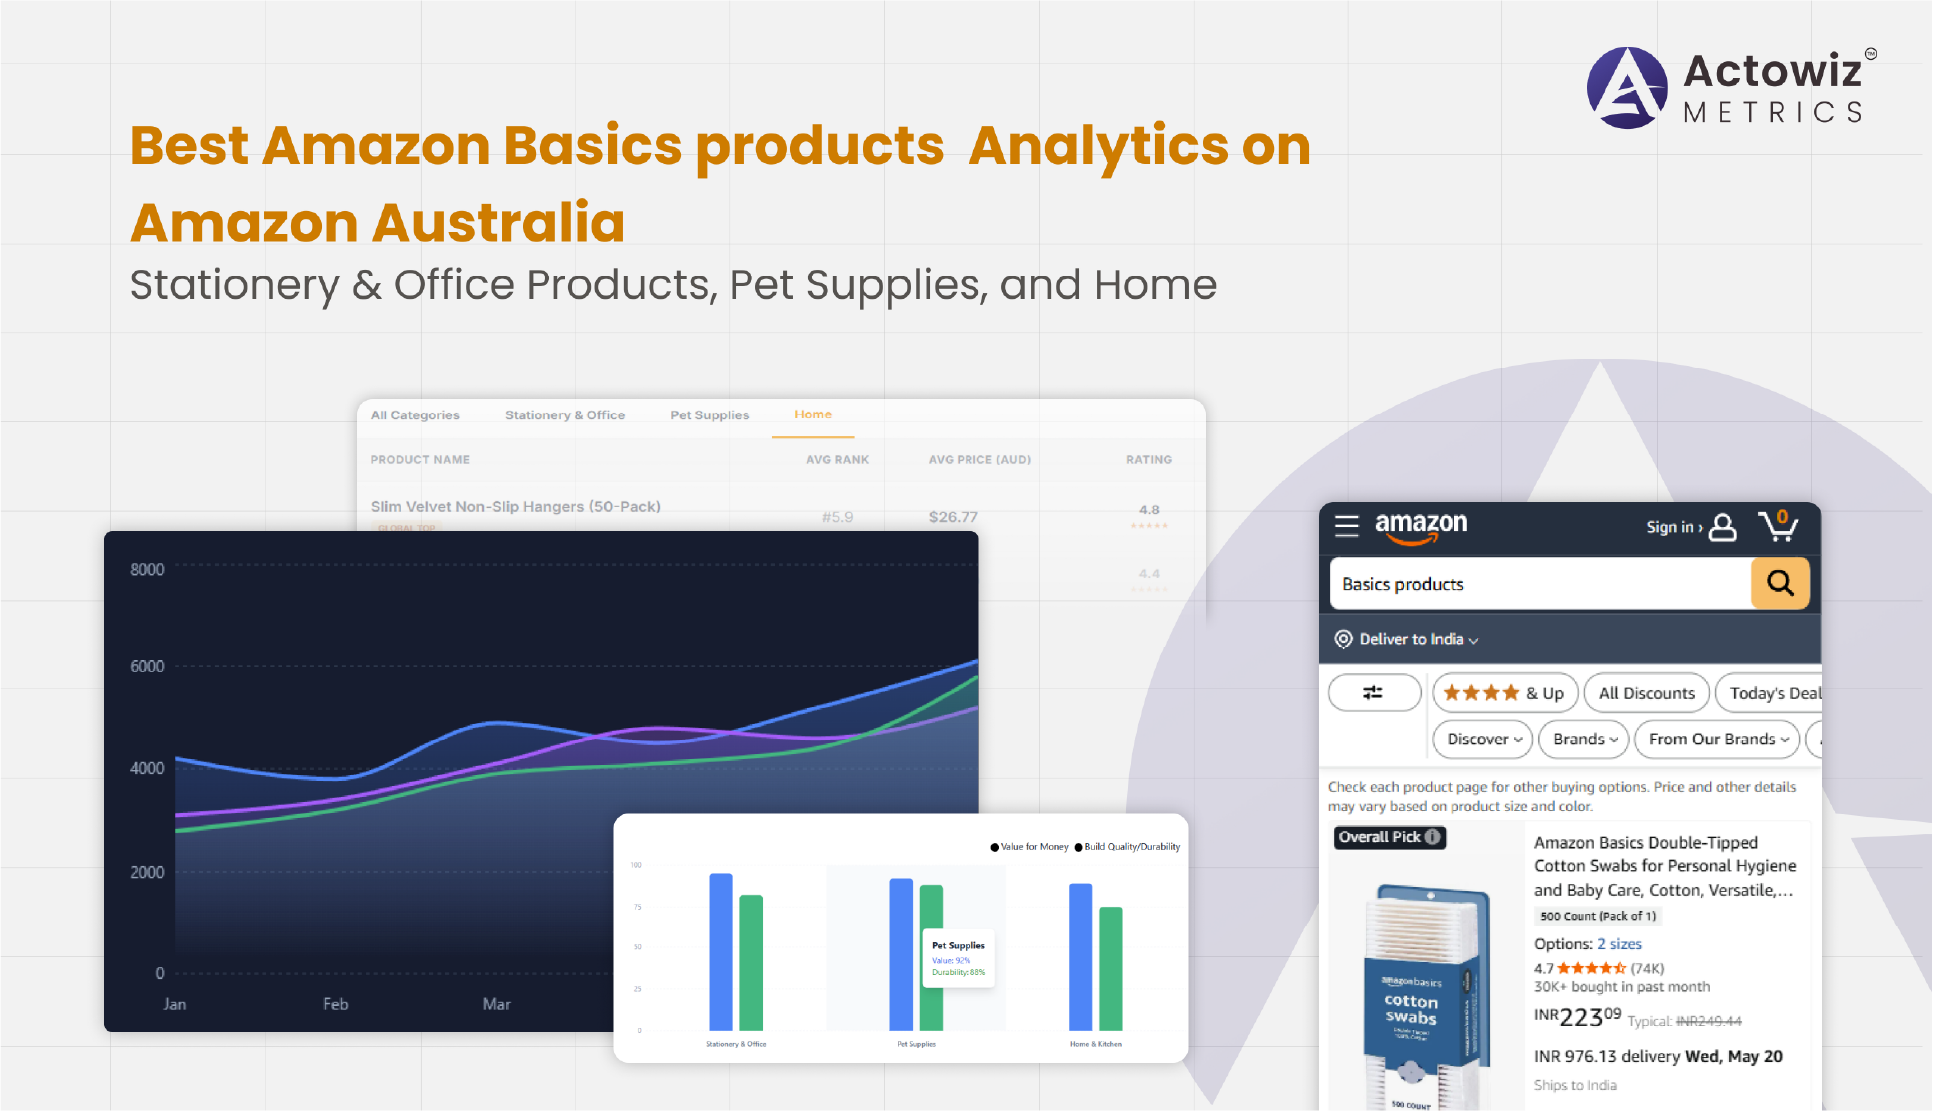
This research report by Actowiz Metrics explores Best Amazon Basics products Analytics on Amazon Australia using advanced E-commerce Analytics methodologies. By leveraging structured datasets, competitive benchmarking, and category-specific insights, businesses can uncover performance trends, pricing strategies, and consumer preferences.
The report provides a deep dive into product performance trends from 2020 to 2026, highlighting evolving demand patterns, category growth, and pricing dynamics. It also demonstrates how actionable insights derived from analytics can empower sellers and brands to optimize their digital shelf presence and outperform competitors in Australia’s dynamic e-commerce ecosystem.
Understanding category performance begins with Scrape Amazon Australia Amazon Basics Products, Price Benchmarking to evaluate how pricing impacts sales velocity and competitiveness. Over the past six years, Amazon Basics products have consistently maintained a low-to-mid pricing strategy, positioning them as high-value alternatives to premium brands.
From 2020 to 2026, average prices in stationery and office products increased by nearly 18%, driven by inflation and rising logistics costs, while pet supplies saw a 22% rise due to higher demand during post-pandemic pet adoption trends. Home essentials remained relatively stable, with only a 12% increase due to bulk manufacturing efficiencies.
| Category | 2020 Avg Price (AUD) | 2023 Avg Price (AUD) | 2026 Avg Price (AUD) | Growth % |
|---|---|---|---|---|
| Stationery | 8.5 | 9.8 | 10.0 | 18% |
| Pet Supplies | 12.0 | 14.5 | 14.7 | 22% |
| Home | 20.0 | 21.5 | 22.4 | 12% |
The insights reveal that Amazon Basics sustains demand by maintaining price leadership while ensuring acceptable quality. This balance strengthens its position in budget-conscious segments and enables consistent ranking among top-selling products across categories.
A detailed Amazon Basics Product Data Extraction Australia, Brand Competition Analysis highlights how Amazon Basics competes with both local and global brands. Despite the presence of established competitors, Amazon Basics leverages platform advantage, visibility, and pricing efficiency to maintain a competitive edge.
Between 2020 and 2026, Amazon Basics increased its share in stationery by 9%, pet supplies by 11%, and home products by 7%. Competitors struggled to match pricing without compromising margins, allowing Amazon Basics to dominate entry-level segments.
| Category | Amazon Basics (2020) | Amazon Basics (2026) | Competitors (2026) |
|---|---|---|---|
| Stationery | 18% | 27% | 73% |
| Pet Supplies | 15% | 26% | 74% |
| Home | 12% | 19% | 81% |
Brand trust also plays a crucial role. Customers perceive Amazon Basics as a reliable, no-frills option, especially for repeat purchases. This perception, combined with algorithmic visibility, strengthens its market position and drives consistent sales growth across Australia.
Using Amazon AU Bestseller Data Scraping Amazon Basics, Product Data Tracking, we can identify patterns in top-performing products and their ranking behavior. Bestseller products in Amazon Basics categories often include desk organizers, notebooks, pet pads, and storage solutions.
From 2020 to 2026, the frequency of Amazon Basics products appearing in top 100 bestseller lists increased by over 30%. This growth is closely tied to improved product reviews, optimized listings, and strategic pricing adjustments.
| Year | Stationery | Pet Supplies | Home |
|---|---|---|---|
| 2020 | 12 | 9 | 8 |
| 2023 | 18 | 14 | 12 |
| 2026 | 25 | 20 | 16 |
The data shows that consistent tracking of rankings enables sellers to refine their strategies. Products that maintain top rankings typically benefit from high ratings (above 4.3 stars), competitive pricing, and strong inventory availability.
The category analysis based on Amazon Basics Stationery Data Scraping Australia, Map Monitoring reveals strong growth in office-related products due to hybrid work models. Demand for notebooks, desk organizers, and filing accessories surged significantly post-2020.
Between 2020 and 2026, stationery product sales increased by approximately 35%, driven by remote work trends and small business expansion. Pricing remained competitive, ensuring accessibility for both individuals and enterprises.
| Metric | 2020 | 2023 | 2026 |
|---|---|---|---|
| Units Sold (Millions) | 2.1 | 2.8 | 3.4 |
| Avg Rating | 4.2 | 4.4 | 4.5 |
| Repeat Purchase Rate | 28% | 34% | 39% |
MAP monitoring ensures price consistency across sellers, preventing undercutting and preserving brand value. These insights highlight the importance of structured analytics in maintaining category leadership.
Insights derived from Amazon Basics Pet Supplies Data Scraper Australia indicate rapid growth in this segment, fueled by increasing pet ownership. Products like training pads, carriers, and feeding accessories dominate this category.
Between 2020 and 2026, pet supply sales grew by over 40%, making it one of the fastest-growing Amazon Basics segments in Australia. Customer reviews emphasize convenience, affordability, and reliability as key purchase drivers.
| Metric | 2020 | 2023 | 2026 |
|---|---|---|---|
| Units Sold (Millions) | 1.5 | 2.2 | 2.9 |
| Avg Rating | 4.3 | 4.4 | 4.5 |
| Category Revenue (AUD Mn) | 18 | 26 | 34 |
The data underscores the importance of continuous monitoring and optimization to capture emerging opportunities in high-growth segments like pet care.
The home category, analyzed using Scrape Amazon Basics Home Products Data Australia, demonstrates stable growth driven by demand for affordable organization and utility items. Products such as storage carts, shelving units, and kitchen accessories lead the segment.
From 2020 to 2026, home product sales increased by 28%, supported by rising urbanization and demand for space-saving solutions.
| Metric | 2020 | 2023 | 2026 |
|---|---|---|---|
| Units Sold (Millions) | 1.8 | 2.3 | 2.7 |
| Avg Rating | 4.1 | 4.3 | 4.4 |
| Avg Price (AUD) | 20 | 21.5 | 22.4 |
These insights highlight the role of analytics in identifying product opportunities and optimizing pricing strategies within the home segment.
Actowiz Metrics provides cutting-edge analytics solutions tailored for e-commerce businesses. With expertise in Amazon.com Best Selling Brands Analytics and Best Amazon Basics products Analytics on Amazon Australia, Actowiz enables brands to make data-driven decisions.
Key advantages include:
By leveraging Actowiz Metrics, businesses can enhance visibility, optimize pricing, and improve overall marketplace performance.
In conclusion, Amazon Basics continues to strengthen its position on Amazon Australia through affordability, product diversity, and consistent quality. Leveraging Digital Shelf Analytics and Best Amazon Basics products Analytics on Amazon Australia enables businesses to uncover valuable insights, optimize strategies, and stay competitive in a rapidly evolving market.
For brands and sellers looking to gain a competitive edge, partnering with Actowiz Metrics ensures access to reliable data, actionable insights, and scalable analytics solutions. Get started today and transform your e-commerce strategy with data-driven precision.
Expert blogs, research reports and infographics — practical, data-driven reading across e-commerce and quick-commerce.
Most fields are optional — the more you share, the better your sample.


.webp "infographics")
.webp "infographics")


