BLOG





















Asia-Pacific has become one of the most important regions for digital food ordering, supported by smartphone penetration, urbanization, digital payments, expanding restaurant ecosystems, and increasingly sophisticated delivery platforms. Between 2020 and 2026, the region moved from pandemic-driven online ordering toward a more mature marketplace in which menu pricing, platform commissions, delivery charges, promotions, subscriptions, and restaurant economics all influence the final customer bill.
The Asia-Pacific Food Delivery Menu Pricing and Delivery Fee Benchmark provides a framework for understanding how these components differ across markets and platforms. Instead of evaluating menu prices alone, a comprehensive benchmark considers listed prices, discounts, delivery fees, service charges, minimum-order requirements, promotional vouchers, and the resulting effective basket value.
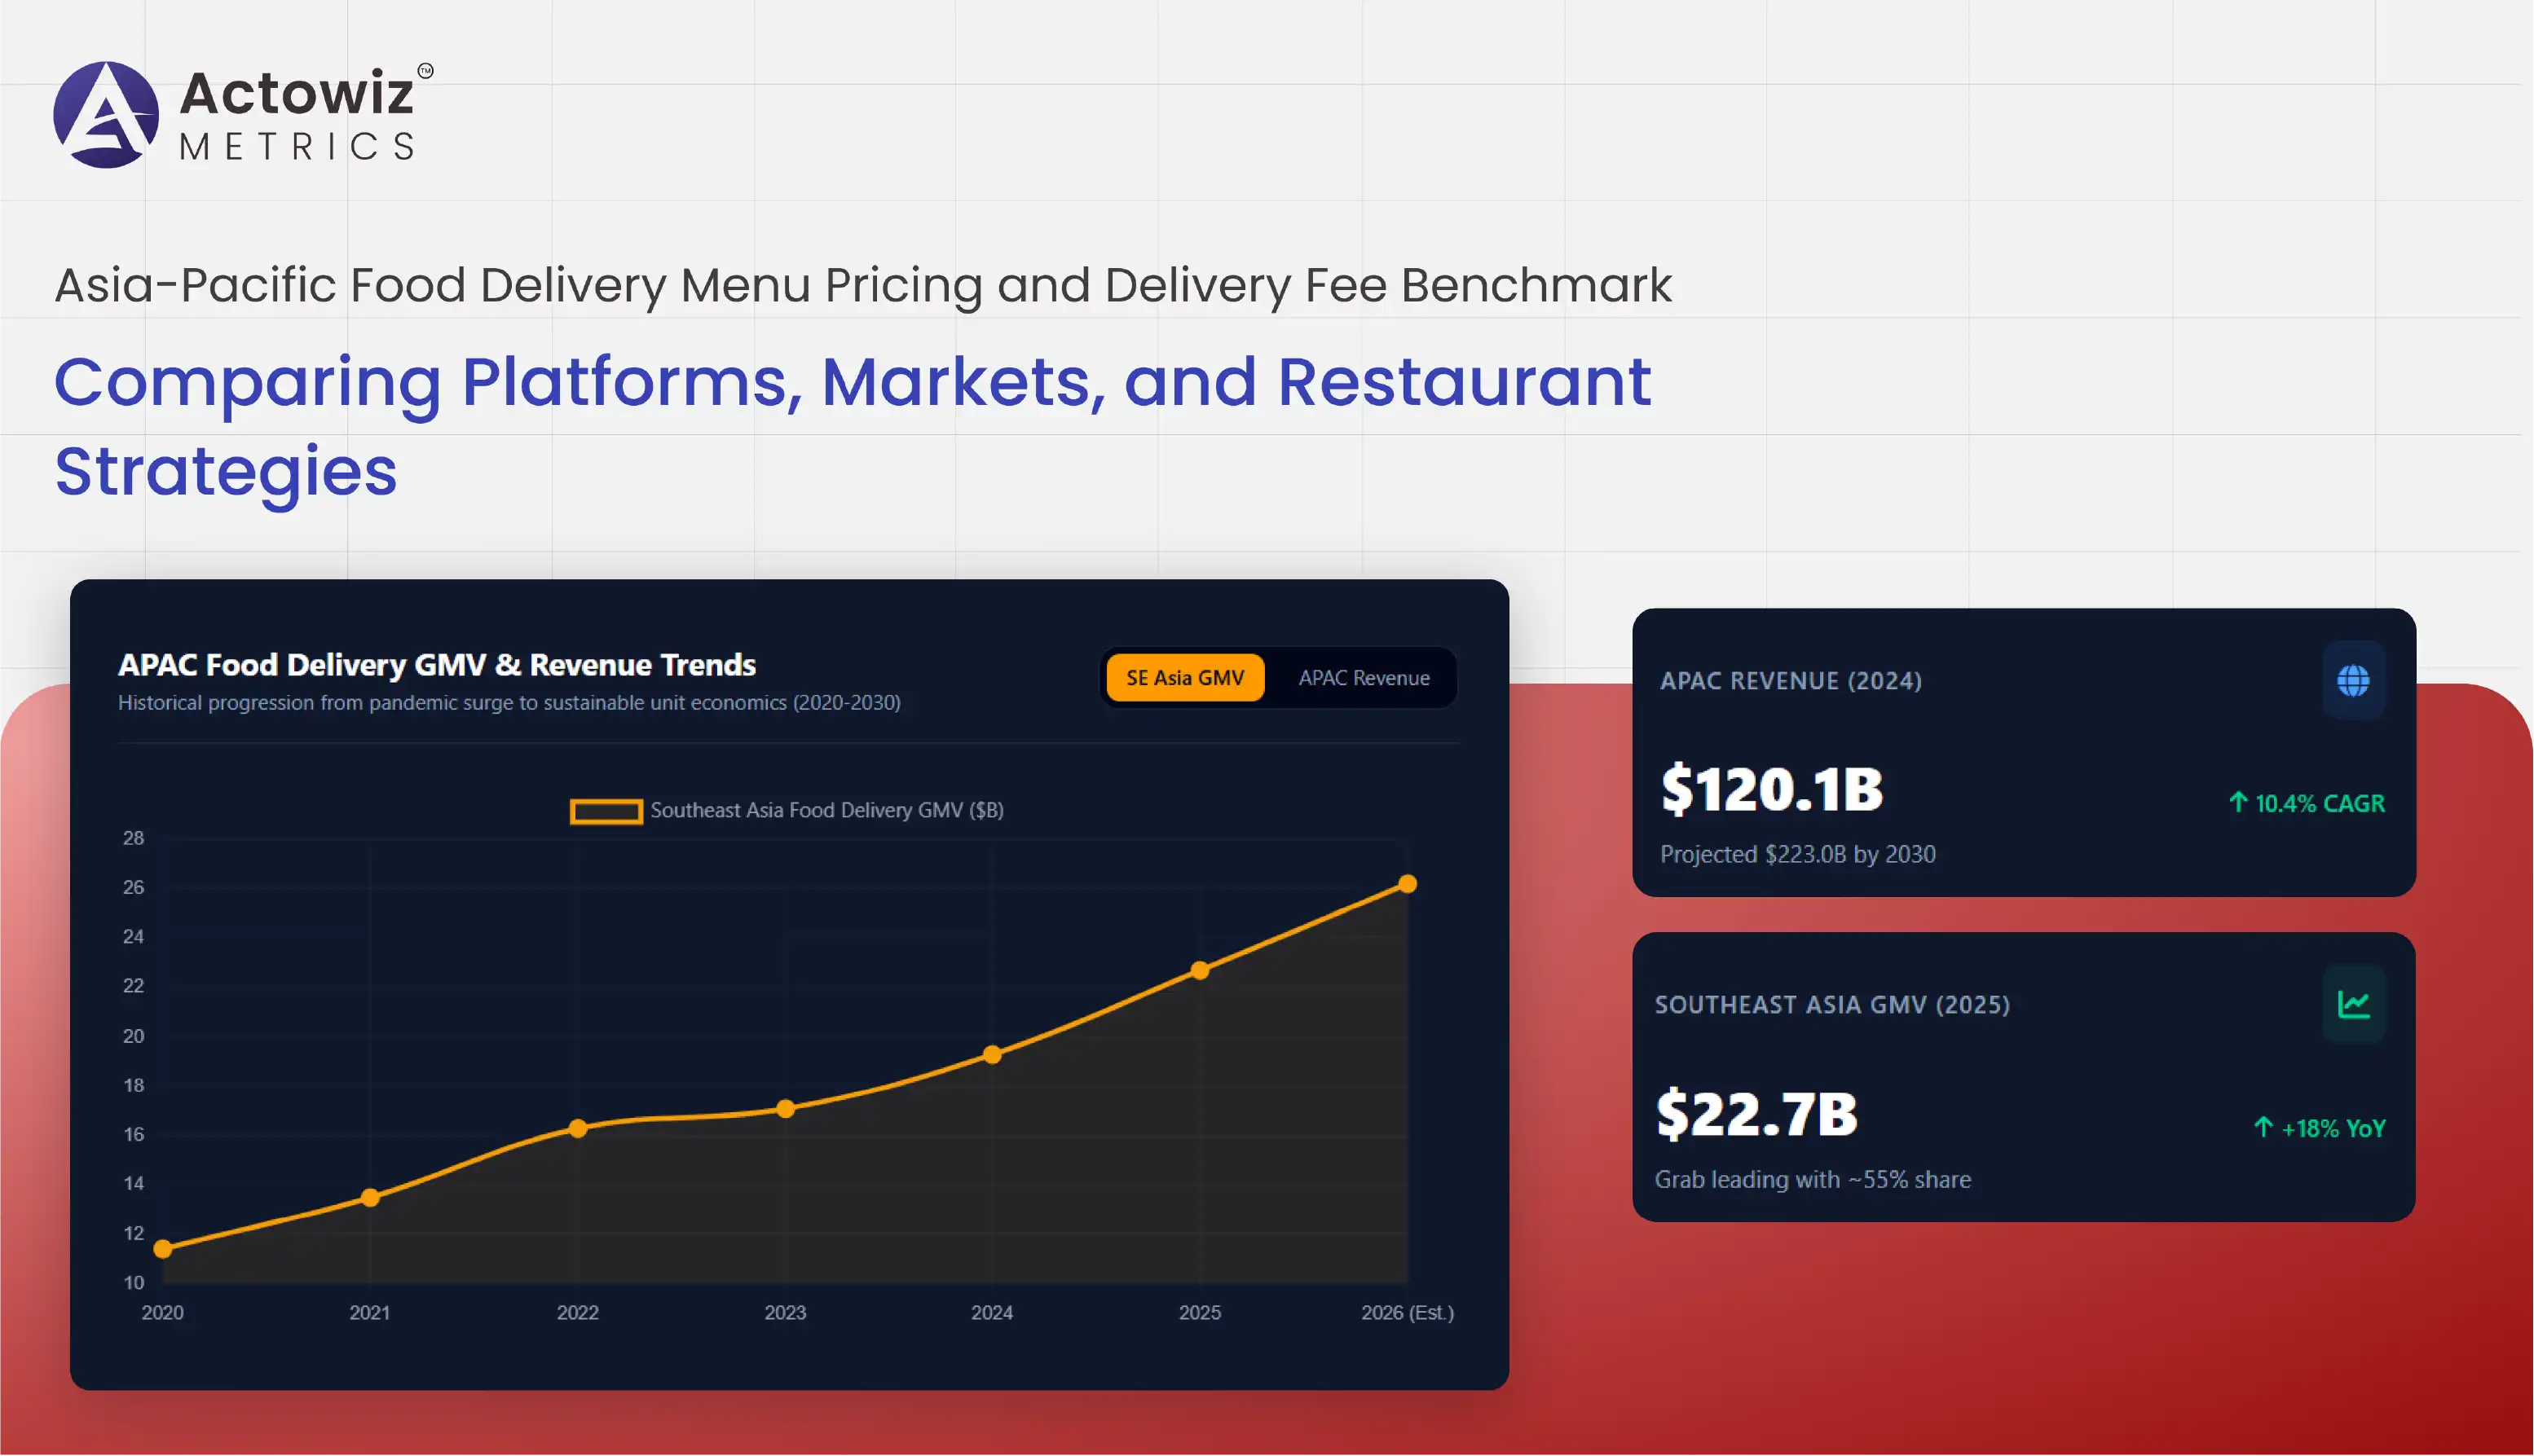
The scale of the market reinforces the importance of this analysis. Grand View Research estimates that Asia-Pacific's online food delivery market generated approximately $120.1 billion in revenue in 2024 and is projected to reach $223.0 billion by 2030, representing a 10.4% CAGR from 2025 to 2030. Another market assessment estimates the APAC online food delivery market to grow at 12.8% annually from 2025 to 2032.
This expansion has made Food Analytics increasingly important for restaurants, food brands, aggregators, and investors. Data-driven benchmarking can reveal how competitors structure prices, where delivery costs are higher, which promotions are most aggressive, and how restaurant pricing changes across markets.
Food delivery pricing across Asia-Pacific cannot be understood through a single regional average. The region includes highly developed digital markets such as China, Japan, South Korea, Singapore, and Australia alongside rapidly expanding markets such as India, Indonesia, Vietnam, Thailand, and the Philippines.
During 2020 and 2021, pandemic restrictions significantly accelerated online ordering. Restaurants that previously depended heavily on dine-in traffic increasingly used delivery platforms to maintain customer access. From 2022 onward, the market shifted toward optimization, with platforms and restaurants focusing more closely on order economics, customer retention, promotions, and delivery efficiency.
By 2024, the APAC online food delivery market had reached $120.1 billion according to Grand View Research. Platform-to-consumer delivery represented 81.48% of market revenue, highlighting the importance of aggregators in the regional ecosystem.
The APAC food delivery pricing analysis approach enables businesses to compare menu prices, fees, discounts, and final checkout values across markets.
| Indicator | Value |
|---|---|
| APAC online food delivery revenue, 2024 | $120.1B |
| Projected APAC revenue, 2030 | $223.0B |
| APAC CAGR, 2025–2030 | 10.4% |
| Platform-to-consumer share, 2024 | 81.48% |
| APAC platform-to-consumer market estimate, 2025 | $0.69T* |
*Different research methodologies produce substantially different market-size estimates; figures should therefore be interpreted according to each source's defined market scope.
Pricing differences emerge from local restaurant economics, platform competition, rider costs, consumer purchasing power, taxes, promotional strategies, and platform commission structures. A standardized benchmark helps separate genuine menu-price differences from differences caused by delivery or promotional charges.
A restaurant's menu price is only one component of what a consumer ultimately pays. A meal listed at the equivalent of $10 in one market may become significantly more expensive after delivery fees and service charges, while another platform may offer a voucher that substantially reduces the final amount.
This makes Food delivery menu price comparison Asia-Pacific more useful when it evaluates complete baskets rather than individual menu items alone.
Between 2020 and 2022, heavy discounting was widely used to encourage consumers to shift from offline ordering to digital platforms. By 2023–2024, many platforms began emphasizing operational efficiency and more sustainable unit economics. During 2025–2026, competition remained intense, but operators increasingly balanced promotional activity against profitability.
Southeast Asia provides a useful example. Momentum Works reported that food-delivery platform GMV in the region reached $19.3 billion in 2024, growing 13% year over year. In 2025, GMV increased another 18% to $22.7 billion.
| Metric | 2024 | 2025 |
|---|---|---|
| Food-delivery GMV | $19.3B | $22.7B |
| Annual GMV growth | 13% | 18% |
| Regional leader | Grab | Grab |
| Grab market position | Leading | ~55% share |
Momentum Works reported that Grab strengthened its Southeast Asian leadership to around 55% in 2025, while ShopeeFood overtook Foodpanda in GMV.
Basket benchmarking can therefore compare the same restaurant or equivalent meal category across platforms. Analysts can evaluate menu-price differences, delivery fees, promotional reductions, minimum order thresholds, and final payable amounts.
For restaurants, this can reveal whether digital menu prices are substantially different from comparable offline or competing-platform prices. For platforms, it provides a way to monitor competitiveness and consumer value.
The Asia-Pacific Food delivery pricing trends landscape has changed considerably over the last seven years.
In 2020, food delivery was largely driven by necessity and lockdown restrictions. Restaurants prioritized maintaining digital visibility, while platforms used aggressive promotions to acquire and retain users. During 2021, online ordering remained elevated as consumers became accustomed to app-based ordering.
In 2022, reopening created a more balanced environment between dine-in and delivery. Platforms began concentrating more strongly on restaurant selection, logistics efficiency, loyalty programs, and monetization. During 2023 and 2024, competition increasingly shifted toward differentiated pricing, subscriptions, advertising, and delivery incentives.
By 2025 and 2026, mature markets began focusing more strongly on unit economics and operational efficiency. Meituan's 2026 results demonstrate this shift: after more than a year of intense price competition in China's food-delivery market, the company returned to profitability in Q2 2026 as competitive pressure eased.
| Period | Dominant Pricing Characteristic |
|---|---|
| 2020 | Pandemic-driven discounts |
| 2021 | Customer acquisition promotions |
| 2022 | Reopening and pricing normalization |
| 2023 | Loyalty and subscription incentives |
| 2024 | Greater focus on basket economics |
| 2025 | Efficiency and competitive differentiation |
| 2026 | Profitability and sustainable pricing |
At the same time, Asia-Pacific remains highly diverse. India, China, Japan, Southeast Asia, and Australia have different consumer expectations and operating models. Therefore, a regional benchmark should not treat every market identically.
Instead, businesses should segment pricing by country, city, cuisine, restaurant category, order size, platform, time period, and promotional status. This produces a more accurate picture of competitive positioning.
Restaurants increasingly need to understand how their digital menus compare with competitors. Menu architecture, portion sizes, combo structures, add-ons, meal bundles, and promotional pricing can all influence consumer decisions.
The APAC Restaurant menu pricing intelligence model provides a structured way to compare restaurants within the same cuisine, city, price tier, or platform.
From 2020 onward, restaurants increasingly recognized that online menu presentation could affect both conversion and profitability. By 2023, delivery platforms had become a major customer-acquisition channel for many restaurants. By 2025–2026, restaurants were also paying greater attention to commission economics, advertising expenditure, packaging costs, and the difference between online and offline prices.
Reuters reported in 2025 that India's emerging food-delivery competitor Rapido proposed a restaurant fee of ₹25 per order for meals above ₹100, compared with competitors' reported commission rates of roughly 16%–30%. The proposal specifically sought to keep online menu prices closer to dine-in pricing.
| Benchmark Area | What Businesses Can Evaluate |
|---|---|
| Base menu price | Listed item price |
| Combo pricing | Bundle value |
| Add-ons | Incremental cost |
| Delivery fee | Customer delivery charge |
| Service fee | Platform-level charge |
| Promotions | Voucher and discount depth |
| Minimum order | Qualification threshold |
| Final basket value | Effective customer cost |
Such comparisons help restaurants understand whether they are positioned as value, mainstream, premium, or discount-oriented competitors.
For food platforms, restaurant-level monitoring can identify unusually high prices, aggressive discounting, missing items, inconsistent menus, or pricing anomalies. For brands operating restaurant chains, it can reveal whether individual outlets follow standardized pricing policies.
The rapid expansion of platforms has created a major data-management challenge. Restaurants can operate across multiple applications, cities, and delivery zones, while menus can change frequently.
The Asia-Pacific Food delivery menu pricing data scraping approach can help organizations build structured datasets from publicly accessible digital menu information, subject to applicable laws, platform terms, and technical restrictions.
Between 2020 and 2022, menu monitoring was often performed through manual checks or limited samples. As the market expanded, manual collection became increasingly inefficient. From 2023 onward, automated collection became more useful for organizations needing broader historical coverage.
| Data Field | Example Use |
|---|---|
| Restaurant name | Entity matching |
| City | Geographic analysis |
| Cuisine | Category benchmarking |
| Menu item | SKU-level comparison |
| Listed price | Price benchmarking |
| Discount | Promotion measurement |
| Delivery fee | Fee analysis |
| Service charge | Total-cost analysis |
| Availability | Menu monitoring |
| Timestamp | Historical tracking |
A structured historical dataset allows analysts to measure price changes over time rather than simply observing a menu at one moment.
This becomes particularly valuable during major events, holidays, weekends, promotional periods, and periods of inflation. Analysts can identify whether restaurants increase prices during peak demand, whether delivery fees change by time or location, and whether promotions offset those increases.
The resulting dataset can also support competitor intelligence, restaurant assortment research, menu optimization, and market-entry studies.
The final stage of benchmarking is connecting individual price and fee observations with broader commercial strategy. A low menu price does not necessarily mean a platform provides the lowest customer cost. Delivery fees, service charges, taxes, minimum order values, and promotions can materially change the final basket.
The Price & promotion intelligence, Asia-Pacific Food Delivery Menu Pricing and Delivery Fee Benchmark framework therefore needs to examine both headline and effective prices.
The importance of this approach is increasing as platforms seek healthier economics. In Southeast Asia, the food-delivery sector grew 18% in GMV during 2025, reaching $22.7 billion, according to Momentum Works. In East Asia, Hong Kong, Taiwan, South Korea, and Japan together generated an estimated $38.6 billion in food-delivery platform GMV in 2025.
| Metric | Strategic Application |
|---|---|
| Menu price index | Compare restaurant pricing |
| Delivery-fee index | Measure platform cost |
| Promotion depth | Evaluate discount intensity |
| Effective basket price | Measure customer value |
| Price-to-portion ratio | Compare meal economics |
| Fee-to-order ratio | Evaluate delivery burden |
| Promotion frequency | Assess competitive activity |
| Price volatility | Track pricing stability |
This framework enables businesses to answer practical questions: Which platform provides the lowest effective basket price? Which restaurants maintain the highest menu premiums? Where are delivery fees most competitive? Which markets rely most heavily on promotions?
For restaurant groups, these insights can inform menu pricing and promotional decisions. For platforms, they can support competitive positioning and fee strategy. For investors and market researchers, they provide a more granular understanding of marketplace economics.
Actowiz Metrics can help businesses transform food-delivery information into structured market intelligence. The objective is to move beyond isolated menu checks and develop a repeatable framework for comparing restaurants, platforms, cities, cuisines, prices, promotions, and delivery economics.
Availability tracking adds another dimension to pricing research. A low menu price has limited value when an item is unavailable or a restaurant cannot fulfil orders in a particular delivery zone. Monitoring availability alongside pricing can therefore provide a more complete view of customer-facing competitiveness.
For organizations studying the Asia-Pacific Food Delivery Menu Pricing and Delivery Fee Benchmark, Actowiz Metrics can support structured data collection, normalization, historical comparisons, and competitive benchmarking across multiple markets.
The APAC food-delivery ecosystem is fragmented, and each country has its own platforms, consumer behavior, restaurant economics, and regulatory environment. A standardized data framework can make these differences measurable.
Actowiz Metrics can help businesses evaluate menu prices, delivery charges, promotional activity, product availability, restaurant assortment, and competitive changes through structured datasets designed for analytical workflows.
This approach can support restaurant chains, food brands, delivery platforms, market researchers, investors, and digital-commerce teams seeking deeper visibility into regional food-delivery economics.
The Asia-Pacific Food Delivery Menu Pricing and Delivery Fee Benchmark highlights a market that has moved rapidly from pandemic-era adoption to a more competitive and data-driven ecosystem. Between 2020 and 2026, platforms and restaurants have progressively shifted from customer acquisition through heavy discounting toward stronger emphasis on efficiency, retention, differentiated pricing, and sustainable economics.
Regional market growth remains substantial. APAC's online food-delivery market generated approximately $120.1 billion in 2024 and is forecast to reach nearly $223 billion by 2030 under one market methodology. Southeast Asia alone recorded $22.7 billion in food-delivery GMV in 2025, demonstrating the continuing strength of digital ordering across the region.
For restaurants and platforms, the next competitive advantage will increasingly come from understanding effective customer cost rather than menu price alone. Delivery fees, discounts, subscriptions, service charges, availability, and basket composition all influence consumer value.
A comprehensive benchmarking strategy can reveal regional price gaps, platform differences, promotional intensity, restaurant positioning, and changing delivery economics. These insights can support better pricing decisions and more informed competitive strategies.
Want to benchmark food-delivery prices, menus, promotions, and fees across Asia-Pacific? Partner with Actowiz Metrics to transform digital food-delivery data into actionable pricing and competitive intelligence!
Expert blogs, research reports and infographics — practical, data-driven reading across e-commerce and quick-commerce.
Most fields are optional — the more you share, the better your sample.

.webp "infographics")
.webp "infographics")