BLOG


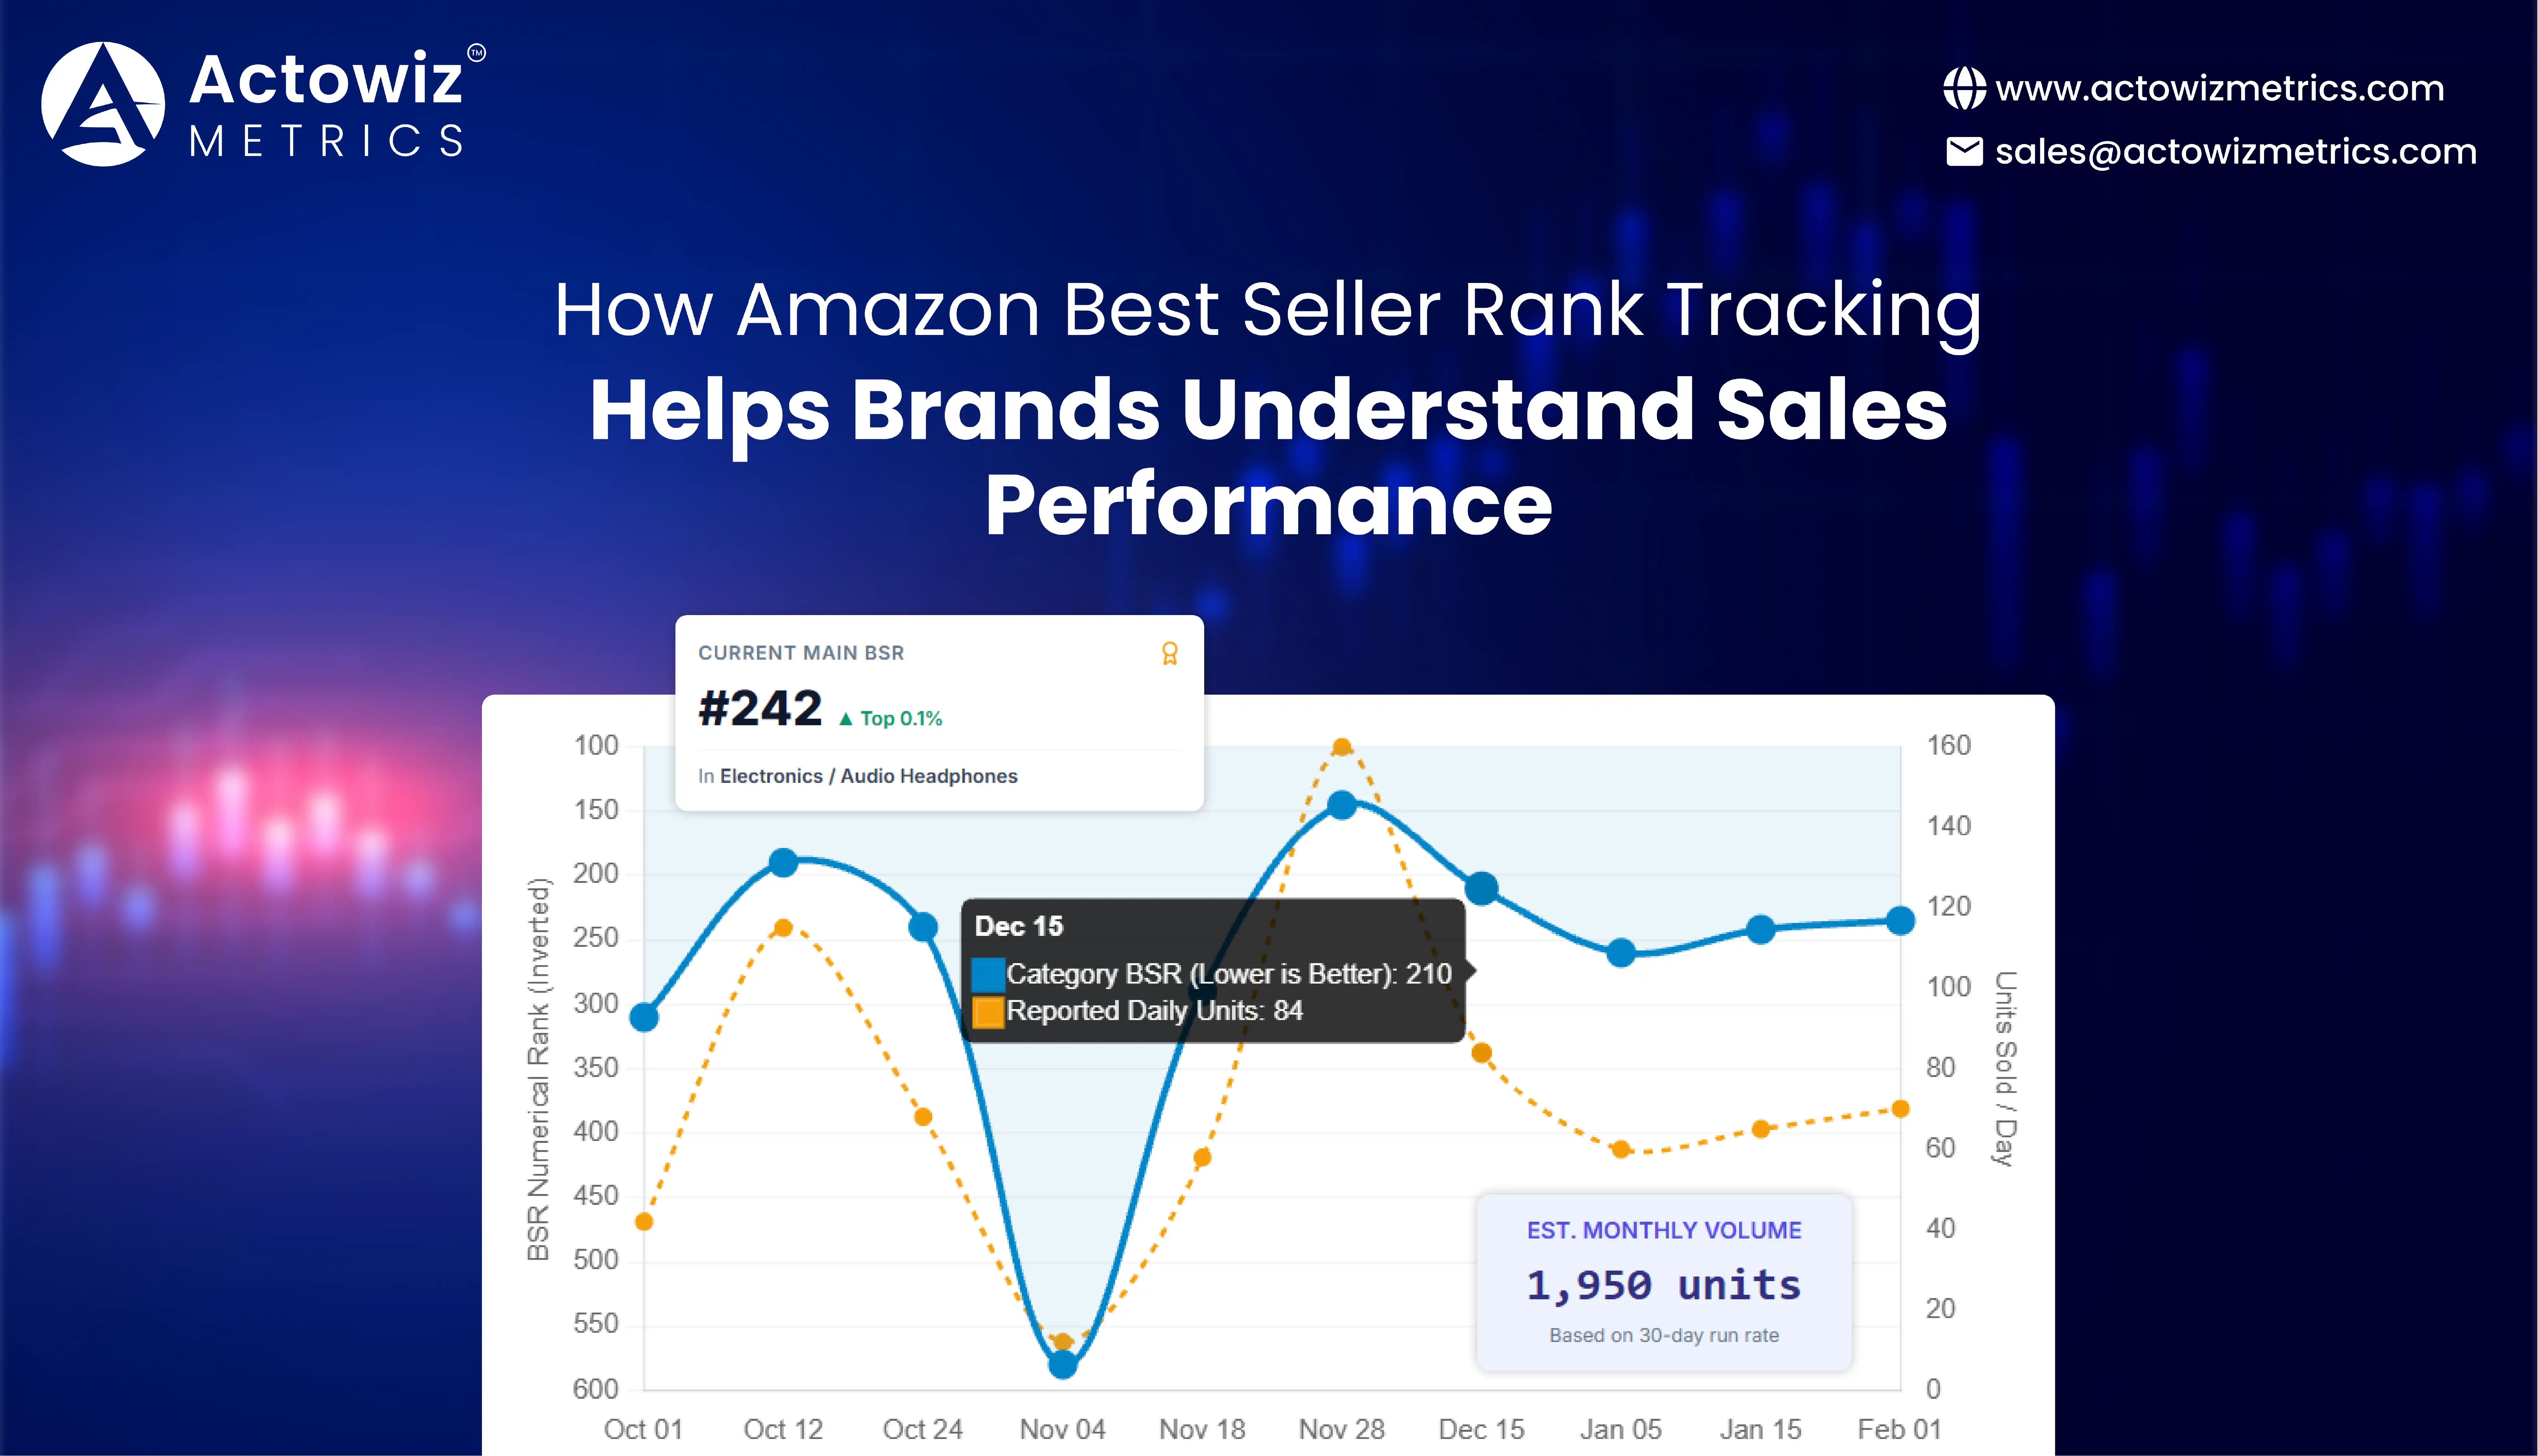
Amazon Best Seller Rank (BSR) helps brands understand how their products sell relative to other products in the same Amazon category. Amazon Best Seller Rank Tracking turns this changing rank into a historical performance signal, helping sellers identify sales momentum, seasonal patterns, competitive shifts, and potential demand changes. When combined with Amazon.com Best Selling Brands Analytics, it gives businesses a broader view of product performance and brand-level opportunities.
For marketplace managers, brand owners, and e-commerce analysts, the challenge is that a single BSR value provides only a snapshot. A product's rank can change as competing products sell, demand fluctuates, or seasonal shopping patterns develop. Brands therefore need historical context rather than relying on a single number to judge performance.
Amazon explains that its Best Sellers Rank is based on sales, with recent sales weighted more heavily than older sales. Customer reviews and page views do not directly determine BSR. Products can also have different ranks in different categories and Amazon marketplaces. Source: Amazon's official BSR guide.
For Actowiz Metrics, this creates an opportunity to help businesses organize marketplace data into useful reports. By tracking rank movements alongside pricing, product availability, promotions, and category competition, brands can investigate what may be driving performance changes and make better-informed decisions.
Amazon BSR Monitoring helps businesses understand whether a product's relative sales position is improving, weakening, or fluctuating. Because BSR is a comparative measure, a lower numerical rank generally indicates stronger sales performance relative to other products in the relevant category.
However, rank movement should not be treated as a direct measurement of units sold. A product can change rank because its sales change, because competing products sell more or less, or because the relative position of products in its category shifts. Amazon does not publish a universal conversion formula that turns every BSR value into an exact sales count.
With Amazon Best Seller Rank Tracking, brands can record rank values at consistent intervals and compare daily, weekly, monthly, and seasonal patterns. This is particularly useful when reviewing campaign periods, product launches, inventory replenishment, and changes in competitive activity.
Consider the difference between two observations: a product ranked #500 today and #800 next week has moved to a weaker relative position, but the rank alone cannot establish whether its unit sales declined. Competitors may simply have sold more. Teams should compare rank history with actual sales reports wherever available.
A useful monitoring framework includes:
| Metric | What it reveals | Business application |
|---|---|---|
| Current BSR | Present relative sales position | Review current marketplace standing |
| Average BSR over a period | Typical rank during the selected period | Reduce reliance on one-day fluctuations |
| Best and worst observed ranks | Range of relative performance | Identify peaks and weaker periods |
| Rank volatility | Frequency and size of changes | Investigate unstable performance |
| Category-specific BSR | Relative position in a particular category | Compare more relevant competitors |
These metrics are analytical measures businesses can calculate from collected rank observations; they are not additional official Amazon ranking scores.
The main principle is to interpret rank as a signal that prompts investigation, not as proof of a specific cause. This distinction helps marketplace teams avoid overreacting to temporary movements and focus on sustained trends.
Amazon Best Seller Rank Analysis helps businesses move from isolated observations to a more complete picture of product performance. A historical series can show whether a product repeatedly gains relative position during promotional periods, experiences recurring seasonal peaks, or becomes less competitive over time.
Amazon's official guidance states that recent sales receive more weight than older sales when calculating BSR. It also explains that a sales rank may take time to reflect an order and that not every category displays a rank. Source: Amazon Seller Central Sales Rank FAQ.
These details matter when creating a monitoring schedule. A rank recorded immediately after a campaign begins may not reflect the campaign's full effect. Likewise, a missing observation should not automatically be interpreted as zero sales or a failed product.
Brands should preserve the timestamp, marketplace, category, product identifier, and source for every observation. This makes comparisons more reliable and helps teams distinguish genuine movement from missing data or inconsistent collection intervals.
A practical historical analysis can include the following steps:
| Historical pattern | What it may indicate | Follow-up investigation |
|---|---|---|
| Sustained improvement in rank | Stronger relative sales performance | Check sales reports and campaign activity |
| Short-lived improvement | Temporary demand or competitive movement | Review promotions and the following period |
| Repeated seasonal peaks | Potential recurring demand pattern | Compare equivalent seasonal windows |
| Gradual deterioration | Possible weakening relative position | Investigate pricing, availability, and competition |
| Frequent sharp swings | Volatile relative performance | Check campaign timing and data consistency |
The patterns above are analytical interpretations, not guaranteed explanations. Rank history becomes more useful when businesses connect it to verified operational data instead of assuming that every movement has the same cause.
Amazon Product Sales Rank Tracking provides a way to observe relative sales performance for individual products and compare changes over time. It is especially useful for identifying products that deserve closer investigation, but it should complement rather than replace a seller's own sales reports.
Amazon's financial disclosures illustrate the scale of the marketplace. Amazon reported total net sales of $386.1 billion in 2020, $469.8 billion in 2021, $514.0 billion in 2022, $574.8 billion in 2023, $638.0 billion in 2024, and $716.9 billion in 2025. These are company-wide net sales across Amazon's business, not Amazon marketplace product sales alone and not BSR data. Sources: Amazon's annual reports.
The figures provide market context, but they cannot be used to infer an individual product's sales or rank. For brand managers, the more useful question is whether a product's own sales history supports the interpretation suggested by its rank.
| Fiscal year | Amazon total net sales (US$ billions) | Relevance to rank analysis |
|---|---|---|
| 2020 | 386.1 | Historical business context |
| 2021 | 469.8 | Compare product performance with its own baseline |
| 2022 | 514.0 | Examine longer-term category and product trends |
| 2023 | 574.8 | Keep brand-level conclusions separate from company totals |
| 2024 | 638.0 | Validate product insights using listing-level evidence |
| 2025 | 716.9 | Use current historical context without assuming individual outcomes |
| 2026 | Full-year figure not yet available as of October 22, 2026 | Analyze available year-to-date product data separately |
Source: Amazon's published annual financial reports. Figures are rounded. The 2026 row is not a forecast.
For practical use, brands should compare BSR with units sold, revenue, conversion rate, stock availability, and advertising activity when those metrics are accessible. If rank improves while sales reports also show higher unit volume, the two signals support a stronger interpretation than rank alone. If rank improves without a corresponding sales increase, the team should investigate relative competitor performance and differences in measurement periods.
A good dashboard keeps observed rank, reported sales, and estimated sales clearly separate. This prevents an analytical indicator from being mistaken for a confirmed sales figure.
Amazon Category Rank Monitoring helps businesses understand where a product stands among relevant competitors. Amazon can display multiple BSR values for one product when it belongs to different categories or subcategories. A product may therefore have a stronger position in a niche subcategory than in its broader category.
This distinction is important for product and category managers. Comparing a product's rank in one category with a competitor's rank in another can lead to misleading conclusions. The products may be evaluated against different groups of listings, each with its own demand patterns.
When combined with Amazon Best Seller Rank Tracking, category-level comparisons can help teams identify which products are gaining relative strength within their most relevant competitive sets.
A sound comparison process should:
For example, a kitchen accessory may have a strong position within a narrowly defined subcategory while ranking much lower in the wider Home & Kitchen category. Both figures can be valid, but each answers a different competitive question.
| Comparison level | Best use | Important limitation |
|---|---|---|
| Broad category | Understand wider category position | Includes a more diverse competitive set |
| Subcategory | Compare closely related products | Depends on category assignment |
| Product variant | Review differences across sizes or styles | Variants may not be directly comparable |
| Marketplace | Evaluate performance in a specific country store | Rankings differ across Amazon marketplaces |
Category-level tracking is most effective when the comparison set remains consistent. If Amazon changes a product's category assignment, analysts should document that change and avoid treating the resulting rank movement as a straightforward change in sales performance.
The objective is not to find one universally meaningful BSR number. It is to identify the comparison that best answers the business question.
Amazon BSR Competitor Analysis helps brands compare relative product performance across a defined set of competing listings. It can reveal which products frequently occupy stronger rank positions, which competitors experience recurring peaks, and where category leadership changes over time.
When supported by Amazon Best Seller Rank Tracking, competitor benchmarking becomes more informative than a one-time ranking comparison. Historical observations can show whether a competitor's strong position is sustained or associated with a brief period of activity.
However, rank does not disclose a competitor's exact sales volume, profit margin, advertising spend, or inventory levels. Businesses should not assume those details from BSR alone. Amazon's own guidance distinguishes sales rank from customer-review quality and page-view data. Source: Amazon's BSR guide.
A practical competitor report can combine rank history with observable listing information and the brand's own internal metrics.
| Competitive signal | What to examine | Decision it can inform |
|---|---|---|
| Competitor holds a stronger rank consistently | Rank history and category alignment | Review product differentiation and positioning |
| Competitor rank improves during a promotion | Price and promotion history, where available | Evaluate campaign timing |
| Rank changes alongside listing revisions | Product content and offer changes | Investigate possible contributors |
| Several competitors improve simultaneously | Category-wide demand and seasonal context | Distinguish market movement from brand-specific change |
| Your rank weakens while internal sales remain steady | Competitor performance and category movement | Reassess relative rather than absolute performance |
Brands should define their competitive set carefully. Direct substitutes, premium alternatives, and products serving different use cases should not automatically be combined into one benchmark.
It is also important to separate observations from hypotheses. If a competitor improves its rank after changing price, the timing may justify further analysis, but it does not prove that the price change caused the improvement. Promotions, stock availability, and wider demand may also contribute.
For actionable reporting, each competitor finding should include the observation period, category, rank trend, available supporting evidence, and the next question for the team to investigate.
Amazon BSR History Tracking gives businesses a way to examine product performance across longer periods instead of relying on isolated daily observations. Long-term history can support seasonal planning, product portfolio reviews, campaign evaluation, and investigations into recurring changes in relative sales position.
A useful historical record should preserve original observations rather than only storing a monthly average. Averages can simplify reporting, but they may hide short-lived peaks, abrupt drops, and periods when rank data was unavailable.
Brands should also annotate significant business events. These may include a price adjustment, a promotion, a stockout, a product redesign, a listing change, or the introduction of a competing product. Such annotations help analysts formulate explanations and test them against other available evidence.
The 2020–2026 period can be used as a historical analysis window, but not every year should be treated as a complete or directly comparable dataset. Amazon's published financial results provide annual context through 2025, while 2026 is still in progress as of October 22, 2026. Product-level BSR observations must be collected separately; Amazon's corporate revenue figures cannot substitute for them.
| Reporting period | Recommended analysis | Data-quality check |
|---|---|---|
| 2020–2021 | Establish historical baselines where records exist | Verify collection coverage and category consistency |
| 2022–2023 | Compare longer-term movements and seasonal patterns | Flag missing intervals and product changes |
| 2024–2025 | Review recent historical performance and competitor shifts | Validate against available sales and inventory records |
| 2026 year to date | Analyze the available period without annualizing rank changes automatically | Clearly mark the last observation date and incomplete periods |
These are recommended analytical periods, not claims that complete historical BSR datasets are publicly available for every product.
For reliable reporting, businesses should retain a consistent product identifier, marketplace, category, timestamp, rank value, source, and data-quality status. Where a product is discontinued, a listing changes, or a category is reassigned, the record should make that event visible.
Long-term history is especially useful when it supports a decision. A recurring seasonal pattern may help inform inventory planning, while a sustained deterioration may trigger a competitive review. In both cases, rank should be validated against the metrics that directly measure the business outcome.
Actowiz Metrics helps businesses approach marketplace intelligence through structured data collection, competitive research, and performance analysis. For Amazon sellers and brand managers, the priority is to connect product-ranking observations with the commercial indicators that explain what is happening across the marketplace.
A useful analytics workflow can combine Amazon Price Tracking with Amazon Best Seller Rank Tracking to help businesses investigate the relationship between price movements and relative sales performance. By reviewing both signals over consistent periods, teams can identify changes worth investigating rather than assuming that a price adjustment directly caused a ranking change.
For example, if a product's BSR improves after a price reduction, analysts can compare the observation with actual sales reports, promotional activity, inventory availability, and competitor movements. If those additional signals support the interpretation, the business can make a better-informed decision about future pricing. Without that validation, the rank movement remains a useful observation rather than proof of causation.
Actowiz Metrics can help businesses structure their marketplace research around several priorities:
Brands should also define the data they need before implementing a monitoring solution. Relevant requirements include marketplace coverage, product and category scope, collection frequency, historical depth, competitor selection, and access to internal sales data. Actual coverage and reporting capabilities should be confirmed with Actowiz Metrics for the intended use case.
Amazon also provides eligible brand representatives with Brand Analytics tools. Its Search Catalog Performance dashboard includes metrics such as search impressions, clicks, add-to-cart activity, and purchases, while Search Query Performance provides query-level shopping insights. These first-party metrics can complement rank observations when access is available. Source: Amazon Brand Analytics.
The recommended approach is to combine marketplace observations with verified business metrics, document the evidence behind conclusions, and measure the results of subsequent actions. This creates a more dependable foundation for product planning, pricing decisions, and competitive strategy.
Best Seller Rank is a useful indicator of relative product sales performance on Amazon, but it does not reveal exact sales volume or explain every change in demand. Brands gain more value by analyzing rank history, comparing products within the correct categories, and validating observations against sales, inventory, pricing, and competitive information.
A consistent Amazon Best Seller Rank Tracking process can help businesses identify performance patterns, investigate competitive changes, and make more informed marketplace decisions. Combining these insights with Ratings & Reviews Analysis adds customer-perspective context, helping teams distinguish ranking performance from product satisfaction and reputation.
For 2026, brands should focus on accurate data, comparable historical periods, and clear measurement practices. Every important finding should lead to a business question, a practical action, and a measurable follow-up.
Ready to strengthen your Amazon marketplace strategy? Connect with Actowiz Metrics to explore e-commerce intelligence solutions that help you monitor product performance, understand competitive movements, and make data-informed business decisions!
Expert blogs, research reports and infographics — practical, data-driven reading across e-commerce and quick-commerce.
Most fields are optional — the more you share, the better your sample.
.webp "infographics")
.webp "infographics")