BLOG




















The Whole Truth products analytics on Amazon India provides a data-driven view of how a fast-growing clean-label food and nutrition brand performs across product pricing, ratings, reviews, assortment, and marketplace visibility. For brands, category managers, and e-commerce teams, tracking these signals together is more useful than examining individual product pages because it reveals changes in customer perception, competitive positioning, and pricing behavior.
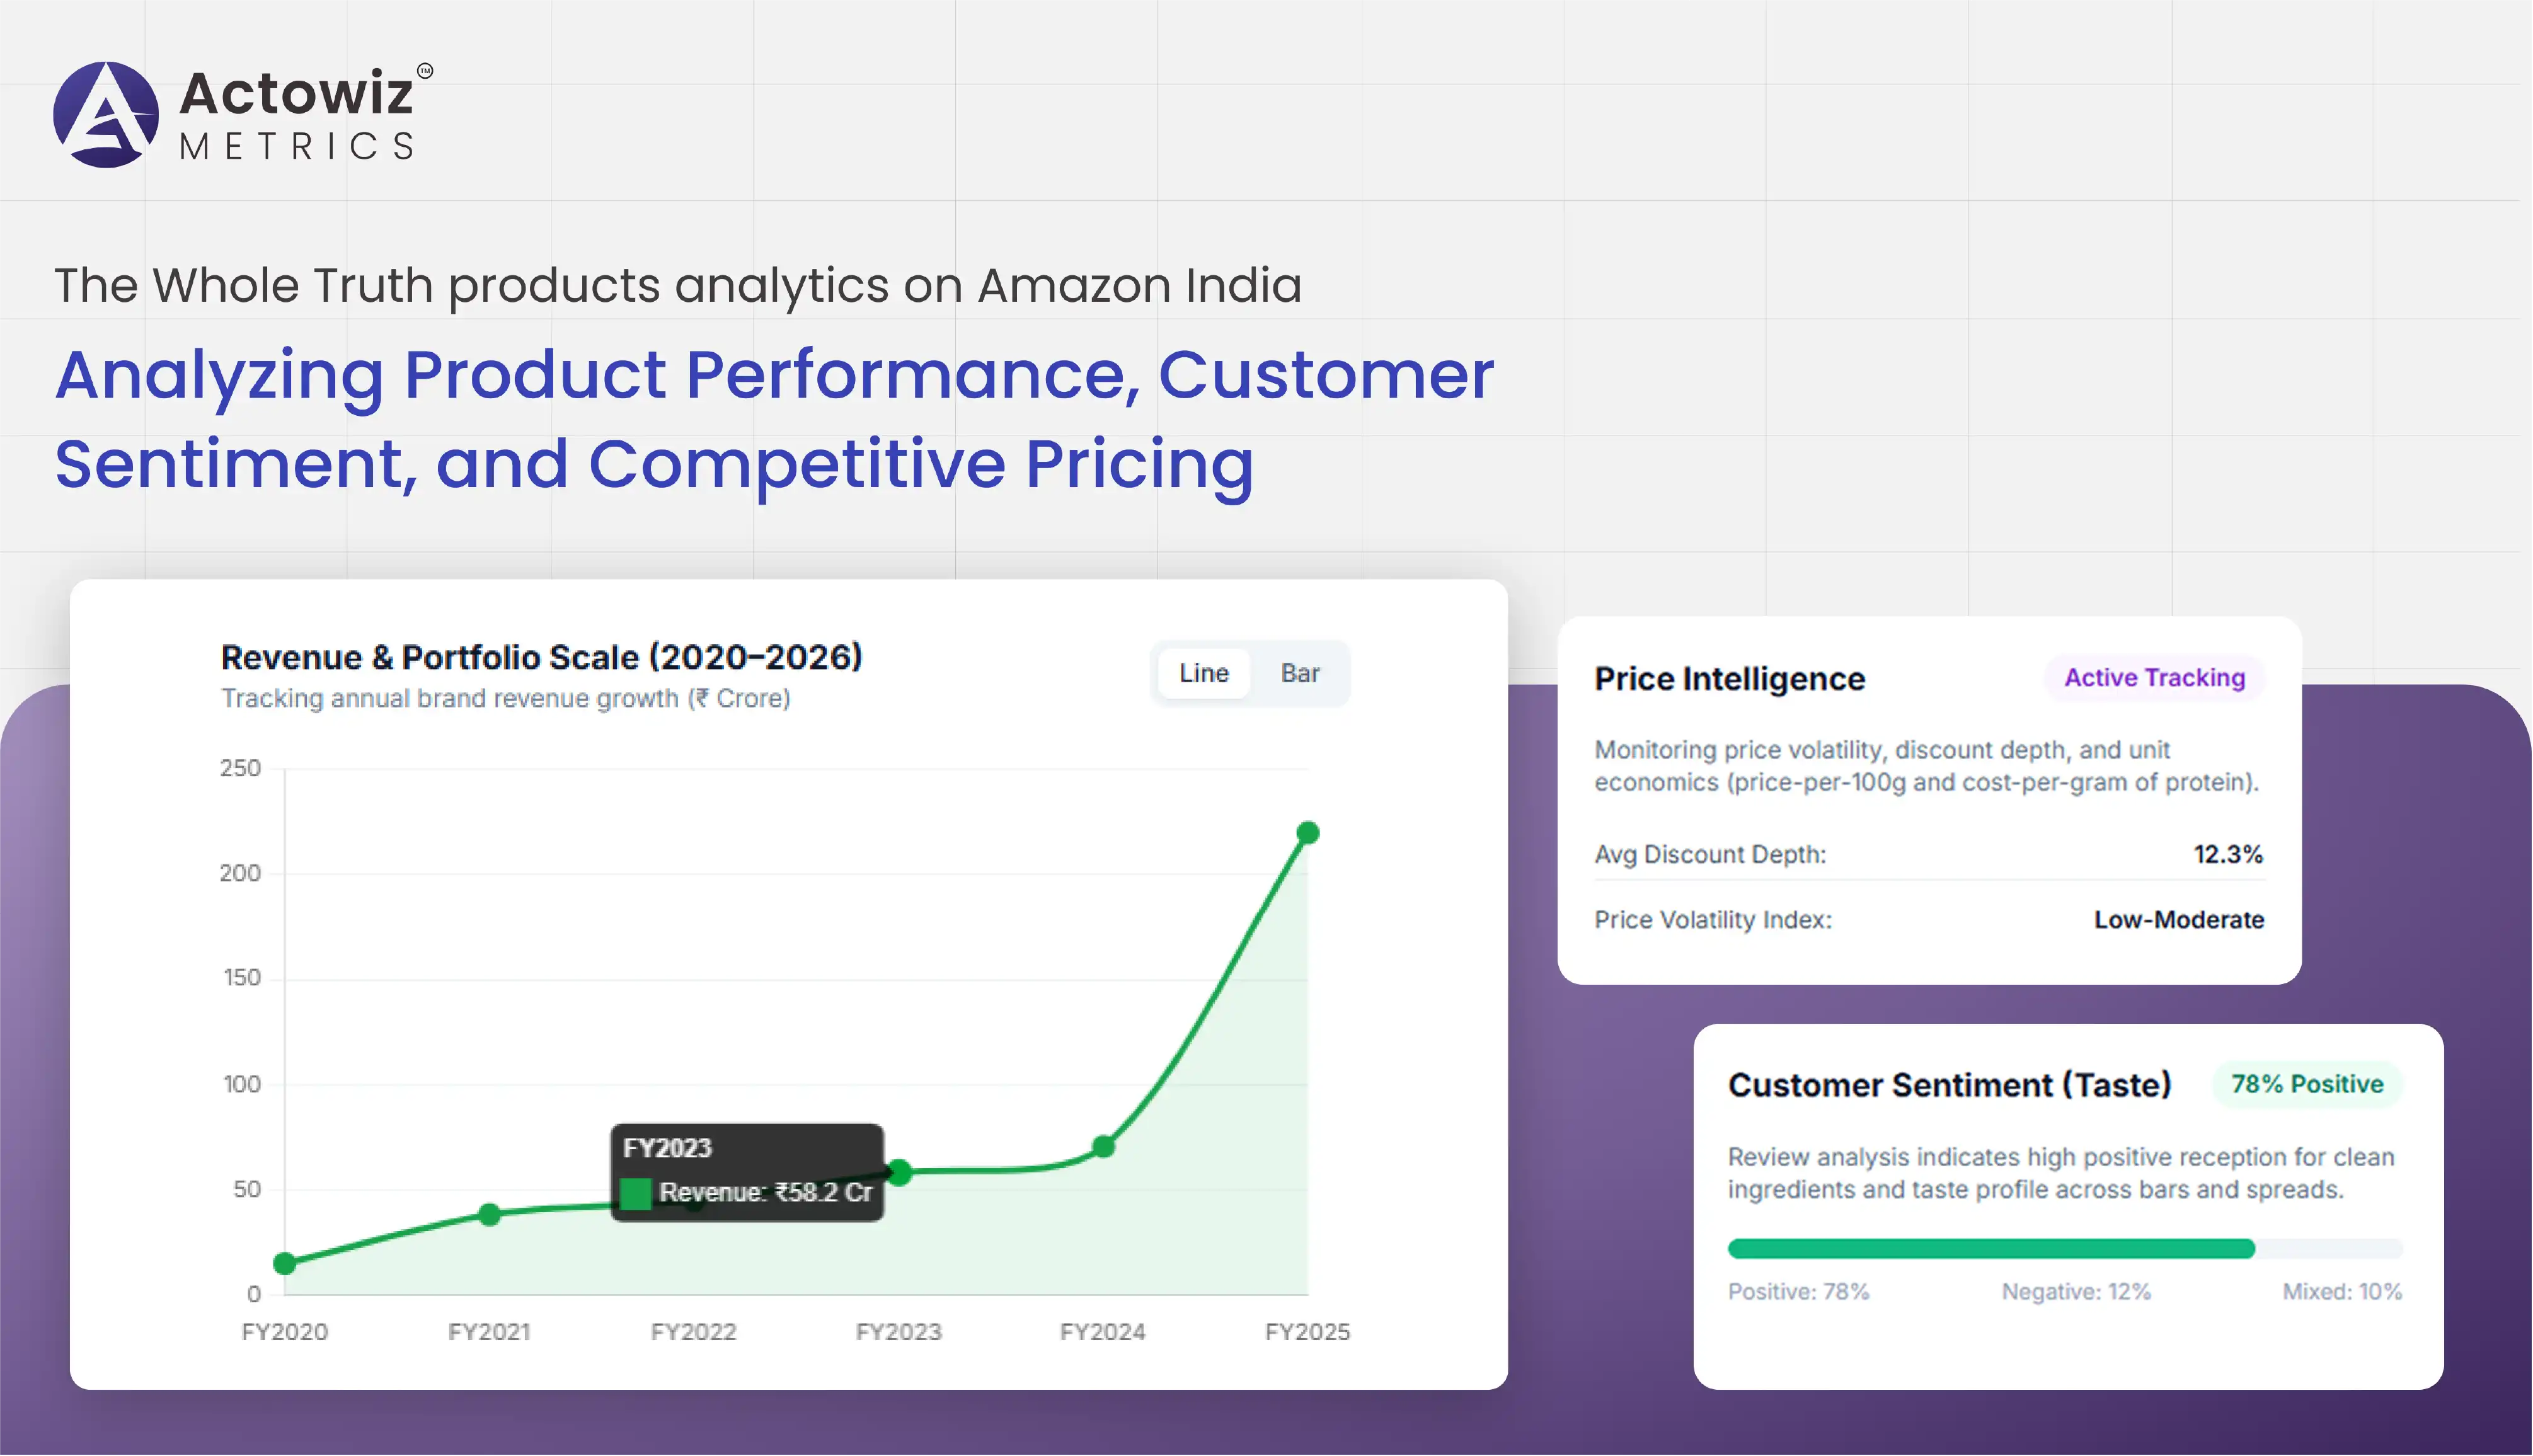
The Whole Truth was founded in 2019 and operates in the direct-to-consumer food and nutrition segment. Inc42 reports that the company generated ₹219.8 crore in FY2025 revenue, compared with ₹70.6 crore in FY2024, representing approximately 211.6% year-over-year growth. It also reports that the company raised its latest funding round in February 2026.
Its product portfolio has expanded considerably beyond its original snack positioning. The brand's current catalog includes protein bars, protein powders, muesli, nut spreads, dark cocoa bars, energy bars, children's nutrition products, and other food-related products. The official product catalog shows a wide range of pack sizes and price points, creating multiple dimensions for The Whole Truth Amazon Competitor Analysis.
Digital shelf analytics can help convert this marketplace information into measurable indicators such as price competitiveness, rating performance, review velocity, product availability, assortment depth, and bestseller positioning.
For Amazon India sellers and brands, the objective is not simply to determine which product has the highest rating. A stronger research framework asks:
The Whole Truth's official bestseller catalog provides a useful indication of the breadth of its current portfolio. Its listed products span protein bars, protein powders, muesli, nut spreads, dark cocoa products, energy bars, and other categories. The same page shows substantial variation in prices, pack sizes, ratings, and promotional discounts.
Selected examples from the current catalog include:
| Product / Category | Pack | Listed Price | Displayed Rating |
|---|---|---|---|
| Walnut Fudge Protein Bars | 5 × 55 g | ₹856 | 4.7 |
| Hazelnut Millet Protein Bars | 8 × 55 g | ₹1,369 | 4.6 |
| Double Cocoa Pro | 5 × 67 g | ₹845 | 4.7 |
| Ragi Cocoa 15g Protein Powder | 1 kg | ₹2,569 | 4.7 |
| Choco Fruit Crunch Muesli | 750 g | ₹783 | 4.7 |
| Unsweetened Peanut Butter | 925 g | ₹482 | 4.5 |
| 71% Dark Cocoa Bar | 3 × 80 g | ₹856 | 4.6 |
These figures are from the brand's current website rather than a historical Amazon snapshot, so they should be treated as current portfolio reference points rather than direct Amazon prices.
Third-party Amazon-oriented product tracking also identifies dozens of The Whole Truth products across protein powders, healthy foods, and protein bars, with individual products carrying different prices, ratings, and review counts. For example, WheySearch currently lists 39 products for the brand and records Amazon-linked price information and ratings for individual SKUs, supporting The Whole Truth Amazon Market Intelligence.
This demonstrates why a SKU-level marketplace dataset is valuable: category-level reporting can conceal substantial differences between individual products.
Competitive benchmarking provides context for understanding whether a product's price, rating, review volume, and assortment position are strong relative to competing products.
A useful Amazon India competitor dataset can compare The Whole Truth against brands operating in adjacent protein, healthy-snacking, clean-label, and nutrition categories.
| KPI | Brand SKU | Competitor A | Competitor B | Competitor C |
|---|---|---|---|---|
| Selling price | ₹X | ₹X | ₹X | ₹X |
| Rating | X/5 | X/5 | X/5 | X/5 |
| Review count | X | X | X | X |
| Discount | X% | X% | X% | X% |
| Pack size | X g | X g | X g | X g |
| Price/100 g | ₹X | ₹X | ₹X | ₹X |
The price-per-100g metric is particularly important for food products. A larger pack may appear more expensive but could have a lower unit cost than a smaller competing pack. The same principle applies to protein powders. Comparing a 1 kg product directly with a 500 g product using selling price alone can produce misleading conclusions.
A better comparison incorporates:
Selling price ÷ net weight = price per gram
and:
Selling price ÷ stated protein quantity = cost per gram of protein
This enables category managers to compare products on a more consistent basis.
The 2020-2026 period covers the rapid expansion of digital food, nutrition, and D2C commerce in India. The Whole Truth itself was founded in 2019, positioning its subsequent expansion within this broader period of digital-first consumer-brand development. Inc42 reports that its revenue increased from 70.6 crore in FY2024 to 219.8 crore in FY2025, indicating a substantial expansion in commercial scale. The company's current catalog also demonstrates expansion across multiple product families rather than dependence on a single snack category.
For marketplace researchers, The Whole Truth Amazon Product Price Tracking makes competitor analysis increasingly important because product performance needs to be assessed at the category, SKU, pack-size, and price-per-unit levels. A growing portfolio can create both opportunities and analytical complexity: new products need separate benchmarks, while existing products require historical comparisons to determine whether changes in price, reviews, ratings, or visibility correspond with changes in marketplace performance.
Market intelligence combines multiple marketplace signals to explain how products are positioned within a category.
For The Whole Truth, an Amazon-focused research dataset could include:
The value comes from connecting these fields.
For example, a product with a 4.7 rating may appear highly successful. However, if its review count is considerably lower than comparable products, the rating alone may not provide enough evidence to determine market penetration.
Similarly, a product with a lower rating but significantly higher review volume may have greater historical customer adoption.
A useful research dashboard could classify products into four analytical groups:
| Segment | Rating | Review Volume | Interpretation |
|---|---|---|---|
| Established leader | High | High | Strong customer validation |
| Emerging product | High | Low | Positive early response |
| High-volume concern | Low/Medium | High | Large customer base but potential issues |
| New/low visibility | Low/Medium | Low | Requires additional monitoring |
These classifications should be treated as analytical segments, not definitive measures of commercial success.
The company's development provides an important backdrop for marketplace intelligence. Inc42 identifies The Whole Truth as a 2019-founded company and reports FY2025 revenue of ₹219.8 crore, up from ₹70.6 crore in FY2024. Its February 2026 funding round further indicates that the company continued to attract capital as it expanded. Meanwhile, the current product catalog spans numerous product families and pack configurations, from protein bars and protein powders to muesli and nut spreads.
This evolution makes longitudinal marketplace research more useful. A 2020-era analysis centered primarily on snack products would not adequately represent the broader portfolio visible today. Between 2020 and 2026, researchers can therefore examine assortment expansion, new category entry, changes in price architecture, product launches, rating development, and review accumulation. The Whole Truth Amazon Product Reviews Analysis can help structure these review and rating signals alongside broader product-performance metrics. A six-year dataset can distinguish temporary marketplace fluctuations from longer-term portfolio changes.
Price tracking provides a historical record of how products move through different pricing states.
A marketplace price dataset can capture:
| Metric | Example |
|---|---|
| MRP | ₹1,040 |
| Current selling price | ₹912 |
| Discount | 12.3% |
| Previous price | ₹949 |
| Price change | -3.9% |
| Unit price | ₹X/100 g |
| Collection date | 2026-09-28 |
The importance of historical price data is that today's price provides only one observation.
Suppose a protein bar normally sells for ₹1,040 but falls to ₹912 for a limited period. Without historical records, the discount may look like a permanent price repositioning.
With a time series, analysts can determine whether the change is:
The official The Whole Truth catalog currently displays numerous promotional price reductions. For example, several protein-bar and protein-powder products are shown with discounts from their listed MRP, while some products are shown without discounts.
This creates an opportunity to compare discount depth across product families.
A useful metric is:
Discount depth = (MRP - selling price) ÷ MRP × 100
Another useful measure is price volatility:
Price volatility = frequency and magnitude of observed price changes over a defined period
These measures can help category managers distinguish stable pricing from frequent promotional activity.
Between 2020 and 2026, online price monitoring became increasingly relevant as consumers could compare products across marketplaces and brand websites. For The Whole Truth, the expansion from a relatively focused clean-food proposition into a broader portfolio means price tracking now needs to account for multiple product families and pack sizes. The current official catalog illustrates this range: protein powders extend from smaller sachet formats to 1 kg packs, while protein bars are offered in multiple box sizes and variants.
Third-party Amazon-focused tracking also records different price points for individual products and indicates price-history functionality for selected SKUs. From a research perspective, 2020-2026 historical tracking can help identify how the brand's price architecture has evolved, whether premium products maintain price differentiation, and whether promotional intensity varies by category. The Whole Truth Amazon Digital Shelf Analytics can bring these pricing signals together with assortment, availability, ratings, and visibility metrics for a broader marketplace view. However, historical Amazon prices should be sourced from dated marketplace observations rather than inferred from today's catalog, because current product pages cannot establish historical prices.
Customer reviews provide qualitative evidence that complements pricing and product-level metrics.
Review analysis can identify recurring themes such as:
Instead of counting only positive and negative reviews, an analytical system can classify each review by topic and sentiment.
| Review Theme | Positive | Negative | Mixed |
|---|---|---|---|
| Taste | 78% | 12% | 10% |
| Texture | 71% | 19% | 10% |
| Value | 61% | 29% | 10% |
| Packaging | 75% | 18% | 7% |
| Product quality | 82% | 11% | 7% |
This approach becomes particularly useful when review volume increases.
For example, if "taste" remains positive but "value" becomes increasingly negative, the brand may have a pricing-perception issue rather than a product-quality issue.
If negative comments about packaging suddenly increase, the issue may relate to logistics or packaging changes.
Third-party Amazon-oriented data currently shows different review counts and ratings across The Whole Truth products. For example, WheySearch lists one Mini Protein Bars SKU with 214 reviews and a 4.3 rating, alongside other products with different rating and review-volume combinations.
Customer-review analysis became increasingly valuable during 2020-2026 as digital shoppers gained access to larger volumes of user-generated product feedback. For The Whole Truth, the growth of the product portfolio means review intelligence can now be applied across multiple categories rather than a single product segment. The current official catalog shows ratings alongside products across protein bars, protein powders, muesli, spreads, and other categories. Third-party marketplace-oriented tracking likewise records product ratings and review counts for Amazon-linked listings.
Over a 2020-2026 research window, The Whole Truth best seller analytics Amazon India can complement review datasets by helping researchers examine product visibility, customer response, and marketplace positioning. The critical methodological requirement is preserving the collection date. A current review count cannot be presented as evidence of what the review count was in 2021 or 2023. Historical conclusions should therefore rely on archived snapshots or regularly collected datasets.
Digital shelf measurement brings product, price, availability, content, ratings, and customer feedback into one analytical framework.
For a brand operating across Amazon India and other channels, useful KPIs include:
| KPI | What It Measures |
|---|---|
| Assortment coverage | Number of active products |
| Price competitiveness | Relative price position |
| Availability rate | Product in-stock visibility |
| Rating | Customer perception |
| Review velocity | Growth in customer feedback |
| Content completeness | Product-page quality |
| Discount depth | Promotional positioning |
| Category visibility | Presence within relevant categories |
| Pack-size coverage | Range of consumer options |
The current official catalog illustrates why this framework is needed. The Whole Truth has products spanning several price and pack-size tiers. For example, its current protein range includes 500 g, 1 kg, and multi-sachet formats, while protein bars are available in multiple box configurations.
A digital-shelf dataset can therefore compare products not only by absolute price but also by:
These normalized metrics make cross-product comparisons more meaningful.
The 2020-2026 period is particularly relevant for studying digital shelf expansion because brands have increasingly used multiple product formats, marketplaces, and direct channels. The Whole Truth's current catalog shows substantial assortment breadth, including protein products, bars, muesli, spreads, dark cocoa products, and other food categories. Inc42's reported increase in revenue from 70.6 crore in FY2024 to 219.8 crore in FY2025 provides a measurable indicator of the company's recent scale expansion.
As the assortment grows, digital shelf measurement becomes more complex because each new SKU creates additional combinations of price, rating, reviews, availability, and competitive positioning. A longitudinal dataset can show whether assortment expansion is accompanied by stronger visibility, whether certain categories accumulate reviews faster, and whether premium products maintain differentiated price positions. Again, these conclusions require historical observations rather than extrapolation from today's product catalog.
Best-seller analysis can help researchers identify which products attract stronger marketplace signals.
However, bestseller status should not be treated as equivalent to revenue or profitability unless Amazon provides the relevant underlying sales data.
A research framework can instead combine observable indicators:
| Signal | Analytical Meaning |
|---|---|
| Rating | Customer evaluation |
| Review count | Accumulated customer feedback |
| Review velocity | Recent engagement |
| Price | Consumer price point |
| Discount | Promotional intensity |
| Availability | Ability to purchase |
| Category position | Marketplace visibility |
| Product assortment | Portfolio breadth |
The official The Whole Truth bestseller page currently identifies numerous products across its portfolio and displays prices, pack sizes, ratings, and promotional information.
For example, current displayed ratings include 4.7 for Walnut Fudge Protein Bars, 4.7 for Ragi Cocoa 15g Protein Powder, 4.7 for Choco Fruit Crunch Muesli, and 4.5 for the 925 g unsweetened peanut butter.
These figures show customer-rating signals but do not independently prove sales leadership.
For more rigorous research, bestseller analysis should therefore combine marketplace observations with time-series measurements.
A product that maintains strong ratings while steadily increasing review volume may represent a different performance pattern from a product with a high rating but little review growth.
The Whole Truth's growth trajectory provides important context for understanding its marketplace development. The company was founded in 2019, and Inc42 reports FY2025 revenue of 219.8 crore, up from 70.6 crore in FY2024. The company also completed a Series D funding round in February 2026, according to Inc42 and CB Insights. Meanwhile, its current bestseller catalog spans a wide range of categories and formats, suggesting that marketplace analysis now needs to account for multiple product families.
From 2020 to 2026, researchers can use bestseller observations, rating changes, review accumulation, price history, and assortment changes to build a longitudinal view of product visibility. Such a dataset should distinguish observable marketplace signals from unavailable sales information. A bestseller badge or category position can be recorded as an observed marketplace indicator, but it should not automatically be interpreted as a precise sales ranking unless supported by verified sales data.
Actowiz Metrics can help businesses transform fragmented marketplace observations into structured datasets for recurring e-commerce research and analytics. Amazon analytics can be built around the specific product universe, competitors, categories, and KPIs that matter to a business.
Product Data Collection — Capture product names, ASINs, brands, categories, pack sizes, prices, MRP, discounts, ratings, reviews, availability, and other publicly observable attributes.
Price Intelligence — Track product prices over time and calculate price changes, discount depth, price-per-unit metrics, and competitor price gaps.
Review Intelligence — Collect review information and organize it by product, rating, date, topic, and sentiment where the available data supports those fields.
Assortment Monitoring — Identify new products, discontinued products, new pack sizes, product variants, and category expansion.
Competitor Benchmarking — Create standardized comparisons across brands using price, ratings, reviews, assortment, and other observable marketplace signals.
Historical Data — Store recurring observations so that businesses can compare current marketplace conditions with earlier periods.
This approach is particularly useful for brands, category managers, market researchers, consumer intelligence teams, and e-commerce analysts who need repeatable datasets rather than one-time snapshots.
For The Whole Truth specifically, the breadth of the current catalog means analysis can be organized by product family:
The official catalog confirms the breadth of these product groups and the variation in pack sizes, prices, discounts, and displayed ratings.
The resulting dataset can support dashboards, historical analysis, competitor benchmarking, pricing research, product research, and category intelligence.
A 2020-2026 dataset can answer questions that a single marketplace snapshot cannot.
| Research Question | Required Data |
|---|---|
| Which products gained visibility? | Historical product observations |
| Which SKUs changed price most often? | Dated price records |
| Which products accumulated reviews fastest? | Review-count snapshots |
| Which categories expanded? | Historical assortment |
| Which products maintained high ratings? | Rating history |
| Which competitors changed pricing? | Competitor price history |
| Which products entered new pack sizes? | Product-attribute history |
| Which promotions were recurring? | Discount observations |
The most important principle is date integrity.
Current information can describe the current marketplace. Historical claims require historical data.
For example, the current official catalog can establish that The Whole Truth currently sells a particular protein bar or protein powder, but it cannot independently establish that the same product had the same price or rating in 2021. Historical research should therefore use dated observations, archived pages, or continuously collected datasets.
The Whole Truth's marketplace presence provides a useful case for studying how product assortment, pricing, customer feedback, and digital visibility interact within India's online food and nutrition market.
The company's reported growth—from 70.6 crore revenue in FY2024 to 219.8 crore in FY2025 —coincides with a broad current product portfolio spanning protein bars, protein powders, muesli, nut spreads, dark cocoa products, and other categories.
Price & promotion intelligence can add another layer by tracking how product prices and discounts change over time, while review and rating analysis can help explain customer response. A robust research framework should combine these signals rather than treating any individual metric as a complete measure of marketplace performance.
The Whole Truth products analytics on Amazon India can therefore be structured around five core dimensions:
The result is a more comprehensive view of product performance and market positioning.
Want to build a structured dataset for Amazon India product, pricing, review, and competitive research? Partner with Actowiz Metrics to turn marketplace data into recurring, analytics-ready intelligence for smarter e-commerce decisions!
Expert blogs, research reports and infographics — practical, data-driven reading across e-commerce and quick-commerce.
Most fields are optional — the more you share, the better your sample.
.webp "infographics")
.webp "infographics")