BLOG


The U.S. grocery market has undergone major changes between 2020 and 2026, driven by inflation, shifting consumer behavior, omnichannel shopping, private-label expansion, promotions, and the rapid development of digital grocery channels. For grocery brands and retailers, comparing shelf prices across major platforms has become increasingly important because the same SKU can appear at different prices depending on retailer, location, promotion, pack size, and fulfillment model.
Walmart Target Kroger Amazon grocery price intelligence USA provides a framework for comparing these marketplace dynamics across major grocery channels. Walmart, Target, Kroger, and Amazon represent different retail models, making cross-retailer data useful for understanding pricing gaps, promotional movements, assortment changes, and competitive positioning.
At the same time, Grocery and FMCG (CPG) digital shelf analytics has become increasingly important as consumers discover and purchase more grocery products through digital channels. USDA research found that 19.3% of U.S. residents who regularly shopped for groceries purchased groceries online at least once during the previous 30 days in 2022.
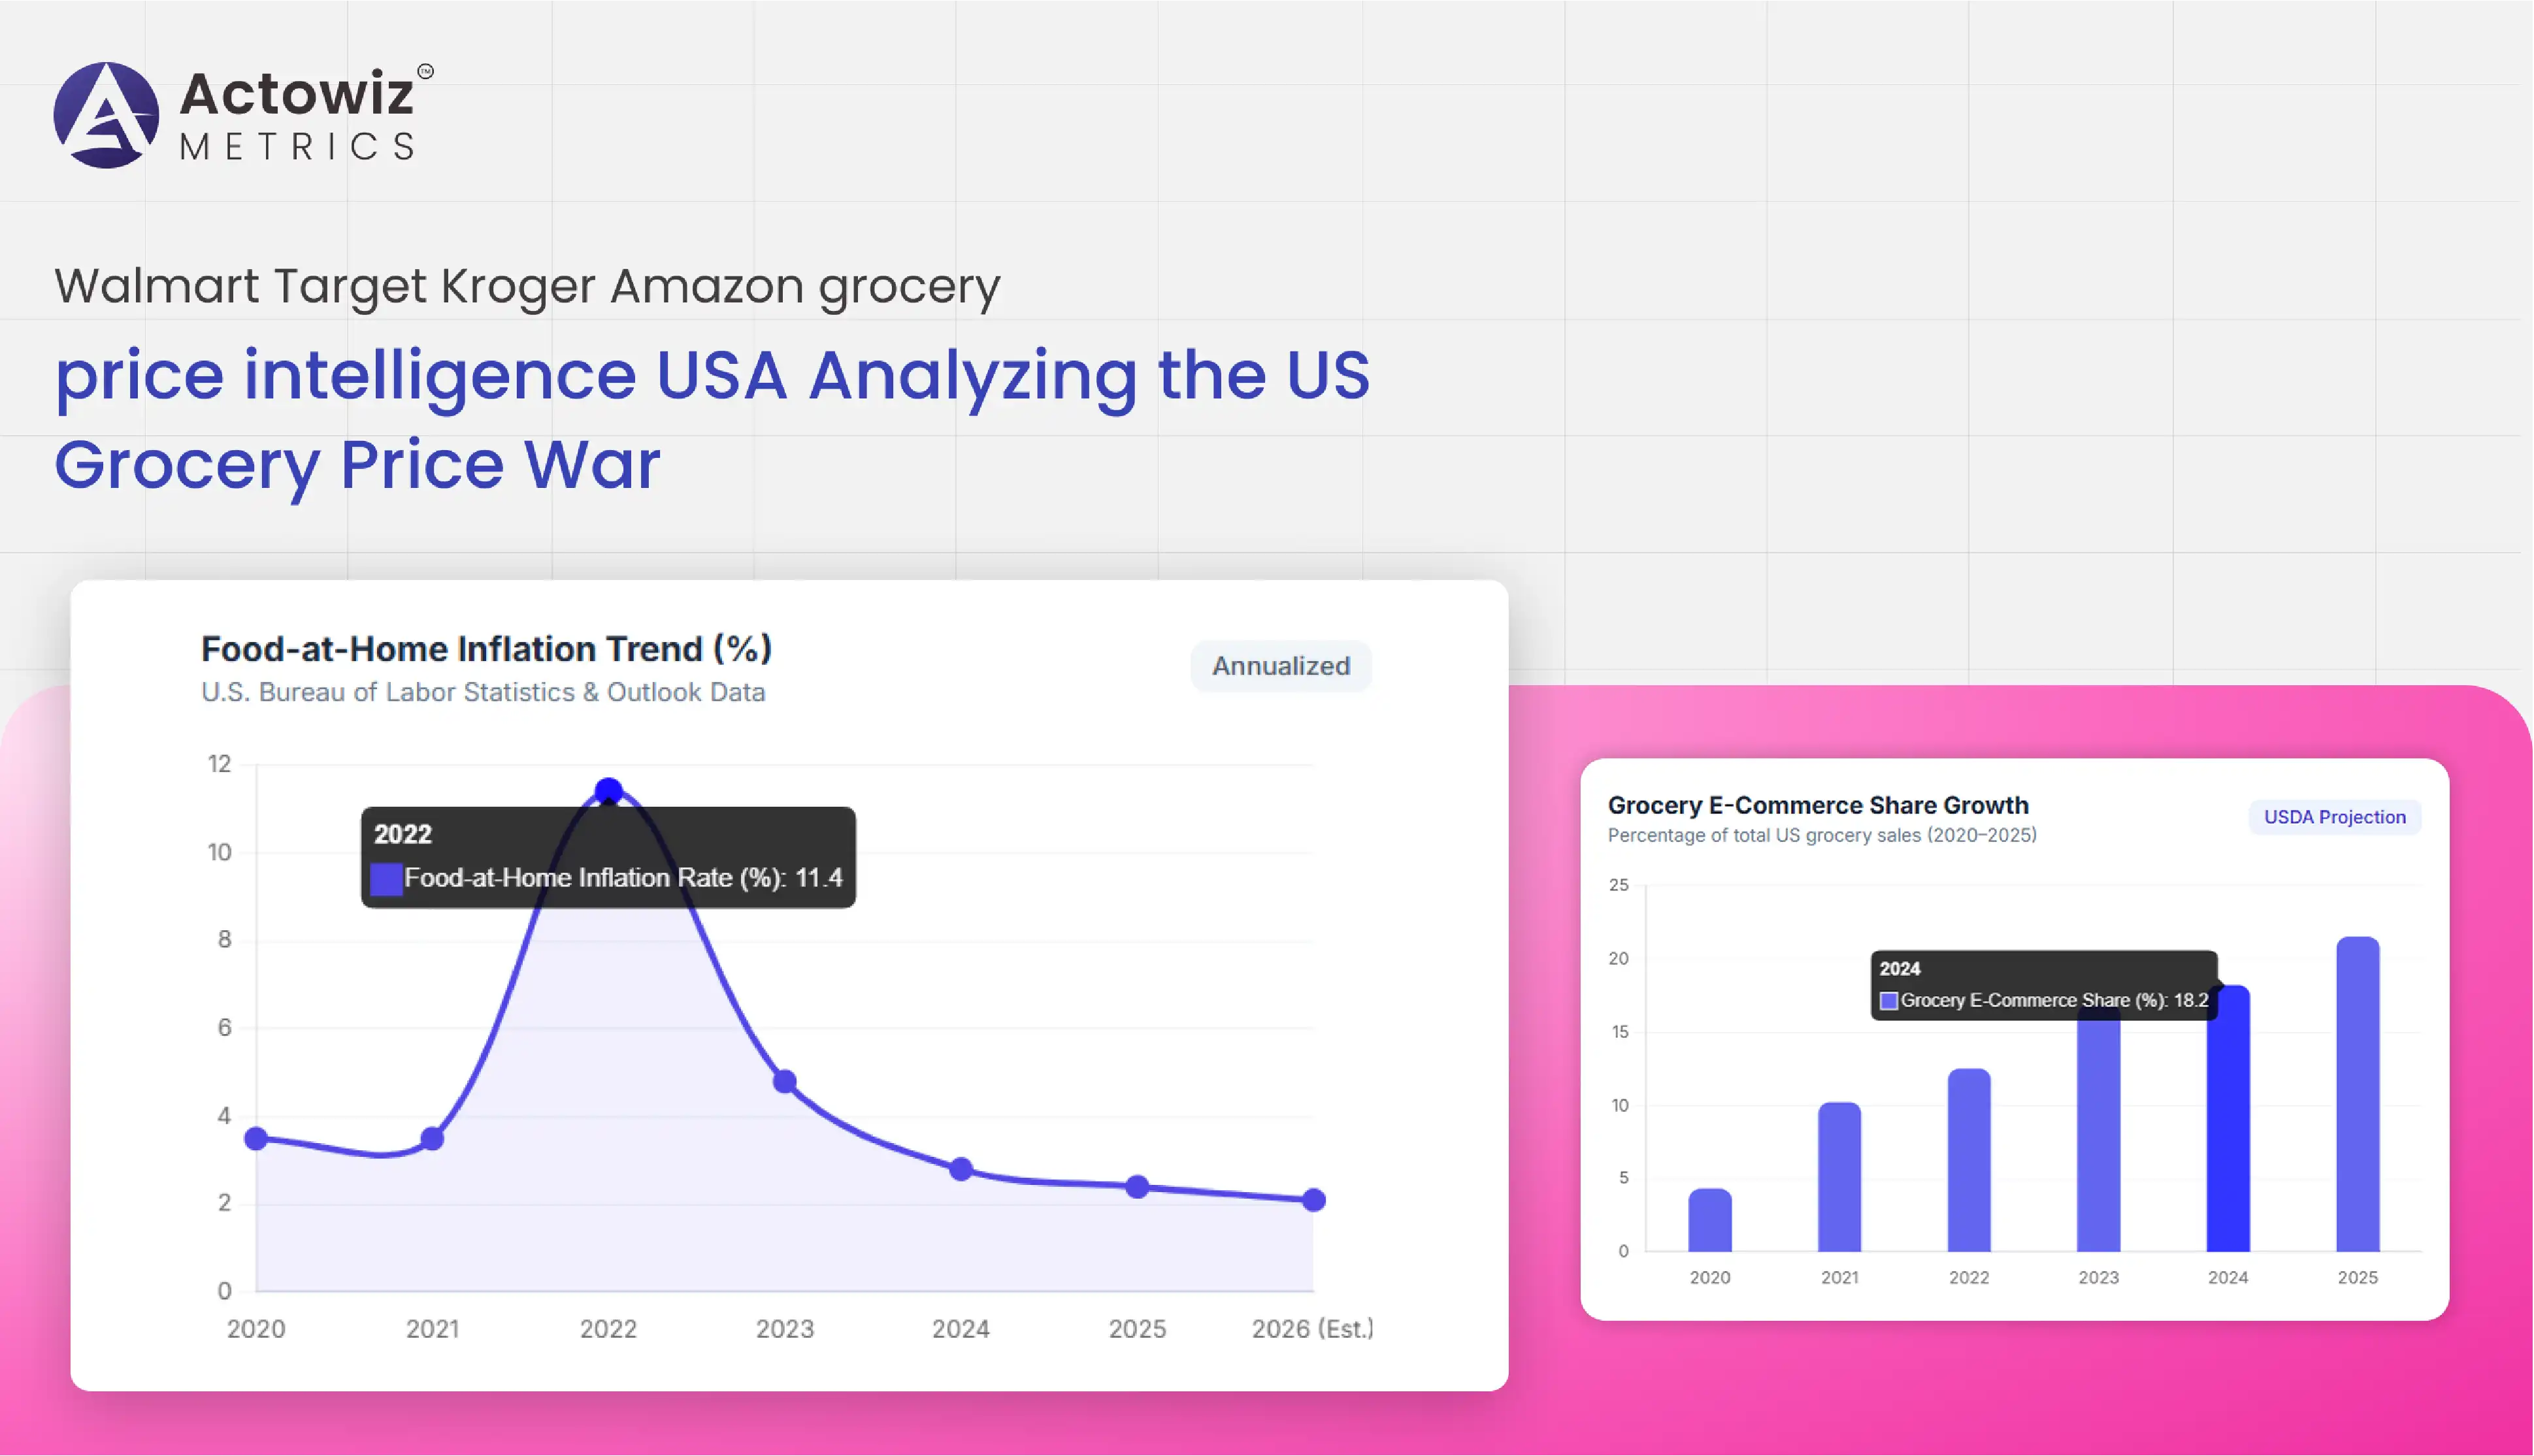
The broader pricing environment also changed significantly during the period. According to the U.S. Bureau of Labor Statistics, food-at-home prices increased 11.4% in 2022, following increases of 3.5% in both 2020 and 2021. By 2025, food-at-home prices increased another 2.4% year over year.
This report examines how structured retail data can help brands understand price movements, availability, product assortment, and digital shelf competition across the U.S. grocery landscape from 2020 through 2026.
Price competition became more visible as grocery inflation accelerated after 2020. US grocery competitor price monitoring allows brands to compare identical or closely matched products across retailers, identify price gaps, and evaluate how frequently prices change. For example, a Coca-Cola multipack, Kellogg's cereal box, Kraft Heinz product, or General Mills SKU may have different prices across Walmart, Target, Kroger, and Amazon depending on promotions and fulfillment conditions.
Amazon analytics adds another layer because Amazon's marketplace can include multiple sellers, different fulfillment methods, subscription offers, coupons, and rapidly changing prices. This makes historical snapshots valuable for separating temporary promotional changes from longer-term pricing patterns.
From 2020 to 2026, the grocery pricing environment moved through several distinct phases. In 2020, pandemic-related disruption altered shopping patterns and increased online grocery adoption. In 2021, food-at-home inflation remained comparatively moderate, while 2022 brought an 11.4% increase in food-at-home prices. Inflation moderated afterward, but price visibility remained important because individual categories continued to experience different levels of movement.
By 2025, food-at-home prices were still 2.4% higher than a year earlier, demonstrating that grocery pricing remained an active competitive variable even after the sharp inflationary period of 2022.
| Year | Food-at-home inflation trend | Competitive implication |
|---|---|---|
| 2020 | 3.5% | Rapid behavioral and channel changes |
| 2021 | 3.5% | Increasing digital grocery adoption |
| 2022 | 11.4% | Major price volatility |
| 2023 | Moderating | Greater focus on price comparison |
| 2024 | Continued movement | Promotion and assortment monitoring |
| 2025 | 2.4% | Persistent price sensitivity |
| 2026 | Ongoing monitoring | Need for frequent digital observations |
The data shows why historical price tracking is more useful than relying on occasional manual checks.
Modern grocery intelligence depends on collecting product-level information consistently across multiple retail websites. Grocery product data scraping for Walmart Target Kroger and Amazon can capture fields such as product name, brand, category, pack size, regular price, promotional price, discount, availability, seller, product URL, ratings, and other publicly visible attributes.
This structure is particularly useful when comparing products that appear similar but have different package sizes. A 12-pack beverage, 18-ounce cereal box, or family-size snack product cannot always be compared using the displayed price alone. Normalizing prices by unit, weight, volume, or count can create more meaningful benchmarks.
The 2020-2026 period also demonstrates why historical data matters. In 2020, pandemic disruptions changed how consumers searched for and purchased grocery products. By 2021, online grocery adoption had expanded significantly. USDA projections presented in a 2025 webinar showed grocery e-commerce reaching 10.2% of total grocery sales in 2021 and 16.9% in 2023, with a projection of 21.5% for 2025.
| Data point | Example intelligence generated |
|---|---|
| Product name | SKU identification |
| Brand | Brand-level comparison |
| Pack size | Unit normalization |
| Regular price | Baseline pricing |
| Sale price | Promotional comparison |
| Discount | Promotion intensity |
| Availability | Stock visibility |
| Seller | Marketplace competition |
| Rating/ reviews | Consumer response signals |
| Timestamp | Historical tracking |
This data architecture allows grocery brands to move from isolated price checks to repeatable competitive intelligence. It can also support dashboards that show which products experienced the largest price movements and where promotional activity was concentrated.
The grocery market includes thousands of SKUs across beverages, packaged foods, snacks, dairy, frozen products, personal care, household products, and other consumer categories. Walmart Target Kroger Amazon market intelligence for grocery brands can organize these observations into a broader view of how products perform across competing digital channels.
For brands such as PepsiCo, Coca-Cola, Nestlé, Kellogg's, General Mills, Unilever, Kraft Heinz, Mondelez, and Campbell's, cross-retailer comparisons can help identify pricing inconsistencies and promotional patterns. A brand may maintain a particular list price while individual retailers apply different promotions, coupons, or discounts.
The 2020-2026 period created several important comparison points. The 2022 food-at-home inflation increase of 11.4% created a significant pricing environment for grocery products. In 2024, BLS consumer expenditure data showed food-at-home spending increased 2.8%, while spending on meat, poultry, fish, and eggs increased 21.5%.
| Intelligence area | Brand-level use |
|---|---|
| Price gap | Compare retailer positioning |
| Promotion frequency | Measure promotional activity |
| Pack-size variation | Normalize competitive prices |
| Assortment | Identify retailer coverage |
| Seller presence | Identify marketplace competition |
| Availability | Detect potential sales barriers |
| Reviews | Monitor consumer response |
| Historical price | Identify recurring patterns |
For grocery brands, the value is not simply knowing that one retailer is cheaper. The deeper value comes from understanding when prices change, which SKUs are affected, how competitors respond, and whether pricing changes coincide with availability or promotional shifts.
This creates a more comprehensive market picture than manually checking a small number of products.
Price is only one component of grocery competitiveness. A product that is competitively priced but unavailable may not provide the same commercial opportunity as an in-stock alternative. Walmart Target Kroger Amazon grocery product availability monitoring helps brands track whether products are available, out of stock, temporarily unavailable, or presented through alternative sellers or fulfillment options.
Availability monitoring became particularly important after the supply-chain disruptions of 2020. Grocery retailers faced changes in consumer demand, product availability, delivery capacity, and purchasing patterns. These changes made historical availability data useful for identifying recurring gaps.
From 2020 through 2022, consumers also changed their shopping frequency and purchasing behavior. USDA research found that some consumers purchased groceries online because of time constraints, while pickup and delivery were both important fulfillment options.
By 2023-2026, digital grocery became a more established part of retail strategy. The USDA's projected e-commerce share for grocery sales reached 21.5% for 2025 in the cited market outlook, highlighting the growing importance of digital product visibility.
| Availability signal | Business interpretation |
|---|---|
| In stock | Product currently available |
| Out of stock | Potential lost visibility |
| Limited availability | Possible supply constraint |
| Seller substitution | Marketplace opportunity |
| Delivery unavailable | Fulfillment limitation |
| Store-specific availability | Geographic variation |
| Product removed | Assortment change |
For FMCG brands, monitoring availability alongside price creates a more complete view of digital shelf performance. It also allows teams to distinguish a price-related competitive change from a situation where the product simply became unavailable.
Digital shelf visibility has become a core component of modern grocery analytics because shoppers increasingly research products online before purchasing. Grocery retailer digital shelf analytics USA brings together pricing, availability, assortment, promotions, product content, ratings, reviews, and competitive positioning into a single analytical framework.
The 2020-2026 period provides a clear reason for this shift. In 2020, online grocery adoption accelerated sharply as consumers adapted to pandemic conditions. USDA data shows grocery e-commerce represented 4.3% of total grocery sales in 2020 in the cited market outlook, compared with a projected 21.5% in 2025.
| Year | Grocery e-commerce share* |
|---|---|
| 2020 | 4.3% |
| 2021 | 10.2% |
| 2022 | 12%+ trend range |
| 2023 | 16.9% |
| 2024 | 18%+ trend range |
| 2025 | 21.5% projected |
| 2026 | Continued digital expansion |
*Figures shown from the USDA-cited market outlook where available; intermediate figures should be treated as directional rather than equivalent official annual estimates.
By 2024, USDA research also found that about one in five people who regularly shopped for groceries had purchased groceries online during the previous month in the underlying 2022 survey.
For brands, digital shelf analytics can therefore connect product visibility with pricing and availability. A dashboard could compare Coca-Cola beverages across Walmart, Target, Kroger, and Amazon, or monitor cereal brands such as Kellogg's and General Mills by pack size, price, promotion, and availability.
This enables recurring analysis rather than isolated snapshots.
Retailer-level analytics becomes particularly valuable when a brand needs to understand how its products are positioned within one specific channel. Walmart analytics can provide a focused view of product pricing, assortment, availability, promotions, seller activity, and category positioning on one of the largest U.S. retail platforms.
From 2020 to 2026, retailer data became increasingly important because grocery competition expanded beyond physical shelf placement. Digital search results, online assortment, sponsored placements, product descriptions, reviews, and fulfillment availability can all influence how shoppers encounter products.
For example, a grocery brand could monitor products such as Oreo cookies, Coca-Cola beverages, Pepsi products, Heinz ketchup, Campbell's soup, Tide detergent, or General Mills cereal. Tracking these products over time can reveal changes in price, pack size, availability, and promotional positioning.
| Potential use | Measurement |
|---|---|
| Assortment | SKU count |
| Price | Competitive benchmarking |
| Discount | Promotion analysis |
| Availability | Supply visibility |
| Product ranking | Digital visibility |
| Reviews | Consumer feedback |
| Seller count | Marketplace competition |
| Pack size | Price normalization |
BLS data demonstrates why category-level monitoring remains important. In 2024, consumer spending on meat, poultry, fish, and eggs increased 21.5%, while spending on fruits and vegetables and cereals and bakery products declined.
By 2026, retailers and brands therefore have a larger volume of digital signals to evaluate. Combining retailer-specific observations with historical datasets can help organizations distinguish temporary changes from sustained market movements.
Actowiz Metrics can support grocery brands and retailers with structured, scalable data collection designed around product, pricing, availability, assortment, and competitive intelligence requirements. Target analytics can be incorporated into cross-retailer monitoring to evaluate Target's assortment, prices, promotions, and product visibility alongside other major grocery channels.
The broader objective is to create a consistent data layer that can be used for dashboards, benchmarking, alerts, historical analysis, and category intelligence. Instead of collecting isolated observations, businesses can build recurring datasets that preserve timestamps and product-level attributes.
Walmart Target Kroger Amazon grocery price intelligence USA can help organizations establish a unified framework for monitoring multiple grocery channels. Data can be normalized by SKU, brand, category, pack size, retailer, location, and date to make comparisons more meaningful.
Actowiz Metrics can also help businesses structure data for recurring collection, validation, deduplication, and analytics workflows. This approach can be applied to categories including beverages, packaged foods, snacks, dairy, frozen foods, personal care, household essentials, and other FMCG products.
The resulting datasets can support:
A structured approach is especially useful when grocery teams need to compare thousands of products rather than relying on manual checks of a limited number of SKUs.
The U.S. grocery market has moved through significant changes between 2020 and 2026. Inflation, online grocery adoption, changing shopping behavior, retailer promotions, and expanding digital assortments have increased the importance of timely product-level intelligence.
Walmart Target Kroger Amazon grocery price intelligence USA provides a foundation for comparing prices, promotions, availability, sellers, and assortment across major grocery channels. Meanwhile, Grocery and FMCG (CPG) digital shelf analytics helps brands connect these observations with broader digital visibility and competitive performance.
For businesses focused on pricing strategy, US grocery competitor price monitoring can reveal differences between retailers and identify recurring promotional patterns. Grocery product data scraping for Walmart Target Kroger and Amazon can create the structured product-level datasets needed for these comparisons. At a broader strategic level, Walmart Target Kroger Amazon market intelligence for grocery brands can turn retailer observations into category and brand-level insights.
As grocery competition continues to evolve, consistent historical data can help organizations understand not only where prices stand today, but also how they have changed over time.
Build a scalable grocery intelligence strategy with Actowiz Metrics and transform Walmart, Target, Kroger, and Amazon retail data into actionable pricing, assortment, availability, and digital shelf insights!
Expert blogs, research reports and infographics — practical, data-driven reading across e-commerce and quick-commerce.
Most fields are optional — the more you share, the better your sample.
.webp "infographics")
.webp "infographics")