BLOG




















Retail media network advertising performance tracking helps brands understand where advertising budgets are producing visibility, engagement, conversions, and measurable retail outcomes before they increase spend. The core issue is not simply whether an RMN campaign generates sales; brands need comparable evidence across retailers, placements, products, audiences, and time periods to determine where additional investment is justified.
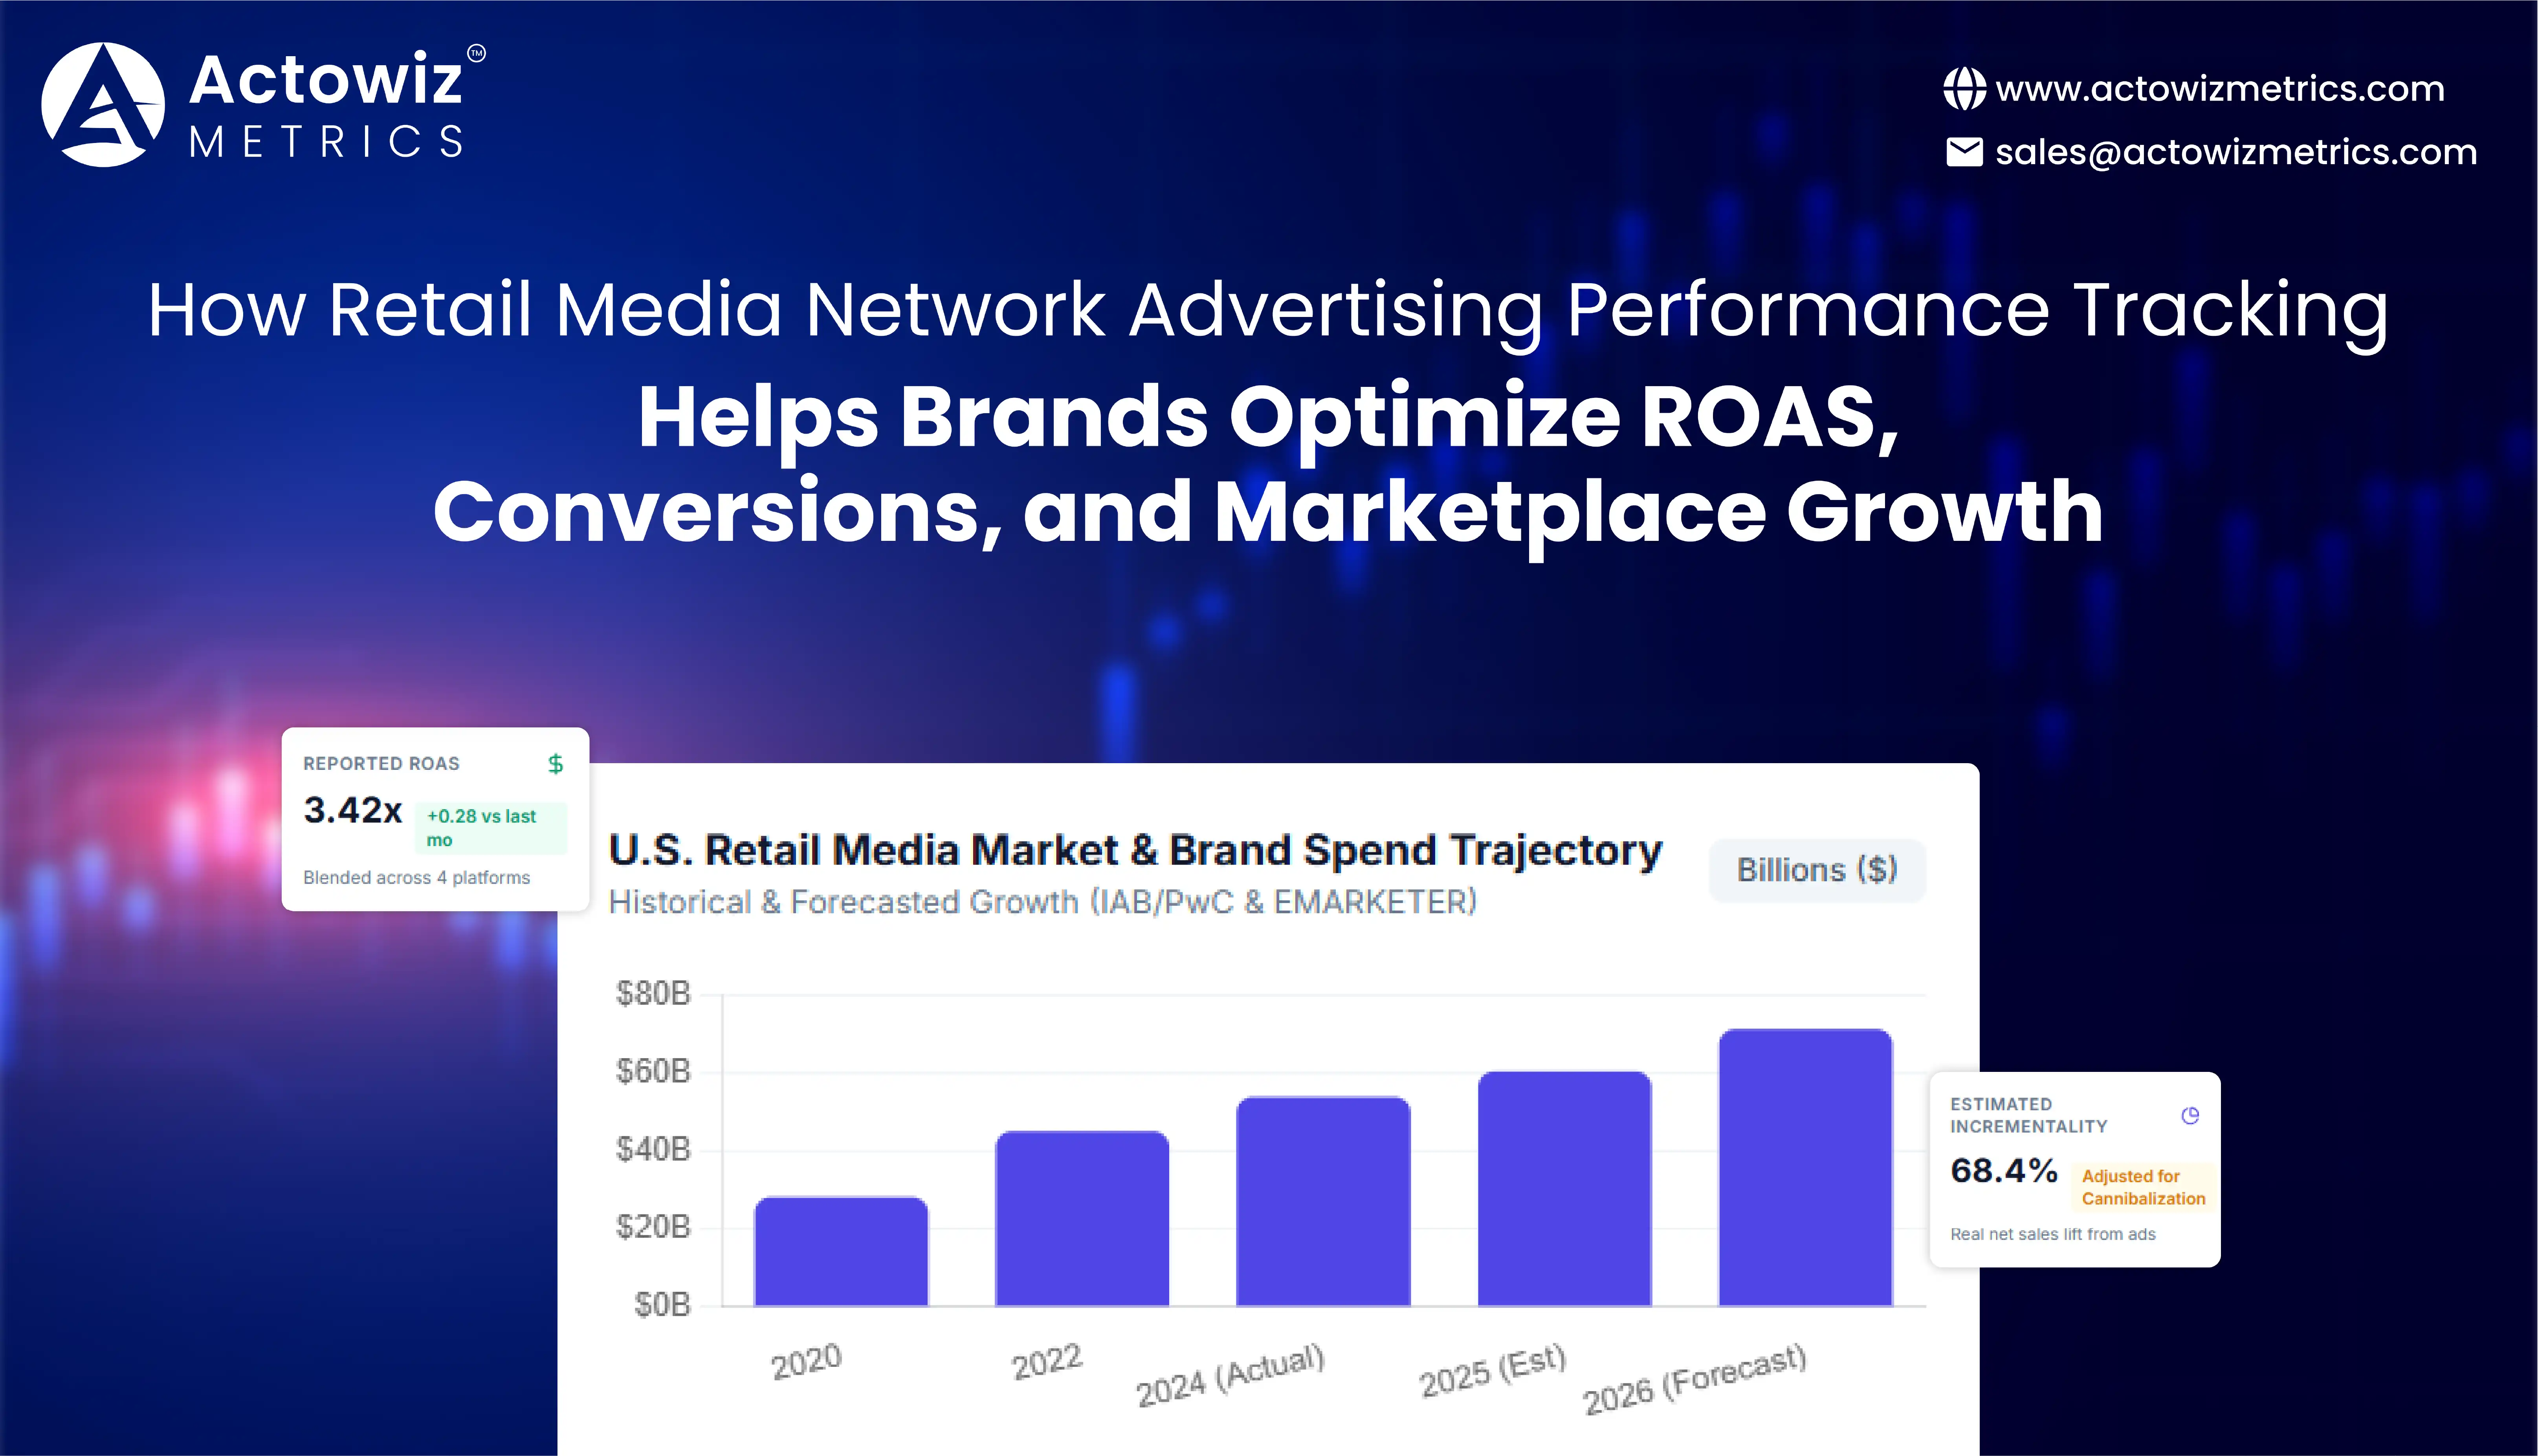
The opportunity is substantial. U.S. retail media advertising reached $53.7 billion in 2024, representing 23% year-over-year growth and 20.8% of total U.S. digital advertising revenue, according to IAB/PwC. EMARKETER forecasts U.S. retail media spending at $71.09 billion in 2026, up from $60.32 billion in 2025.
At the same time, scale creates a measurement problem. Brands increasingly operate across multiple retailer platforms, each with different reporting structures, attribution windows, audience definitions, fees, and campaign formats. Retail media intelligence can provide the additional competitive and market context needed to interpret campaign results instead of treating platform-reported ROAS as the entire answer.
For brand managers, trade marketers, media buyers, and e-commerce leaders, the practical objective is straightforward: understand performance before committing incremental budget, identify inefficient placements, compare competitors, and connect advertising activity with retail visibility and sales signals.
Retail media network competitive intelligence for brands gives advertisers a broader view of the environment in which their campaigns operate. A campaign can generate acceptable ROAS while still losing search visibility, promotional presence, sponsored placement, or category exposure to competitors.
That is why performance analysis should begin with a competitive baseline rather than campaign metrics alone.
Brands can monitor:
The goal is not to reproduce a retailer's proprietary advertising report. It is to combine accessible market signals with the brand's own campaign data.
| Indicator | Reported figure | Implication |
|---|---|---|
| U.S. retail media ad revenue, 2024 | $53.7B | RMNs represent a major advertising channel |
| 2024 YoY growth | 23.0% | Investment is expanding rapidly |
| Share of U.S. digital ad revenue | 20.8% | RMNs have become a significant digital channel |
| U.S. retail media spend forecast, 2026 | $71.09B | Budget scrutiny becomes more important as spend scales |
| 2026 YoY growth forecast | 17.8% | RMN investment is still expected to grow faster than many major channels |
Sources: IAB/PwC and EMARKETER.
These numbers create an important planning question: if the market is expanding quickly, how can an individual brand know whether its own incremental spending is generating incremental value? Competitive intelligence helps answer the contextual part of that question.
For example, a brand may see falling ROAS because a competitor has increased sponsored-search activity. Another campaign may show stable ROAS while losing visibility because competing products are taking more premium placements.
A useful baseline combines media + retail + competitive signals:
This gives a brand a more complete view of whether poor performance originates from creative execution, media costs, product availability, competitive pressure, or changing shopper behaviour.
Retail media network competitor analysis for brands helps answer a question that platform dashboards often cannot: Did our campaign performance change because our strategy changed, or because the competitive environment changed?
Consider a simple example.
A brand's CPC increases 18%. On its own, that could look like a campaign-efficiency problem. But if several competing brands simultaneously increase sponsored search activity, the explanation may be increased auction pressure.
Similarly, a decline in conversions may not necessarily indicate weaker advertising. If the advertised SKU is temporarily unavailable, the campaign can continue generating clicks while sales opportunities disappear.
| Signal | Why it matters |
|---|---|
| Competitor sponsored visibility | Indicates advertising pressure |
| Product-level advertising | Shows which SKUs receive media support |
| Price | Helps explain conversion differences |
| Promotions | Provides context for competitor sales performance |
| Availability | Identifies lost conversion opportunities |
| Search position | Shows discoverability |
| Ratings/reviews | Provides product-level context |
| Assortment changes | Identifies new competitive products |
| Campaign timing | Helps explain seasonal performance |
EMARKETER reported in 2025 that retail media search spending was approaching $40 billion, while its forecasts indicated almost $5 billion of incremental retail-media search spending would flow into the channel in 2026.
That matters because search is particularly sensitive to competitive pressure. If more brands compete for high-intent retail search placements, brands need to understand not only what they spend but what the competitive landscape looks like at the same time.
A practical decision framework is:
The last point is especially important. A campaign can receive credit for a purchase that might have occurred without the advertisement. ROAS therefore remains useful but should not automatically be treated as proof of incremental sales.
Criteo's analysis of more than 44,000 retail media campaigns argues for looking beyond ROAS and considering incremental impact and other business outcomes.
Retail media network data analytics for brands can connect campaign observations with product, retailer, competitor, and market data. This is important because media performance and retail performance do not always move together.
A campaign may increase impressions but fail to increase sales. Another campaign may produce moderate click volume but improve product visibility and sales. Without connecting multiple datasets, those differences can be difficult to interpret.
The broader objective of Retail media network advertising performance tracking is therefore to create a consistent analytical framework.
| Data layer | Key fields | Analytical use |
|---|---|---|
| Campaign | Campaign ID, date, spend | Investment tracking |
| Placement | Search, display, off-site, onsite | Format comparison |
| Product | SKU, brand, category | Product-level analysis |
| Advertising | Impressions, clicks, CTR | Engagement |
| Cost | Spend, CPC, CPM | Efficiency |
| Conversion | Orders, units, attributed sales | Outcome |
| Retail | Price, availability, promotion | Commercial context |
| Competition | Visibility, advertised products | Market comparison |
| Time | Hour/day/week/month | Trend analysis |
Retailers do not necessarily expose metrics in identical formats. One platform may emphasize ROAS, another sales attribution, another clicks and impressions, while another may offer different attribution windows.
A centralized data model can normalize:
This allows brands to compare campaigns without treating every platform's reporting definition as equivalent.
IAB's 2025 outlook projected retail media growth of 15.6%, more than twice the projected 7.3% growth of overall U.S. advertising. However, IAB also identified ecosystem fragmentation, lack of standardization, and rising costs as challenges that could affect continued growth.
This is precisely where data engineering becomes commercially important. A brand does not necessarily need more dashboards. It needs a measurement layer that makes different datasets comparable.
Recommended analytical structure — a useful reporting hierarchy is:
This structure gives both executives and media teams the information they need without forcing every stakeholder to interpret raw campaign data.
Retail media network ROI analytics for brands should move beyond a single ROAS figure.
ROAS is calculated as:
ROAS = Attributed Revenue ÷ Advertising Spend
For example, if a campaign spends $50,000 and records $150,000 in attributed sales, its reported ROAS is 3.0x.
That calculation is useful, but it does not answer whether all $150,000 would have disappeared without the advertising.
| Metric | What it answers |
|---|---|
| ROAS | How much attributed revenue was generated per advertising dollar? |
| Incremental sales | What additional sales can reasonably be associated with advertising? |
| Cost per acquisition | What did it cost to acquire a customer? |
| New-customer rate | How much activity reached new shoppers? |
| Conversion rate | How efficiently did traffic convert? |
| CPC | How expensive was traffic? |
| CPM | How expensive was reach? |
| Average order value | What value did converted shoppers generate? |
| Repeat purchase | Did advertising contribute to longer-term customer value? |
| Organic lift | Did paid activity coincide with additional unpaid sales or visibility? |
Criteo's research specifically argues that brands should consider incrementality and other outcomes beyond ROAS when evaluating retail media investments.
Why does incrementality matter? Imagine two campaigns:
Campaign A
Campaign B
A dashboard that only ranks campaigns by ROAS could obscure the strategic difference.
This does not mean Campaign B should automatically receive more budget. Instead, the brand should investigate incremental contribution, profitability, customer quality, and strategic objectives before reallocating funds.
ROI analysis should combine:
Media efficiency + incremental sales + product economics + customer value + competitive context
A campaign with strong advertising metrics but weak gross margin may not justify additional investment. Conversely, a campaign with moderate immediate ROAS may have a strategic role if it expands new-customer acquisition or supports an important product launch.
The analytical lesson is simple: measurement should reflect the business objective, not just the metric most readily available in an advertising dashboard.
Retail media network budget planning for brands should begin with historical performance, competitive pressure, product readiness, seasonality, and retailer-specific opportunities.
One common mistake is allocating next quarter's budget by simply increasing last quarter's spend. That assumes the competitive environment, media costs, product availability, and consumer demand will remain similar.
They rarely do.
| Planning factor | Budget implication |
|---|---|
| Historical incremental performance | Establishes evidence of additional demand |
| Product margin | Determines economic viability |
| Competitor advertising pressure | Indicates potential auction intensity |
| Product availability | Prevents spending against unavailable products |
| Promotional calendar | Identifies periods of higher commercial relevance |
| Seasonal demand | Helps align spend with shopper intent |
| Retailer audience scale | Helps assess potential reach |
| Search opportunity | Identifies high-intent placements |
| New product launches | Creates incremental media requirements |
| Measurement quality | Determines confidence in optimization |
EMARKETER's January 2026 analysis reported that 62% of CPG marketers expected to increase retail media spending in the second half of 2025, based on Mediaocean's 2025 H2 Market Report.
As more brands increase budgets, competitive pressure can also change. A historical CPC or ROAS figure should therefore be treated as a reference point, not a guaranteed future outcome.
Step 1: Establish the baseline — Measure historical spend, attributed sales, conversion, CPC, CTR and product-level outcomes.
Step 2: Add retail context — Check product availability, price, promotions, assortment and retailer placement.
Step 3: Add competitive context — Measure competitor advertising visibility and promotional intensity where observable.
Step 4: Identify opportunities — Prioritize categories and SKUs where demand, margin, availability and media opportunity align.
Step 5: Create test budgets — Use controlled incremental allocations rather than committing the full increase immediately.
Step 6: Measure the result — Compare the test against a suitable baseline and examine incremental outcomes.
Step 7: Reallocate — Increase or decrease investment based on evidence rather than platform-level performance alone.
This approach makes budget allocation a continuous learning process.
Share of search can provide an additional visibility signal when brands want to understand how prominently they appear relative to competitors for relevant retail searches.
For retail media, search is particularly important because consumers are often already expressing product or category intent.
EMARKETER forecast retail media search spending at $33.86 billion in the U.S. for 2024 and projected search to account for around $6 of every $10 spent on retail media through 2028.
That makes search visibility a useful strategic signal, although it should not be confused with market share or sales share.
| Indicator | Interpretation |
|---|---|
| Brand search visibility | How often the brand appears for tracked searches |
| Sponsored visibility | Presence in paid placements |
| Organic visibility | Presence in non-paid results |
| Competitor visibility | Relative presence of competing brands |
| Category visibility | Brand presence across relevant searches |
| Product-level visibility | SKU presence for specific queries |
| Visibility trend | Change over time |
Consider a brand whose advertising spend increases by 20%, while its sponsored search visibility barely changes.
That could indicate stronger competition, increased auction costs, limited inventory, or inefficient targeting.
Now consider a brand whose spend rises 20%, visibility rises significantly, but attributed sales remain flat.
That suggests the team should investigate conversion, product pricing, availability, product detail pages, and audience quality before assuming that more advertising will solve the problem.
The most useful analytical framework is therefore:
Spend → Visibility → Engagement → Conversion → Sales → Incrementality
Each stage should be evaluated separately. This prevents brands from interpreting a single metric as proof of campaign success or failure.
From 2020 through 2026, retail media evolved from a rapidly emerging digital advertising segment into a major performance and commerce channel. In 2020, U.S. retail digital advertising was estimated at $28.23 billion, with the retail sector accounting for 21% of total U.S. digital ad spending; the pandemic accelerated e-commerce adoption and reshaped digital retail behaviour. By 2022, EMARKETER estimated U.S. digital retail media spending would reach $61.15 billion in 2024, nearly triple the 2020 level, illustrating the speed of the channel's expansion. In 2024, U.S. retail media spending was forecast to approach $55 billion, with advertisers increasingly shifting into off-site channels while measurement and standardization remained challenges. IAB/PwC subsequently reported $53.7 billion in U.S. retail media revenue for 2024, up 23% year over year. In 2025, IAB projected retail media spending to grow 15.6%, more than twice the overall advertising-growth forecast, while explicitly highlighting fragmentation and standardization challenges. For 2026, EMARKETER forecasts U.S. retail media spending of $71.09 billion, up 17.8%, with Amazon and Walmart expected to capture most incremental spending. The strategic shift is therefore clear: the industry has moved from proving that retail media can generate measurable outcomes toward determining which investments are genuinely incremental, which placements are competitive, and which budgets should be scaled.
Actowiz Metrics can help brands build data workflows that bring advertising, retailer, product, pricing, and competitor signals into a structured analytical environment.
The objective is to help marketing and commercial teams move from fragmented platform reports toward a broader intelligence workflow.
Competitor intelligence can be structured around observable market signals such as:
The resulting Retail media network advertising performance tracking framework can then combine these signals with the brand's own campaign metrics.
Data collection: Gather relevant product, pricing, visibility, and competitive signals from permitted sources.
Normalization: Standardize retailer names, SKUs, categories, dates, currencies, and product identifiers.
Historical storage: Maintain time-series records so teams can analyze changes rather than isolated observations.
Competitive benchmarking: Compare brand visibility and market activity against relevant competitors.
Performance analysis: Connect campaign activity with retail conditions.
Dashboard delivery: Make the resulting data accessible through BI dashboards, spreadsheets, APIs, databases, or other required formats.
Brand managers can monitor competitive visibility and product positioning.
Media teams can compare campaign performance with marketplace conditions.
E-commerce teams can connect advertising with price and availability.
Category managers can understand advertising activity alongside assortment and promotions.
Executives can receive summarized performance indicators for budget discussions.
The biggest analytical mistake is treating competitor data as a replacement for first-party campaign reporting.
Instead, the two should complement each other.
First-party campaign data tells the brand what happened inside its advertising account.
Competitive and retail intelligence helps explain the environment surrounding those results.
Together, they can answer more useful questions:
That is where a data-driven retail media strategy becomes more useful than simply increasing or decreasing spend based on one dashboard metric.
The rapid expansion of retail media makes performance measurement more important, not less. U.S. retail media revenue reached $53.7 billion in 2024, and EMARKETER forecasts $71.09 billion in U.S. spending for 2026.
For brands, the central challenge is no longer simply accessing retail media inventory. It is determining how advertising performance relates to competitive visibility, product availability, pricing, promotions, search presence, and incremental sales.
A robust Retail media network advertising performance tracking strategy should therefore combine campaign metrics with retailer and competitive intelligence.
Brands can use this approach to:
The most useful retail media measurement system is one that explains why performance changed, not merely what changed.
Actowiz Metrics can help businesses collect, structure, and analyze the market signals required to build a more comprehensive retail media intelligence workflow!
Expert blogs, research reports and infographics — practical, data-driven reading across e-commerce and quick-commerce.
Most fields are optional — the more you share, the better your sample.
.webp "infographics")
.webp "infographics")