BLOG


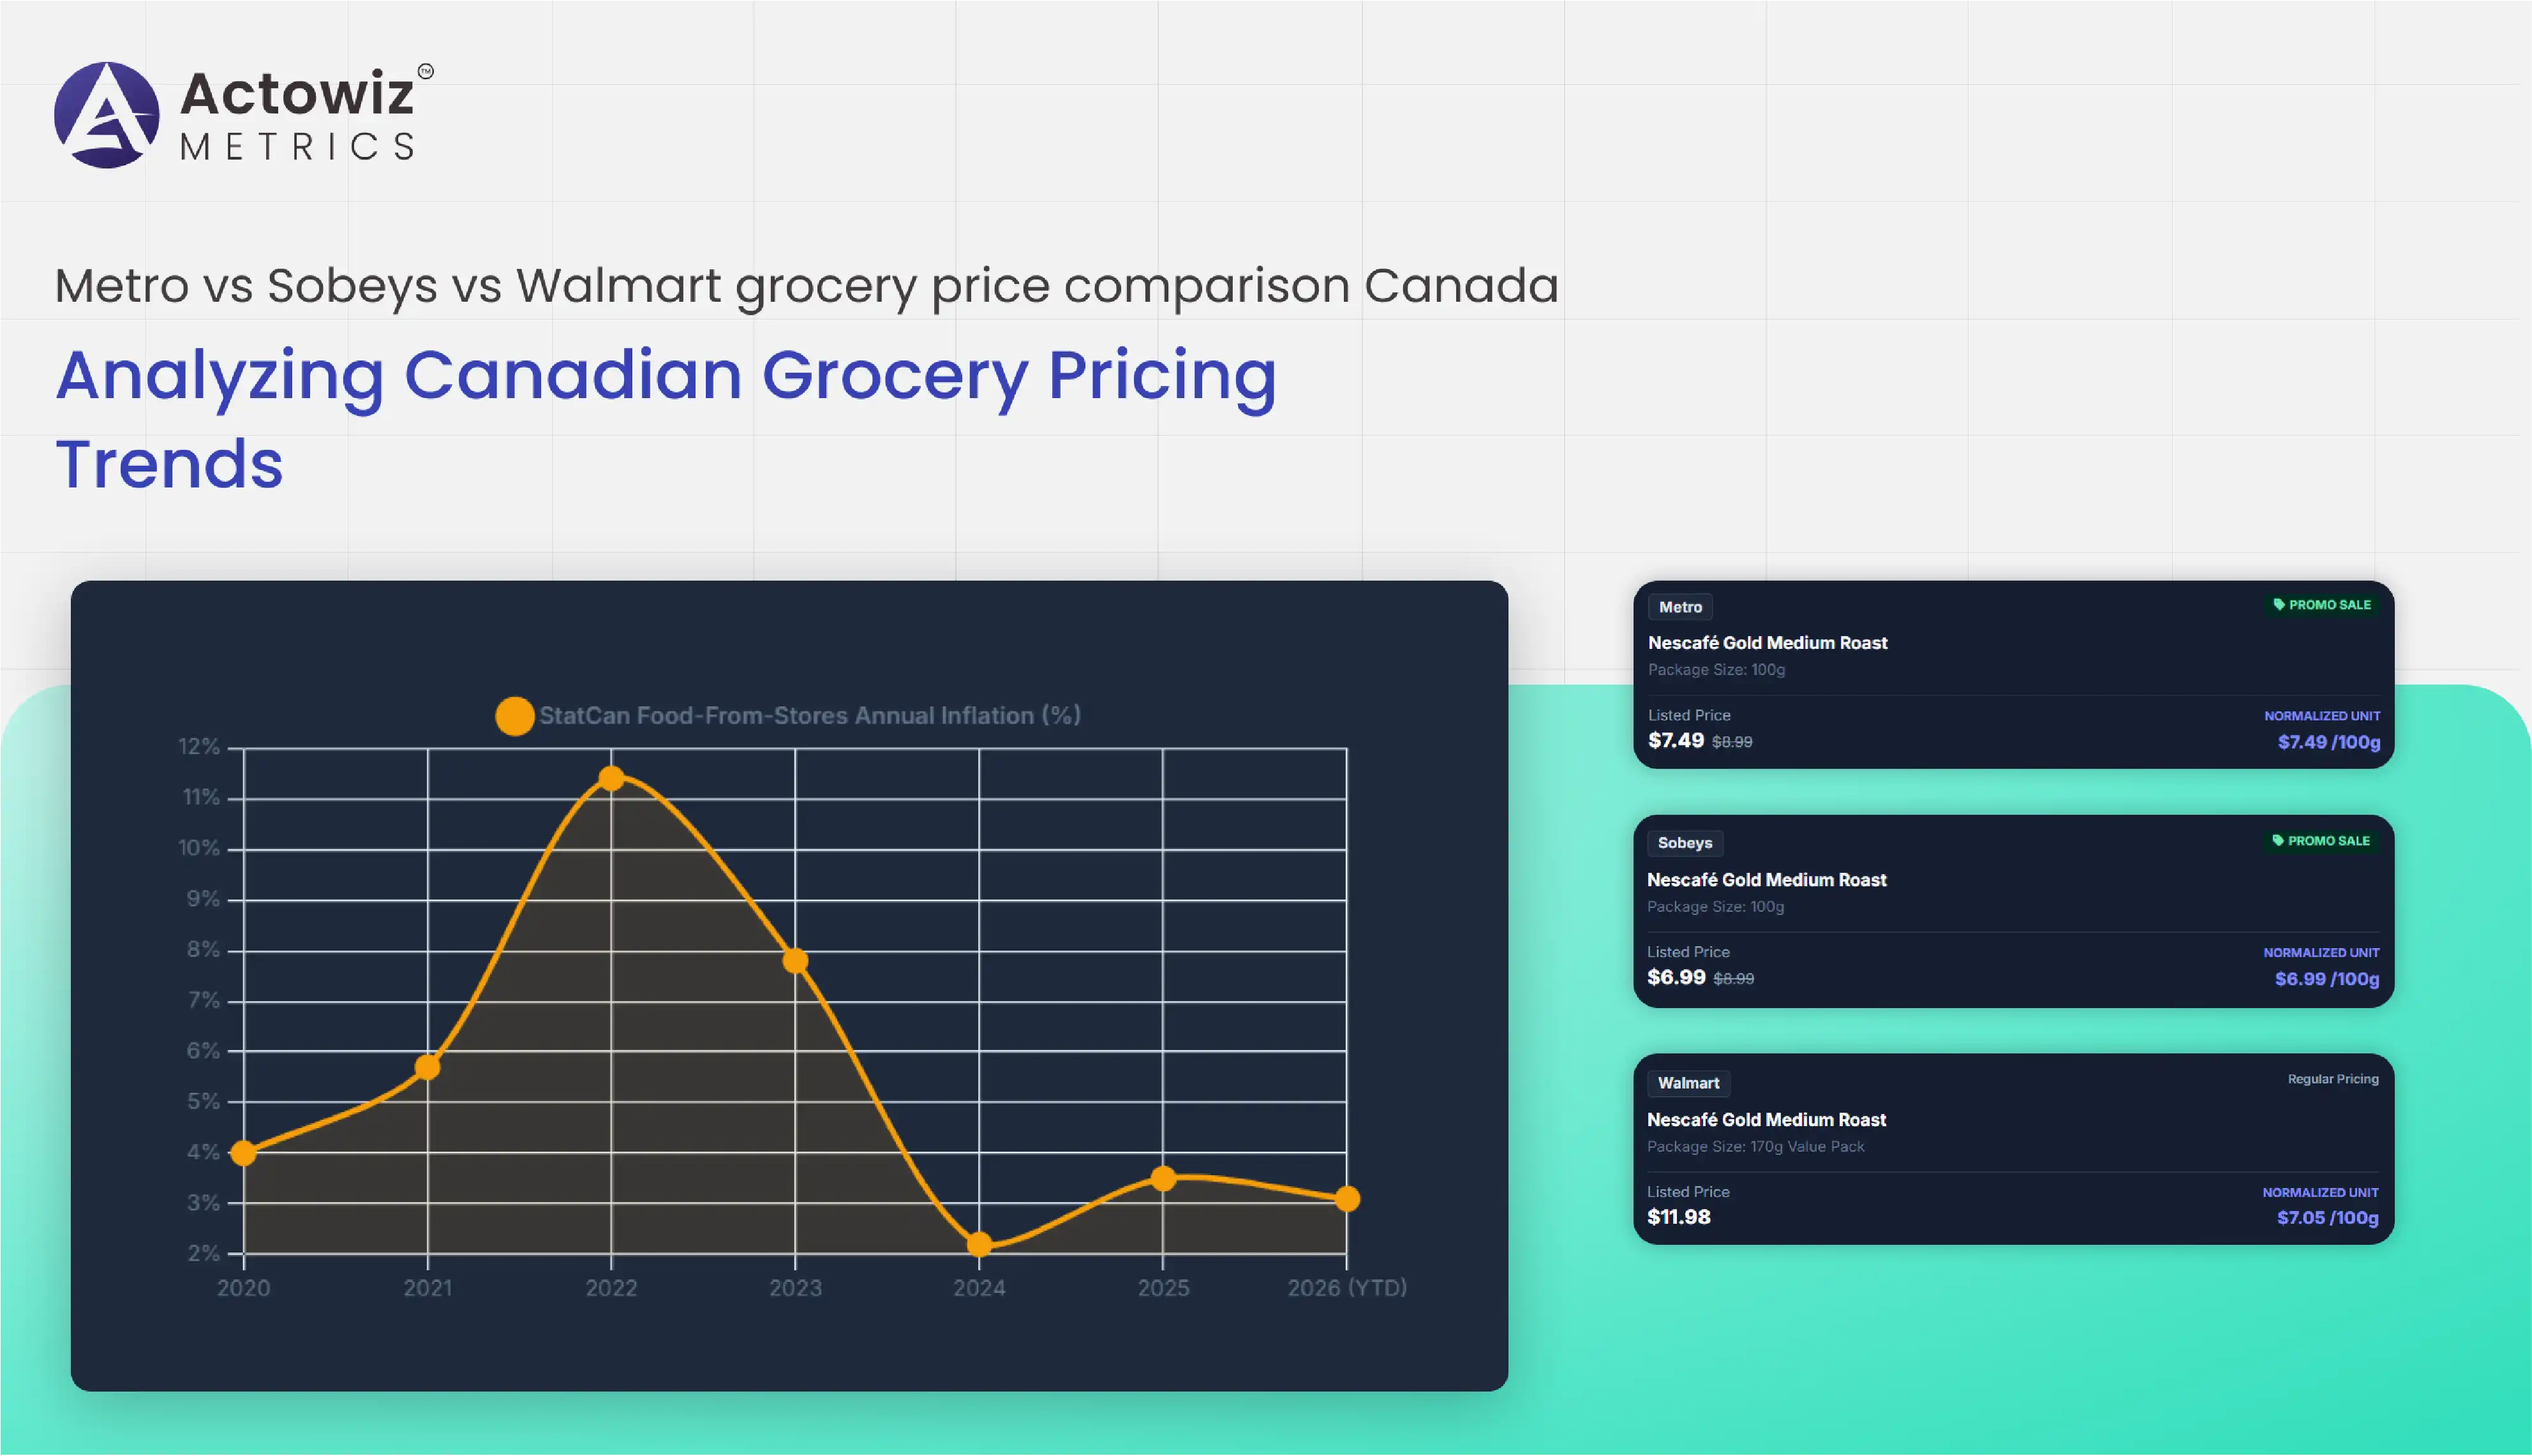
Canada's grocery market has experienced substantial price movement since 2020, creating a growing need for retailers, brands, suppliers, and analysts to understand product-level pricing, promotions, assortment, and availability. Statistics Canada reported that food purchased from stores increased 7.8% on an annual average basis in 2023, following a 9.8% increase in 2022. Growth moderated to 2.2% in 2024 before accelerating to 3.5% in 2025.
For businesses monitoring Canadian grocery competition, Metro vs Sobeys vs Walmart grocery price comparison Canada provides a framework for evaluating how the same or comparable products are positioned across different retail formats. Metro has a particularly strong presence in Ontario and Quebec, while Sobeys operates through a broad network of banners across Canada, and Walmart competes through its supercentre and general-merchandise retail model. The Competition Bureau identifies Metro, Sobeys, Walmart, Loblaw, and Costco among the major companies shaping Canada's grocery landscape.
At the same time, Price & promotion intelligence is becoming increasingly important because shoppers can compare weekly flyers, digital promotions, online listings, loyalty offers, and product prices before making purchasing decisions. In September 2026, the Competition Bureau also opened an information-gathering initiative concerning minimum advertised pricing policies in the grocery sector, specifically examining how such policies may affect advertised grocery deals.
This report examines how structured grocery data collection can help businesses monitor price changes, promotions, assortment, product availability, and competitive positioning from 2020 through 2026.
The Canadian grocery environment combines national, regional, discount, supermarket, and general-merchandise formats. This makes Canadian Supermarket Competitor Price Analysis difficult to evaluate using isolated store checks. A structured approach can instead compare equivalent products across retailers by SKU, brand, category, package size, unit price, promotion status, and collection date.
The Competition Bureau's 2023 grocery market study identified Loblaw, Sobeys, and Metro as Canada's largest traditional grocery groups, while Walmart and Costco were described as important additional competitors. The Bureau also noted that Metro's operations are concentrated in Ontario and Quebec, making geographic normalization particularly important when comparing retailers.
| Year | Canadian grocery pricing indicator | Key observation |
|---|---|---|
| 2020 | Food-from-stores inflation reached 4.0% in April 5.7% year-over-year in December | Pandemic disruption affected food purchasing and supply |
| 2021 | Grocery inflation accelerated toward year-end | — |
| 2022 | 11.4% year-over-year | One of the strongest periods of |
| 2023 | 7.8% annual average | Price growth remained elevated |
| 2024 | 2.2% annual average | Grocery inflation moderated |
| 2025 | 3.5% annual average | Grocery price growth accelerated again |
| 2026 | Food affordability remained a policy focus | Competition Bureau continued food-sector examination |
Sources: Statistics Canada and Competition Bureau.
From 2020 to 2026, the value of retailer-level price monitoring has therefore extended beyond simply finding the lowest listed price. A business can track regular price, promotional price, discount percentage, price per 100 grams or litre, promotional frequency, and price changes over time. For example, a cereal product such as Kellogg's Corn Flakes, a beverage such as Coca-Cola, dairy products, eggs, packaged snacks, or household staples can be mapped across multiple retailers to identify comparable pricing patterns.
Historical datasets also help distinguish temporary promotions from persistent price differences. If a product appears at a lower price at Walmart during one collection but returns to its previous level later, the observation can be classified as a promotion rather than a permanent price gap.
This approach creates a more consistent competitive benchmark for grocery brands and retailers while accounting for differences in geography, pack size, retailer format, and promotional timing.
Product-level tracking enables brands and retailers to observe how individual SKUs move through different pricing cycles. Instead of relying on a single price observation, businesses can build a historical record containing product name, brand, SKU or UPC where available, package size, regular price, promotional price, discount, stock status, product URL, retailer, location, and collection timestamp through Metro Sobeys Walmart product price tracking Canada.
Statistics Canada's data illustrates why this historical perspective matters. Food purchased from stores increased 9.8% in 2022 and 7.8% in 2023 on an annual average basis. By 2024, the increase had slowed to 2.2%, while 2025 recorded a 3.5% increase.
| Metric | 2022 | 2023 | 2024 | 2025 |
|---|---|---|---|---|
| Food purchased from stores, annual average change | 9.8% | 7.8% | 2.2% | 3.5% |
| Grocery pricing environment | Rapid increase | Elevated growth | Moderation | Growth reaccelerated |
| Monitoring requirement | High | High | High | High |
Source: Statistics Canada.
From 2020 through 2026, a price-monitoring dataset can help identify several important patterns. First, businesses can compare the frequency of promotions by retailer and category. Second, they can determine whether a price change is retailer-specific or reflects a wider market movement. Third, they can evaluate whether brands maintain consistent price positioning across locations.
Consider packaged coffee. A retailer may display a regular price for a 340-gram package while another offers a temporary discount on a larger pack. A direct comparison without normalization can produce misleading conclusions. Structured data can calculate unit-level pricing so that package-size differences are accounted for.
The same methodology can be applied to milk, eggs, bread, cereal, frozen food, snacks, beverages, personal-care products, and household essentials.
Promotion tracking can additionally capture flyer pricing, online sale badges, multibuy offers, percentage discounts, loyalty-related offers where publicly visible, and promotion start or end dates. Over time, these observations help businesses understand promotional depth and frequency.
For brands, this data can support MAP monitoring, retailer compliance analysis, channel pricing reviews, and promotional benchmarking. For retailers, it can support competitive pricing teams by providing a historical view rather than isolated snapshots.
Reliable competitive intelligence depends on the quality and consistency of the underlying data. Metro Sobeys Walmart grocery price data collection Canada helps organize grocery information across thousands of products spanning fresh food, packaged food, beverages, frozen products, household supplies, personal care, and other categories. Product information can also change frequently as retailers modify prices, promotions, descriptions, availability, and assortment.
Statistics Canada reported that food and beverage retailers generated $159.5 billion in operating revenue in 2024, an increase of 2.0% from 2023. Supermarkets and other grocery retailers also recorded a 2.0% sales increase in 2024.
| Data field | Example use |
|---|---|
| Product name | Product identification |
| Brand | Brand-level benchmarking |
| SKU / UPC | Product matching |
| Category | Category-level analysis |
| Package size | Unit-price normalization |
| Regular price | Baseline pricing |
| Sale price | Promotion analysis |
| Discount | Promotional-depth measurement |
| Availability | Stock monitoring |
| Retailer | Competitive comparison |
| Location | Regional analysis |
| Timestamp | Historical tracking |
A 2020-2026 data strategy should prioritize consistency across collection periods. Product matching is particularly important because the same item may appear with differences in capitalization, descriptions, pack-size formatting, or promotional messaging.
For example, a product such as Nestlé Nescafé coffee could appear under slightly different titles across retailers. A normalization process can map these records to a common product identifier while preserving retailer-specific attributes.
Data collection can also separate regular and promotional prices. This distinction allows analysts to calculate metrics such as average selling price, promotional frequency, discount depth, and price volatility.
Geography is another critical factor. Since Metro has a strong Ontario and Quebec footprint, comparisons should distinguish national availability from regional availability. Sobeys operates multiple banners, while Walmart has a broader general-merchandise footprint. The Competition Bureau specifically notes that competition can vary substantially across local Canadian markets.
Between 2020 and 2026, automated collection and validation can therefore transform fragmented online grocery observations into a consistent historical dataset. Businesses can use scheduled collection to identify changes daily, weekly, or at another appropriate frequency, depending on category volatility.
The resulting data foundation supports dashboards, alerts, competitor benchmarking, category analysis, pricing models, and historical reporting.
Retail data becomes more valuable when individual observations are transformed into Canadian Supermarket Retail Data Analytics and comparable business metrics. Instead of simply recording that a product costs a particular amount on a specific date, analytics can reveal price gaps, promotional intensity, assortment changes, availability patterns, and category-level movements.
Canada's retail environment has increasingly adopted digital channels. Statistics Canada reported $73.7 billion in retail e-commerce operating revenue in 2024, representing a 9.0% annual increase. Total retail operating revenue reached $865.2 billion.
| Indicator | 2023 | 2024 | 2025/2026 relevance |
|---|---|---|---|
| Food purchased from stores inflation | 7.8% | 2.2% | Price monitoring remains relevant |
| Food & beverage retailer revenue | $156.4B | $159.5 | Large retail data opportunity |
| Total retail e-commerce revenue | — | $73.7B | Digital shopping continues expanding |
| Retail e-commerce annual change | — | +9.0% | More online data signals |
Sources: Statistics Canada.
During 2020-2026, analytics can help businesses move from simple price collection toward broader retail intelligence. A dashboard can show the average price of a category by retailer, the percentage of tracked products on promotion, products experiencing price increases, out-of-stock rates, and assortment overlap.
For example, a grocery brand could examine whether its products are consistently represented across Metro, Sobeys, and Walmart. Analysts could then compare pricing for categories such as breakfast cereal, packaged beverages, snacks, sauces, dairy alternatives, frozen foods, and personal-care products.
Historical data also makes it possible to identify seasonal patterns. Holiday periods can generate different promotional behaviour than ordinary weeks, while summer categories may experience greater promotional activity during specific periods.
Retail analytics can further support competitor alerts. If a tracked SKU experiences a sudden price change, an automated system can flag it for review. Similar alerts can be configured for new products, discontinued products, stockouts, or significant changes in discount depth.
The 2026 environment makes this particularly relevant because the Competition Bureau continues to examine competition throughout Canada's food supply chain. Its 2026 work extends beyond retail stores into areas such as production, processing, logistics, and transportation.
For brands and retailers, combining historical pricing with product and availability data provides a broader view of market behaviour. It enables teams to investigate not only what changed, but also when it changed, where it changed, and which products were affected.
Canadian grocery brands operate within a market where retailer presence, geography, pricing, promotions, and assortment can differ significantly. Metro Sobeys Walmart market intelligence for Canadian grocery brands helps brands understand how their products are represented across retail channels and how competitor brands are positioned.
The Competition Bureau's 2023 study found that Canada's grocery industry is concentrated among several large operators. Its survey found that 28% of respondents typically shopped at Sobeys and its affiliated stores and 25% reported Walmart as a typical grocery destination, while the Bureau emphasized that shopping patterns vary by location.
| Market-intelligence metric | Business application |
|---|---|
| Retailer price index | Compare category price positioning |
| Promotion frequency | Evaluate promotional activity |
| Discount depth | Measure promotional intensity |
| Assortment share | Monitor product presence |
| Availability rate | Identify stock issues |
| New-product appearances | Track assortment expansion |
| Delisted products | Identify assortment reductions |
| Regional price variation | Compare geographic markets |
From 2020 to 2026, brands have faced an environment in which input costs, inflation, supply disruptions, changing consumer behaviour, and retailer strategies can all influence shelf prices. Statistics Canada reported that grocery inflation reached particularly high levels in 2022 and remained elevated in 2023 before moderating in 2024. In 2025, annual-average grocery prices increased 3.5%, with notable increases in coffee, confectionery, and meat.
For a packaged-food manufacturer, a historical dataset can reveal whether competitor products are receiving more promotional exposure, whether a brand's average price differs by retailer, and whether assortment availability changes by province.
Product-level monitoring can also support brand protection. If a product is listed at an unexpected price or under inconsistent product information, the brand team can investigate the retailer listing.
Market intelligence can be organized by category and brand. For example, a beverage manufacturer could monitor Coca-Cola, Pepsi, and other beverage competitors across multiple retailers. A breakfast category analysis could compare Kellogg's, General Mills, and other brands across cereal products.
The key value is longitudinal visibility. A single weekly report provides a snapshot, whereas a dataset collected consistently from 2020 through 2026 can provide a historical baseline against which new price and assortment changes are evaluated.
This allows grocery brands to connect competitive observations with commercial decisions involving pricing, promotions, distribution, assortment, and retailer relationships.
Price is only one part of grocery competitiveness. A product that is competitively priced but unavailable cannot generate the same sales opportunity as an item that is consistently in stock. Metro Sobeys Walmart grocery product availability monitoring Canada therefore adds an important dimension to price and market analysis.
Statistics Canada reported that food and beverage retailers generated $159.5 billion in operating revenue in 2024, while grocery prices remained elevated despite slower inflation. The scale of the market makes product availability a significant dataset for manufacturers, retailers, and category managers.
| Availability metric | Example insight |
|---|---|
| In-stock percentage | Measure product availability |
| Out-of-stock frequency | Identify recurring supply issues |
| Availability by region | Locate geographic gaps |
| Availability by retailer | Compare distribution coverage |
| New SKU appearance | Identify assortment expansion |
| SKU disappearance | Detect possible delisting |
| Price + stock relationship | Study promotional availability |
| Category availability | Compare shelf coverage |
Between 2020 and 2026, grocery availability became particularly important as retailers adapted to pandemic-era disruptions, supply-chain pressures, changing consumer demand, and evolving digital shopping behaviour. A historical monitoring system can preserve each observation with a timestamp so that temporary stockouts can be separated from persistent assortment changes.
For example, if a cereal product disappears from a retailer's online catalogue for two days and then returns, the event may represent a temporary stock issue. If the product remains unavailable for several weeks, the data can flag a potential assortment or distribution change.
Availability data can also be combined with pricing. Analysts can determine whether promotional periods coincide with stockouts or whether certain products maintain availability while competing products experience interruptions.
Regional analysis is equally important. Metro's concentration in Ontario and Quebec means a national comparison may conceal regional availability differences. Sobeys' network of banners and Walmart's broad store footprint can similarly create local differences in assortment.
For grocery brands, this information can support distribution reviews, retailer negotiations, supply planning, and digital shelf monitoring. For retailers, it can help identify categories where assortment or availability requires closer attention.
A 2020-2026 historical dataset ultimately provides context for interpreting today's availability. Rather than viewing an out-of-stock product as an isolated event, businesses can determine whether the same SKU has experienced repeated interruptions, whether competitors remained available, and whether availability patterns differ by geography.
Walmart analytics can be integrated into a broader competitive intelligence framework covering pricing, promotions, products, sellers, availability, assortment, and historical market movements. For grocery brands and retailers, the objective is not simply to collect large volumes of online information but to convert those observations into consistent, analysis-ready datasets.
Actowiz Metrics can support workflows involving:
Metro vs Sobeys vs Walmart grocery price comparison Canada can be incorporated into a retailer-monitoring framework that normalizes product names, package sizes, prices, promotional offers, availability, and collection timestamps.
The broader value of the approach is historical consistency. Businesses can compare current observations with previous periods instead of relying exclusively on manually captured snapshots.
Actowiz Metrics can also structure the data for use with business intelligence platforms, spreadsheets, databases, or custom analytics environments. This enables pricing, marketing, category-management, and strategy teams to work from a common data foundation.
Canadian grocery pricing has changed considerably between 2020 and 2026. Statistics Canada data shows substantial grocery inflation during 2022 and 2023, moderation in 2024, and renewed annual-average price growth in 2025. At the same time, Canada's grocery market remains highly significant, with food and beverage retailers generating $159.5 billion in operating revenue in 2024.
The expansion of online retail and digital promotions makes structured product data increasingly useful for understanding grocery competition. Retailers and brands can monitor regular prices, promotions, product availability, assortment changes, package sizes, and regional differences to build a more complete view of the market.
Grocery and FMCG (CPG) digital shelf analytics can bring these datasets together, allowing businesses to examine product visibility, pricing, promotions, availability, and competitive positioning across digital retail channels.
Metro vs Sobeys vs Walmart grocery price comparison Canada provides a practical framework for comparing major retail environments while recognizing that geographic coverage, store formats, product assortments, and promotional strategies can differ.
With consistent data collection and historical analysis, grocery businesses can transform fragmented retailer observations into structured competitive intelligence that supports pricing analysis, category management, promotion planning, assortment decisions, and market monitoring.
Build a smarter Canadian grocery intelligence strategy with Actowiz Metrics and turn retailer product, pricing, promotion, and availability data into actionable business insights!
Expert blogs, research reports and infographics — practical, data-driven reading across e-commerce and quick-commerce.
Most fields are optional — the more you share, the better your sample.
.webp "infographics")
.webp "infographics")