BLOG


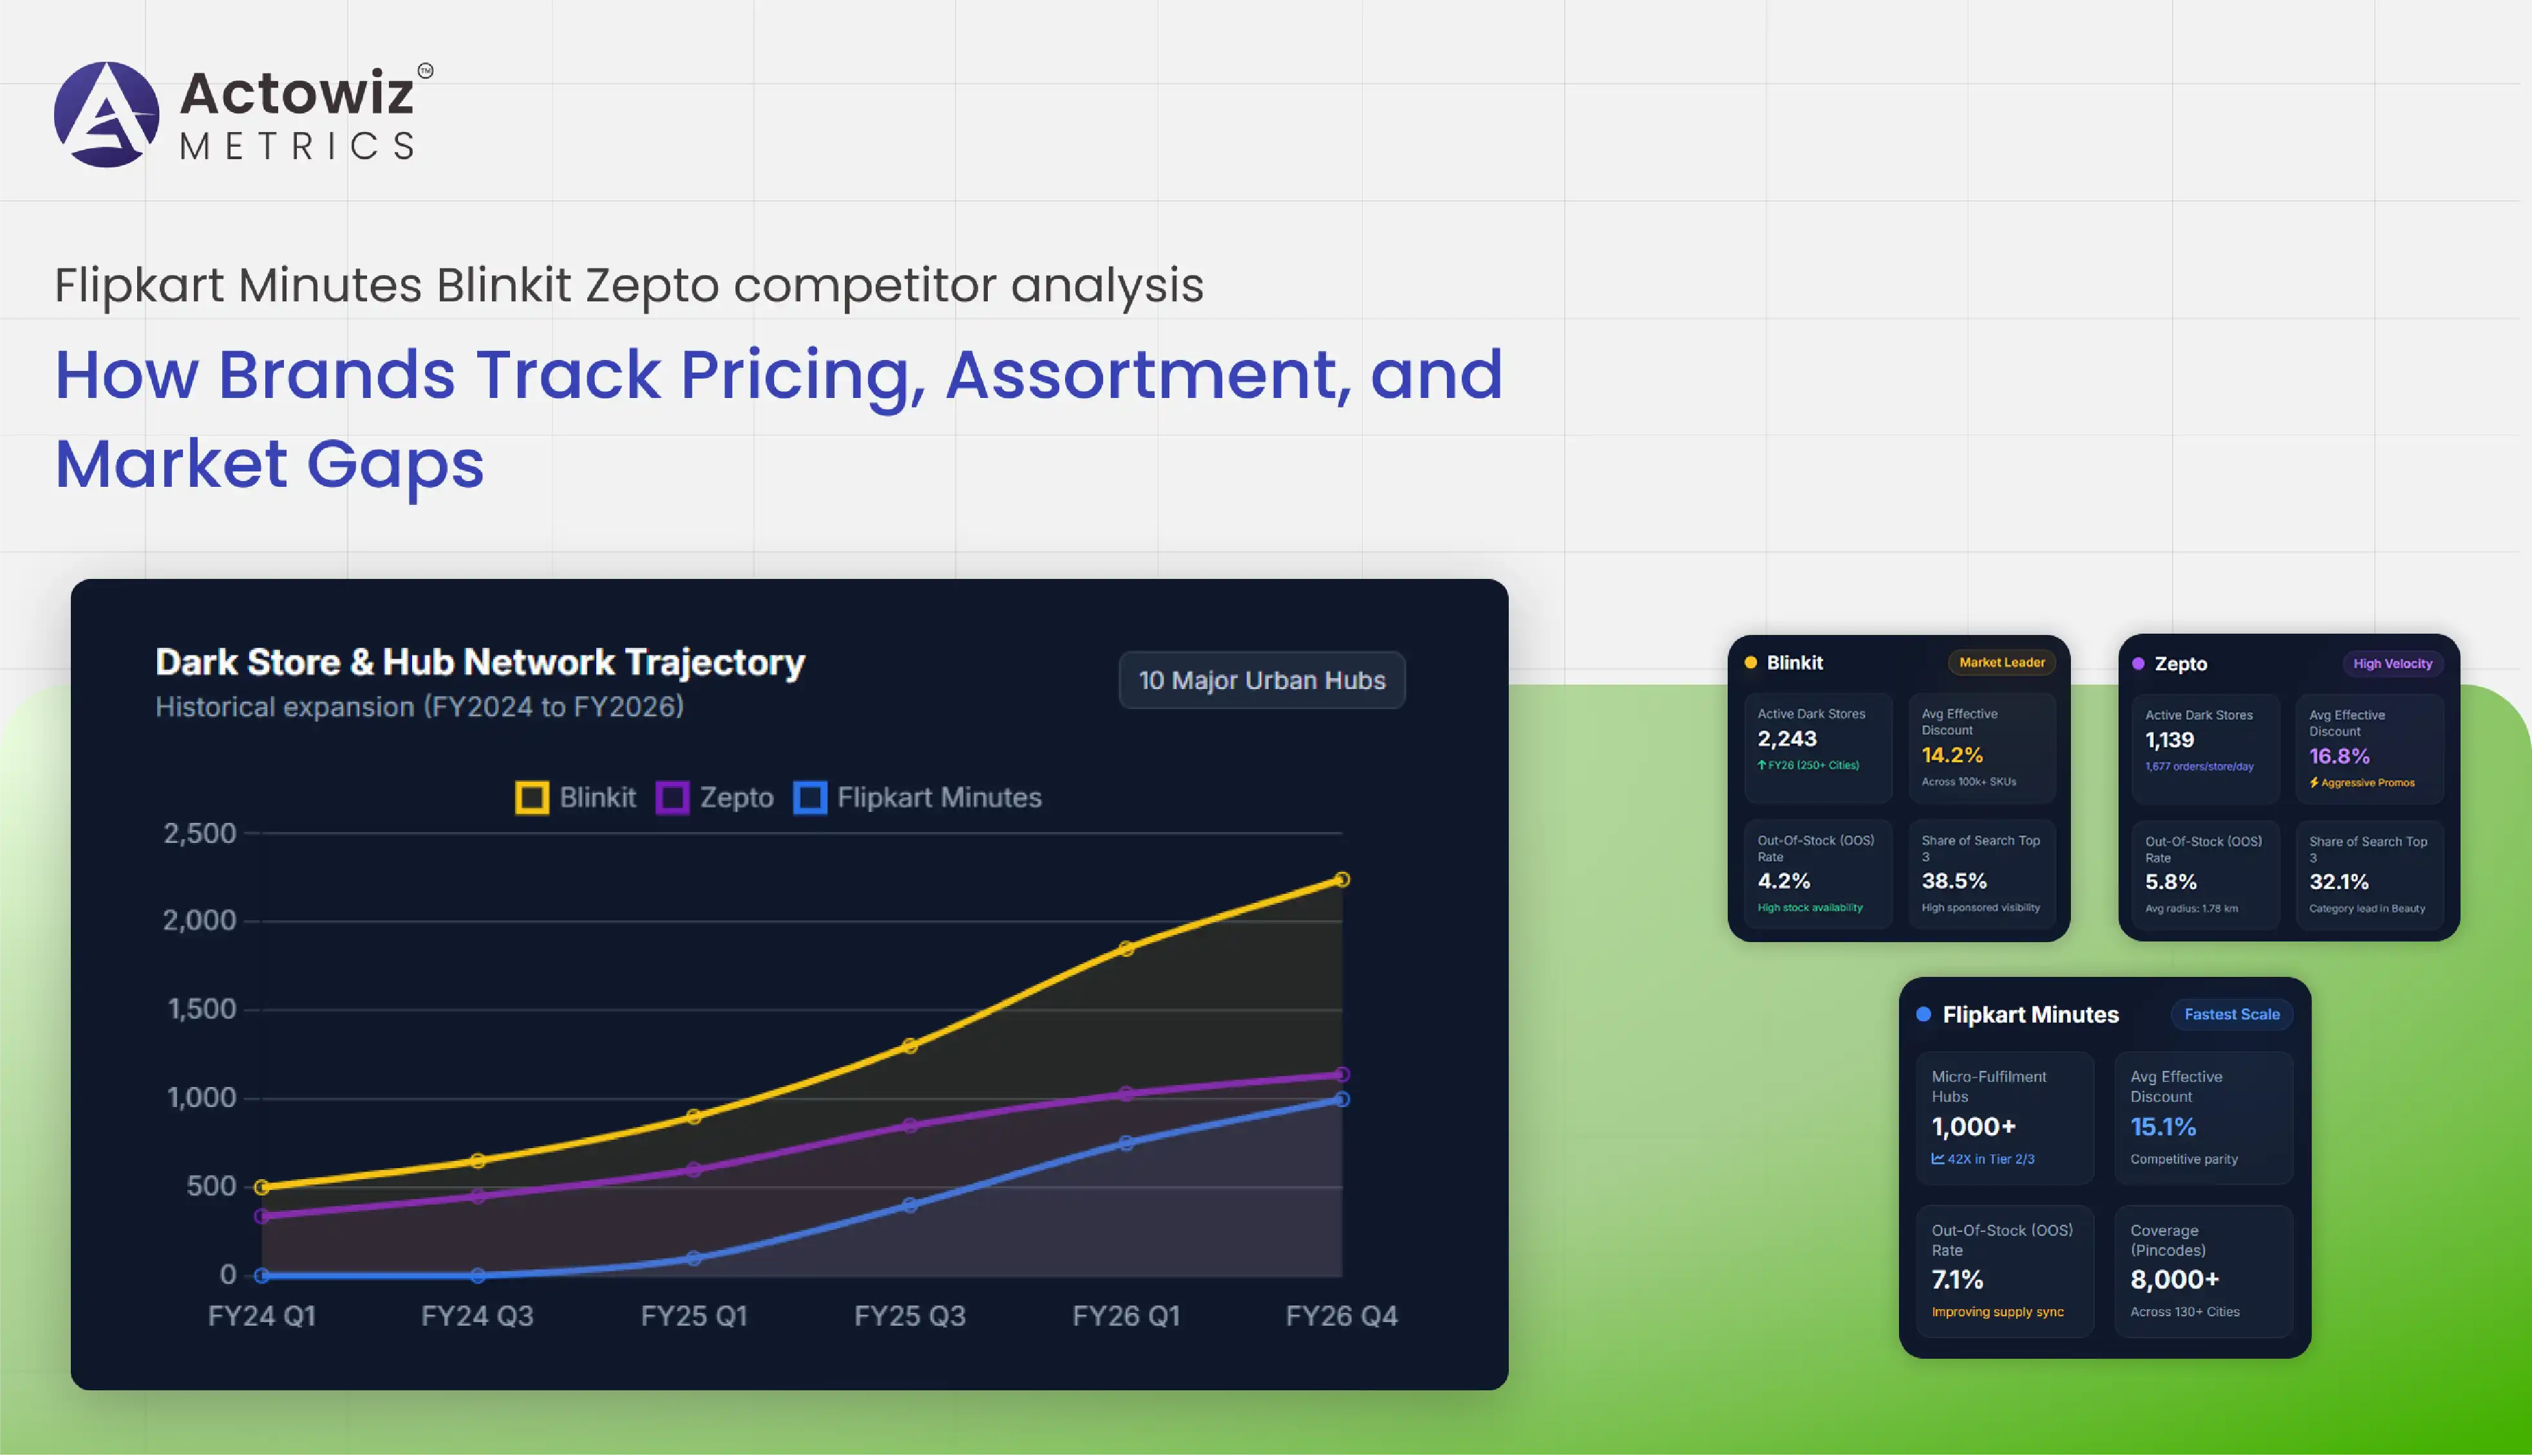
Flipkart Minutes Blinkit Zepto competitor analysis helps brands understand how competing quick-commerce platforms differ in pricing, assortment, availability, promotions, store coverage, and digital shelf execution. For FMCG manufacturers, D2C brands, retailers, distributors, and marketplace teams, continuous monitoring can reveal where products are underrepresented, where competitors discount more aggressively, and where availability gaps create opportunities.
India's quick-commerce sector has expanded rapidly since 2020, moving from a convenience-led urban service toward a broader retail channel. Flipkart Minutes launched in August 2024 and has since expanded to more than 1,000 micro-fulfilment centres across 130+ cities and 8,000+ pincodes as of June 2026. Flipkart reported that its orders had grown fivefold following network expansion. (Flipkart Stories)
At the same time, Blinkit had 2,243 stores across 250+ cities by March 2026, while its quick-commerce net order value reached ₹48,567 crore in FY2026, up 117% year over year. (FinancialFilings) Zepto's updated draft prospectus reported 1,139 dark stores at the end of FY2026, with throughput reaching 1,677 orders per dark store per day during the fiscal year. (Zepto Now)
These developments make structured competitive intelligence increasingly important. Brands need to compare not just headline prices but SKU-level availability, pack sizes, discounts, seller or brand visibility, category placement, and changes across locations.
Blinkit and Zepto competitor price monitoring for Flipkart Minutes enables brands to compare equivalent SKUs across competing quick-commerce platforms and identify differences in listed price, discount depth, promotional frequency, and effective selling price.
Price comparison is particularly important in categories such as packaged food, beverages, personal care, home care, beauty, dairy, and consumer electronics. A 5-10 difference may appear small at SKU level but can influence price perception when repeated across a high-volume category.
| Indicator | Why Brands Track It | Business Use |
|---|---|---|
| Listed price | Identifies platform-level price differences | Price benchmarking |
| Discount % | Measures promotional intensity | Promotion analysis |
| Effective selling price | Shows actual customer-facing economics | Revenue planning |
| Pack size | Prevents misleading comparisons | Unit-price benchmarking |
| Coupon/offer | Captures conditional discounts | Promotion intelligence |
| Availability | Separates price gaps from stock gaps | Competitive diagnosis |
The importance of monitoring can be seen in the rapid expansion of the platforms. In August 2026, CLSA mapping across 10 major
From 2020 onward, quick commerce shifted the competitive landscape from conventional e-commerce price comparison toward hyperlocal price comparison. During the early period, the primary differentiation was delivery speed. By 2023-2024, platforms increasingly competed through assortment, discounts, private labels, and dark-store density. Flipkart Minutes entered the market in 2024 and initially focused on building its supply-chain and store infrastructure. By 2025, Flipkart stated that Minutes was operating across 19 cities and more than 2,900 pincodes, with 900+ categories. (Flipkart Stories) By 2026, the competitive environment had become much broader, with platforms expanding geographically and increasing SKU depth. For brands, this means price monitoring should be location-aware. The same SKU can have different availability, delivery fees, promotional offers, or selling prices depending on the customer's pincode. A robust system therefore captures platform, city, pincode, SKU, brand, pack size, MRP, selling price, discount, promotion, timestamp, and availability together.
Blinkit competitor analysis for Flipkart Minutes allows category managers to evaluate how products perform across two rapidly expanding quick-commerce ecosystems.
The comparison should extend beyond price. Brands should examine assortment depth, product ranking, category visibility, pack-size distribution, promotional placement, stock status, and the number of competing SKUs.
| Benchmark Area | Flipkart Minutes | Blinkit | What Brands Can Measure |
|---|---|---|---|
| Store footprint | 1,000+ micro-fulfilment centres by June 2026 | 2,243 stores at Mar-26 | Geographic reach |
| Category breadth | 250+ categories reported in 2026 | 1 lakh+ SKUs reported in FY26 | Assortment depth |
| Store density | Rapid Tier 2/3 expansion | Strong urban network density | Local competition |
| Inventory visibility | Real-time inventory synchronization | High-density fulfilment network | Availability |
| Promotions | Platform and brand offers | Discounts and sponsored visibility | Promotion intensity |
Flipkart reported that Minutes reached 1,000 micro-fulfilment centres across 130+ cities and 8,000+ pincodes by June 2026. It also reported 42X year-over-year scale in Tier 2 and Tier 3 markets. (Flipkart Stories)
Blinkit's FY2026 annual report data shows that the platform expanded to 2,243 stores across 250+ cities and offered more than 100,000 SKUs across India. (FinancialFilings)
The 2020-2022 period established quick commerce primarily as an urban delivery model. Between 2023 and 2025, competitive differentiation increasingly shifted toward store density, assortment, category expansion, and customer retention. By 2026, the comparison had become more granular because platforms operated at significantly different geographic scales. Flipkart Minutes' expansion into Tier 2 and Tier 3 markets means a brand can no longer assume that competitive pricing observed in a major metro represents national conditions. A useful benchmark therefore separates metro and non-metro markets and compares the same SKU across equivalent pincodes. Brands can also calculate a competitive price index, assortment overlap, out-of-stock rate, promotional intensity, and visibility share. These measures provide a more complete picture than a simple price spreadsheet and help identify whether a competitor is gaining advantage through pricing, availability, assortment, or merchandising.
Zepto competitor analysis for Flipkart Minutes helps brands identify differences in assortment, SKU availability, product positioning, and pricing between two fast-growing platforms.
Zepto's FY2026 information provides useful evidence of how dense dark-store operations can influence product availability. Its updated draft prospectus states that the company's dark-store count increased from 337 at the end of FY2024 to 1,029 at the beginning of FY2026 and 1,139 at the end of FY2026. (Zepto Now)
| Metric | FY2024 | FY2025 | FY2026 |
|---|---|---|---|
| Closing dark stores | 337 | 1,029 | 1,139 |
| Orders/day/store | 1,325 | 1,565 | 1,677 |
| Average delivery distance | 2.05 km | 1.73 km | 1.78 km |
| Dark stores opened | 136 | 699 | 169 |
| Dark stores closed | 9 | 7 | 59 |
The data demonstrates why competitive monitoring needs an operational layer. A competitor with greater store density may show better availability even when its listed assortment is not fundamentally different.
Between 2020 and 2022, quick-commerce competition was concentrated in a relatively limited number of urban clusters. From 2023 onward, platforms began increasing dark-store density to reduce delivery distances and improve order throughput. Zepto's reported progression demonstrates this operational shift. Its throughput increased from 1,325 orders per dark store in FY2024 to 1,677 in FY2026. (Zepto Now) For brands, the implication is that product-level competitive intelligence should be linked to geography. If a SKU is available on Zepto but unavailable on Flipkart Minutes in the same locality, the difference could affect sales capture even when consumer demand is similar. Monitoring should therefore capture SKU availability at multiple pincodes, record timestamps, compare equivalent products, and distinguish genuine assortment differences from temporary stockouts. Category managers can then identify high-demand products where availability needs improvement and products where competitor expansion creates a new opportunity for distribution.
Flipkart Minutes product availability tracking helps businesses determine whether products are consistently visible and purchasable across target locations.
For quick commerce, an unavailable SKU can effectively disappear from the consumer journey. A product may be listed in the catalogue but show as out of stock, unavailable in a particular location, or temporarily replaced by another product.
| Availability Metric | Measurement | Recommended Action |
|---|---|---|
| In-stock rate | Available observations ÷ total observations | Improve replenishment |
| Out-of-stock rate | OOS observations ÷ total | Investigate supply |
| Availability by pincode | SKU availability by location | Identify geographic gaps |
| Availability duration | Length of stockout periods | Prioritize critical SKUs |
| Assortment coverage | Listed SKUs vs target SKU universe | Prioritize critical SKUs |
| Substitution rate | Replacement products shown | Identify missing products |
Flipkart's technology stack includes real-time inventory synchronization, AI-led demand forecasting, dynamic routing, and smart substitutions. (Flipkart Stories) These capabilities illustrate why availability is closely connected to technology and fulfilment rather than simply catalogue management.
The role of availability changed substantially from 2020 to 2026. In conventional e-commerce, customers could tolerate longer delivery windows for many categories. Quick commerce introduced a much stronger expectation of immediate fulfilment. Consequently, inventory visibility became a competitive metric. Flipkart Minutes' expansion from its August 2024 launch to 1,000 micro-fulfilment centres by June 2026 illustrates the scale of infrastructure being deployed to support local availability. (Flipkart Stories) For brands, availability monitoring should track both breadth and consistency. A product available in 90% of monitored observations but unavailable during peak demand periods may still experience significant sales leakage. Businesses should segment products into high-priority, seasonal, promotional, and long-tail SKUs. They can then monitor availability more frequently for high-value products and use historical observations to identify recurring stockout patterns. This creates a practical bridge between digital shelf intelligence and supply-chain decision-making.
Blinkit digital shelf analytics gives brands a framework for evaluating how products appear to shoppers across a quick-commerce marketplace.
Digital shelf monitoring can include search placement, category position, product title, images, ratings, reviews, promotional badges, price, availability, pack information, and competing products.
| Digital Shelf KPI | What It Measures | Example Business Question |
|---|---|---|
| Search visibility | Product discovery | Can shoppers find the SKU? |
| Category visibility | Placement within category | Is the product prominently positioned? |
| Share of assortment | Brand SKU presence | How broad is our range? |
| Promotion visibility | Offer exposure | Is the competitor receiving more promotional attention? |
| Content completeness | Product-page quality | Are key attributes present? |
| Rating/review visibility | Social proof | How does the product compare with alternatives? |
Blinkit reported more than 100,000 SKUs across India by FY2026, demonstrating the scale at which digital shelf competition can occur. (FinancialFilings)
Digital shelf intelligence initially focused heavily on conventional e-commerce marketplaces, where brands tracked search rankings, content, ratings, reviews, and pricing. Quick commerce introduced another layer: local availability. From 2020 through 2023, brands increasingly needed to understand how products appeared across different online channels. Between 2024 and 2026, the emergence of large quick-commerce assortments made SKU-level monitoring more complex. Flipkart Minutes reported 900+ categories during its first year and later expanded to more than 250 categories while extending its geographic footprint. (Flipkart Stories) As assortment expands, brands need to distinguish between being listed and being visible. A SKU may exist in a platform catalogue without receiving strong search placement or remaining consistently in stock. Digital shelf analytics can combine visibility, content, pricing, promotion, and availability into a single dashboard. This allows category managers to identify whether a competitor's advantage comes from better pricing, stronger content, greater assortment, or better local fulfilment.
Zepto Product Data Analytics can help brands convert raw observations from quick-commerce platforms into structured insights around pricing, assortment, availability, promotions, and competitive positioning.
For a cross-platform strategy, businesses should build a standardized product dataset. Each record can include platform, city, pincode, SKU, product name, brand, category, pack size, MRP, selling price, discount, promotional message, availability, rating, review count, product URL, timestamp, and relevant shelf-position information.
The quick-commerce market has progressed from a small urban experiment into a large multi-platform retail ecosystem. In August 2026, CLSA's mapping across 10 major cities showed 3,536 dark stores collectively operated by Blinkit, Zepto, Flipkart Minutes, Swiggy Instamart, and BigBasket, with Blinkit at 969, Zepto at 828, and Flipkart Minutes at 627. (Apparel Resources) The scale and geographic variation create a significant data-management requirement for brands. Manual checks can identify individual price differences, but they are less suitable for monitoring thousands of SKU-location combinations over time. Structured datasets enable historical comparison and trend analysis. Brands can calculate average price differences, availability rates, assortment overlap, promotion frequency, and SKU-level competitive indices. They can also identify recurring patterns, such as a competitor consistently discounting a particular pack size or gaining availability in a new city. This transforms marketplace observation into an ongoing intelligence process that can support pricing, category management, supply planning, and channel strategy.
Actowiz Metrics can support brands that need structured, recurring competitive intelligence across quick-commerce platforms. The objective is not simply to collect product pages but to transform marketplace observations into standardized datasets that can be compared over time and across locations.
Actowiz Metrics can structure data from relevant platforms into consistent schemas so businesses can compare products using equivalent attributes. This is especially useful when product names, pack sizes, promotional language, and category structures differ between platforms.
Zepto analytics can support SKU-level monitoring of pricing, assortment, availability, promotions, and product attributes. Historical datasets can help businesses identify changes rather than relying only on a single snapshot.
The broader Flipkart Minutes Blinkit Zepto competitor analysis framework can combine:
A practical competitive intelligence workflow can connect raw collection with business KPIs. For example, category teams can flag SKUs where a competitor's price is consistently lower, supply teams can identify recurring stockouts, and marketing teams can monitor promotional frequency.
The dataset can also be segmented by city, pincode, category, brand, pack size, or SKU. This allows businesses to identify regional differences instead of relying on national averages.
For management teams, the output can be converted into dashboards showing price gaps, availability trends, assortment overlap, promotion intensity, and competitive movements over time.
The rapid expansion of quick commerce has made competitive intelligence increasingly granular. Brands now need to understand not only what competing platforms charge but also what they stock, where products are available, how deeply categories are covered, and how prominently products appear to shoppers.
The growth of Flipkart Minutes, Blinkit, and Zepto demonstrates the scale of this shift. Flipkart Minutes reached 1,000 micro-fulfilment centres by June 2026, Blinkit operated 2,243 stores at the end of FY2026, and Zepto reported 1,139 dark stores at the same fiscal year-end. (Flipkart Stories)
For brands, Quick Commerce Intelligence should therefore combine pricing, product, availability, promotion, assortment, and digital shelf data rather than treating each metric independently.
Build a structured competitive intelligence program with Actowiz Metrics to monitor quick-commerce pricing, assortment, availability, promotions, and market gaps across Flipkart Minutes, Blinkit, and Zepto!
Expert blogs, research reports and infographics — practical, data-driven reading across e-commerce and quick-commerce.
Most fields are optional — the more you share, the better your sample.
.webp "infographics")
.webp "infographics")