BLOG


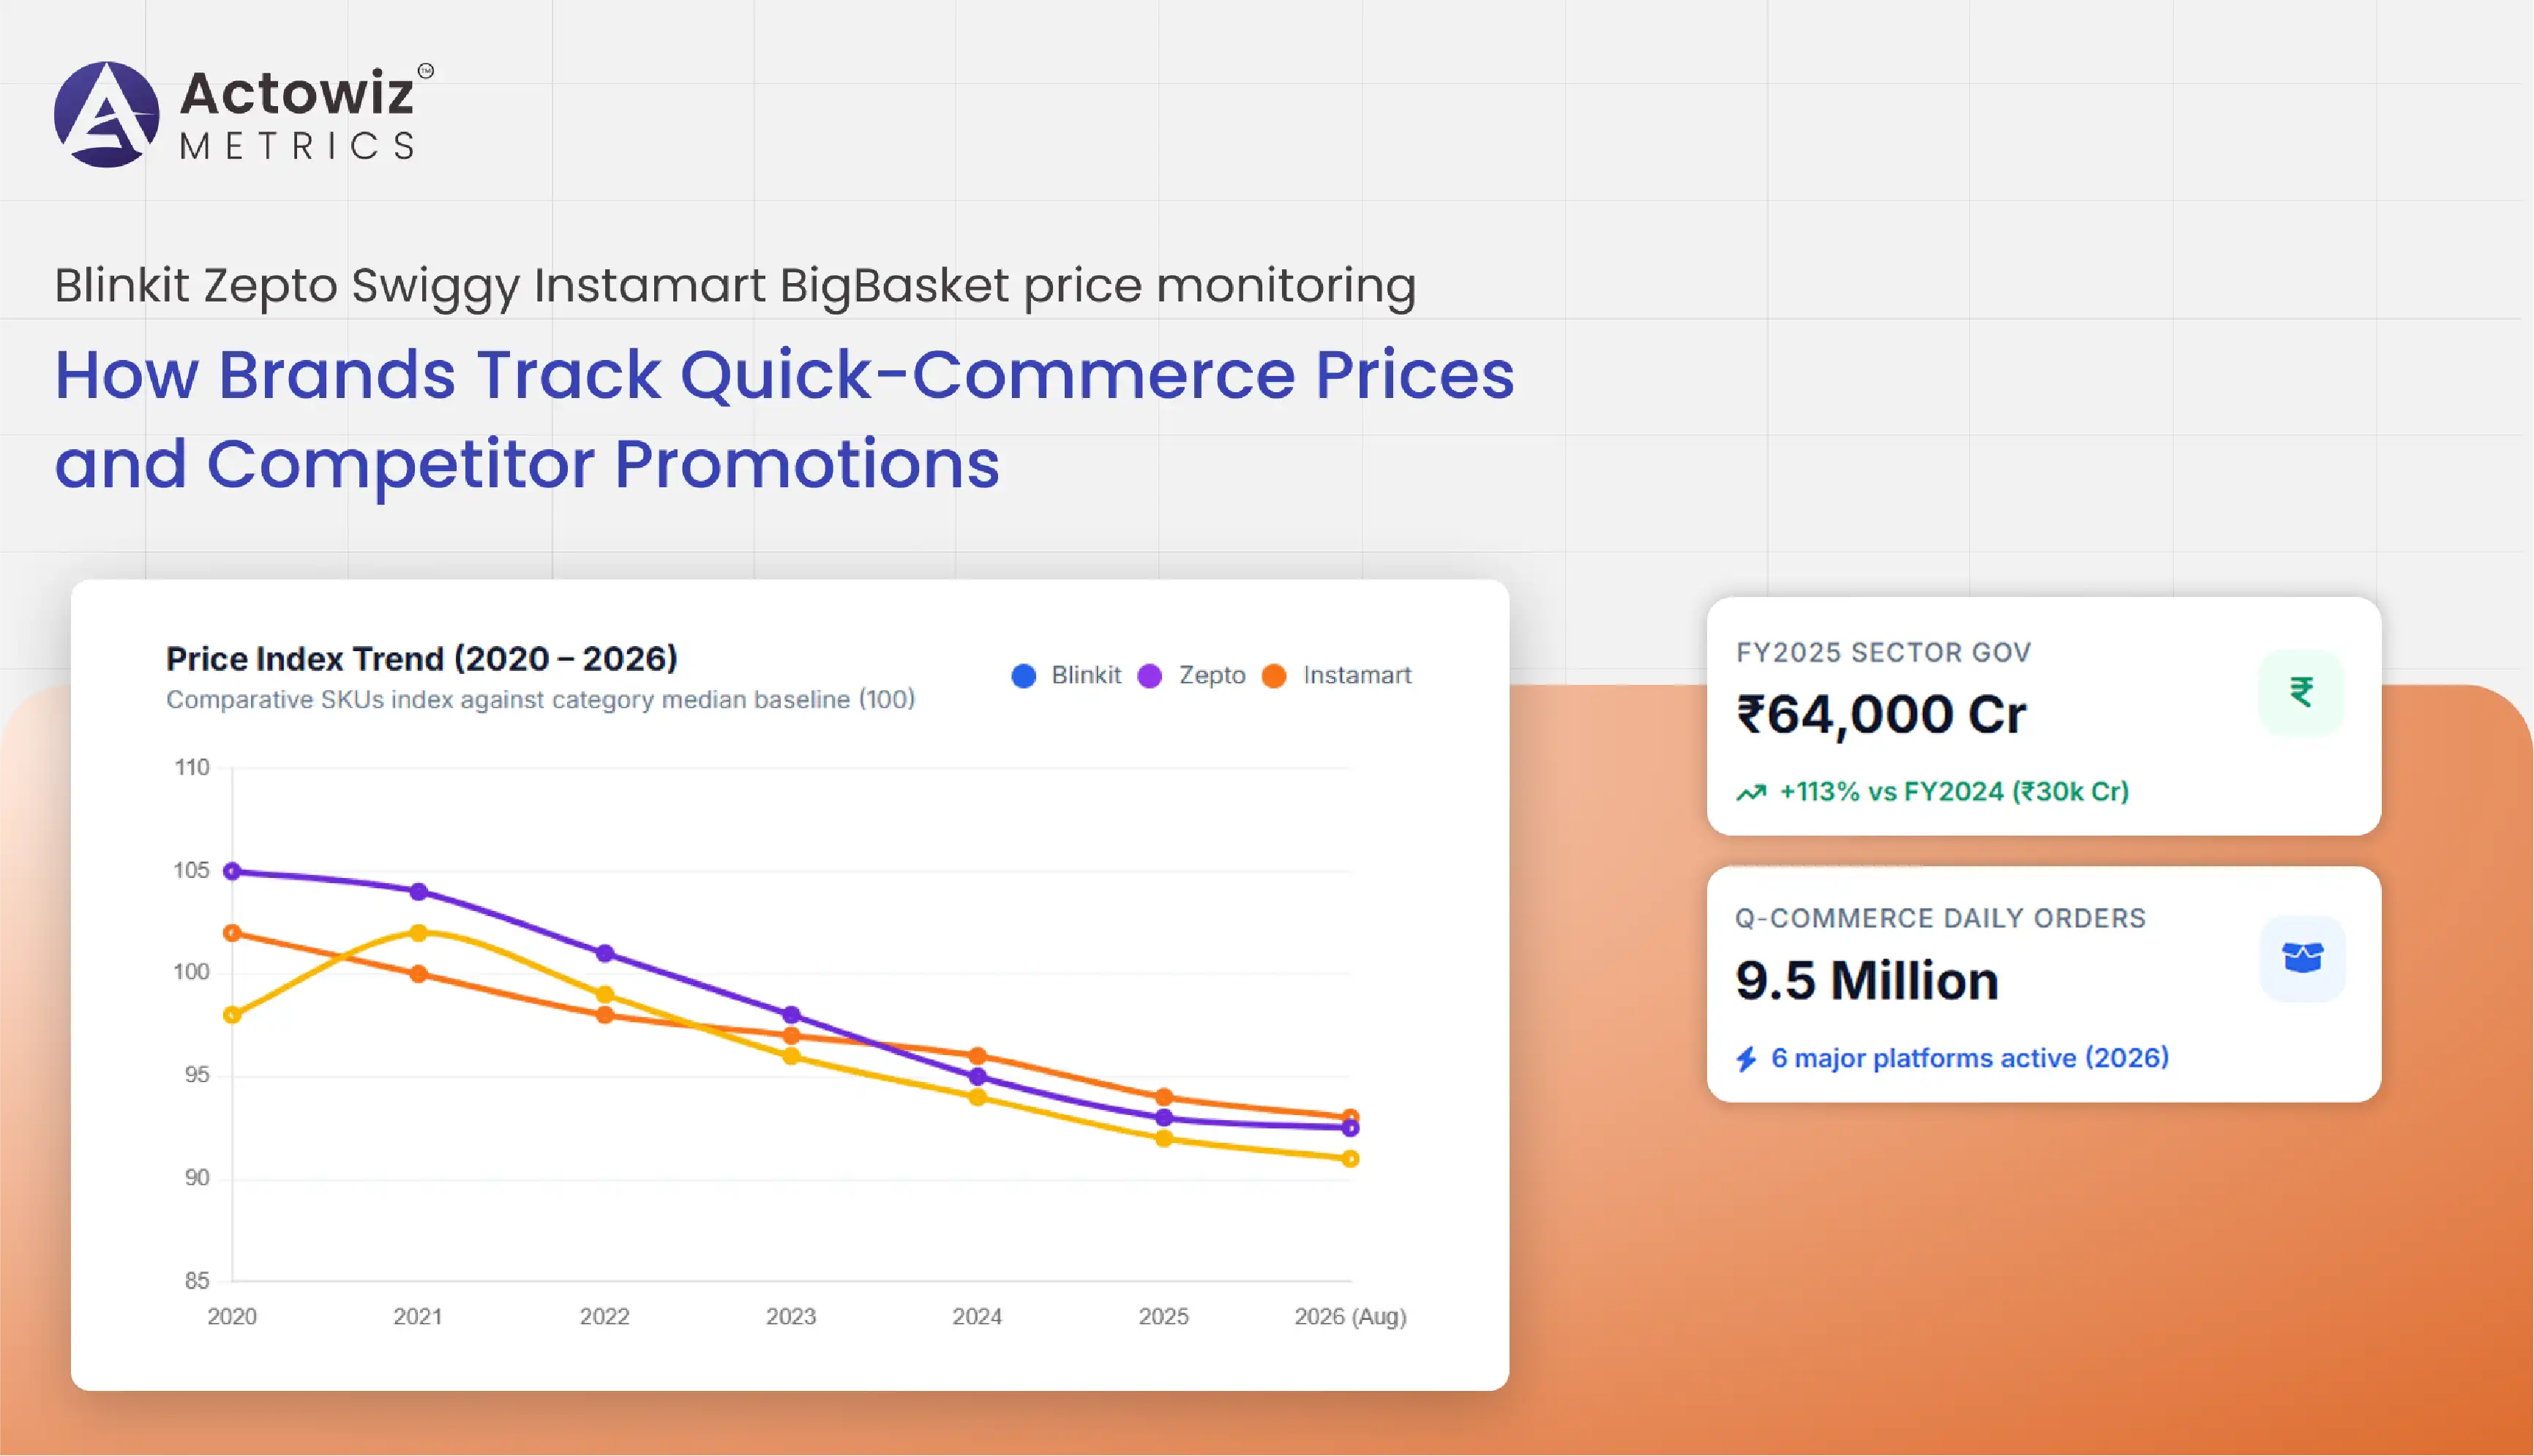
Blinkit Zepto Swiggy Instamart BigBasket price monitoring helps brands compare consumer-facing prices, discounts, promotions, assortment, and competitive movements across India's leading quick-commerce platforms. The business need is significant: India's quick-commerce gross order value reached about ₹64,000 crore in FY2025, more than double the ₹30,000 crore reported for FY2024, according to CareEdge data cited by IBEF. (India Brand Equity Foundation)
Quick commerce has also become a substantial part of digital grocery purchasing. A Flipkart-Bain report cited by Moneycontrol found that quick commerce accounted for more than two-thirds of online grocery orders and around one-tenth of e-retail spending in 2024, with sector GMV reaching approximately $7 billion. (Moneycontrol)
For FMCG manufacturers, D2C brands, retailers, distributors, and pricing teams, the challenge is no longer simply knowing a competitor's price. Prices can differ by platform, city, pincode, pack size, promotion, seller, and time of day. A ₹99 product on one platform may be ₹109 on another, while an apparent discount may result from a different pack configuration.
This report examines how brands can use structured quick-commerce data to benchmark prices, identify promotional patterns, analyze baskets, monitor competitors, and understand platform-level differences from 2020 through 2026.
Quick commerce competitor price monitoring India gives brands a structured way to compare identical and comparable products across platforms. Blinkit Zepto Swiggy Instamart BigBasket price monitoring can capture price, MRP, discount, pack size, seller, availability, and collection timestamp for each observation.
The central challenge is comparability. A 500-gram product cannot be directly benchmarked against a 400-gram pack simply because both appear under the same category. Brands should therefore calculate normalized metrics such as price per 100 grams, price per unit, price per serving, or price per litre.
Which pricing indicators should brands track?
| Metric | What It Measures | Business Use |
|---|---|---|
| Selling price | Current consumer price | Direct price comparison |
| MRP | Listed reference price | Discount calculation |
| Discount % | MRP vs. selling price | Promotion intensity |
| Unit price | Price normalized by quantity | Fair comparison |
| Price index | Brand price vs. category benchmark | Positioning |
| Price gap | Difference between platforms | Channel comparison |
| Promotion frequency | Number of promotional observations | Discount dependency |
| Price volatility | Frequency/magnitude of changes | Pricing stability |
Quick commerce has moved from an emerging delivery model into a major retail channel during this period. In 2024, the sector generated approximately $7 billion in GMV, compared with $1.6 billion in 2022, according to the Flipkart-Bain report cited by Moneycontrol. (Moneycontrol) By FY2025, CareEdge data cited by IBEF put quick-commerce gross order value at approximately ₹64,000 crore, up from ₹30,000 crore in FY2024. The number of dark stores also increased by more than 70% to 3,072 in FY2025. (India Brand Equity Foundation) In March 2025, Blinkit, Zepto, and Swiggy Instamart together were estimated to process approximately 4.15-4.45 million orders per day, more than double their estimated 2024 level. (Moneycontrol) By August 2026, industry data reported by Moneycontrol showed six major quick-commerce platforms collectively crossing 9 million daily orders, with Blinkit at roughly 3.4-3.6 million, Zepto at 2.4-2.6 million, and Instamart at 1.3-1.45 million. This scale increases the importance of automated price intelligence, where Blinkit analytics can help businesses monitor thousands of changing SKU-platform-location combinations more efficiently than manual price checks.
Brands can create a daily price index for every priority SKU:
Price Index = SKU Selling Price ÷ Comparable Category Median × 100
A result below 100 indicates a lower observed price than the selected benchmark, while a result above 100 indicates a higher observed price.
This framework helps pricing teams identify whether a competitor is consistently cheaper or only temporarily discounted.
10-minute delivery basket analytics India expands price intelligence from individual products to complete shopping baskets. This matters because consumers rarely purchase only one SKU. They may compare the total cost of several products, including groceries, snacks, beverages, household items, and personal-care products.
A brand may therefore have a competitive SKU price but still appear expensive when the complete basket is considered.
Which basket metrics matter?
| Basket Metric | Example | Business Question |
|---|---|---|
| Basket value | £450 | What is the typical order value? |
| SKU count | 8 products | How large are typical baskets? |
| Average item price | £56 | What is the basket's price structure? |
| Discount value | £75 | How much promotion supports the basket? |
| Effective basket price | £375 | What does the consumer actually pay? |
| Category mix | Grocery + snacks + beverages | Which categories drive baskets? |
| Platform gap | £375 vs. £405 | Which platform provides lower observed basket cost? |
Basket analysis should also account for delivery charges, platform fees, minimum-order thresholds, coupons, and membership benefits where those are publicly observable. Otherwise, the comparison may reflect only product-level prices rather than the actual consumer proposition.
The rapid growth of quick commerce has increased the relevance of basket-level measurement. The 2024 Flipkart-Bain research indicated that quick commerce represented more than two-thirds of online grocery orders, demonstrating how rapidly the channel moved into routine grocery shopping. (Moneycontrol) CareEdge data cited by IBEF subsequently showed quick-commerce order value exceeding ₹64,000 crore in FY2025. (India Brand Equity Foundation) By 2026, Moneycontrol reported approximately 9.5 million daily orders across six major quick-commerce platforms based on August industry data. (Moneycontrol) The growth changes the analytical question for brands. In 2020, monitoring an individual product's online price could provide useful competitive information; by 2026, brands increasingly need to understand how their products contribute to a complete quick-commerce basket. A product can be priced competitively but become less attractive if a competing platform offers lower prices across several products in the same basket. Similarly, a promotion on one SKU may attract a larger basket, making its commercial effect greater than its individual discount percentage suggests. Basket analytics therefore helps category and revenue teams evaluate pricing in the context of the full shopping mission.
Brands can construct standardized baskets such as:
The same basket can then be compared across platforms and locations over time.
This provides a more consumer-centric measure of price competitiveness.
Zepto analytics helps brands examine SKU-level price movements, product availability, promotions, assortment, and competitive positioning on Zepto.
The most useful approach is to monitor comparable products rather than simply collecting the lowest available price.
For each SKU, brands should maintain a historical record containing:
Blinkit Zepto Swiggy Instamart BigBasket price monitoring can then place Zepto observations into a cross-platform benchmark.
What should a Zepto price dashboard contain?
| Dashboard Component | KPI |
|---|---|
| SKU pricing | Median selling price |
| Discount | Average discount % |
| Competitor gap | Price difference vs. benchmark |
| Availability | In-stock observation rate |
| Promotion | Promotion frequency |
| Pack economics | Price per 100g/unit |
| Price volatility | Weekly/monthly movement |
| Assortment | Active SKU count |
Zepto's rapid expansion illustrates why platform-specific monitoring matters. In March 2024, Zepto was estimated to process approximately 0.45-0.55 million daily orders; by March 2025, that estimate had increased to approximately 1.45-1.55 million daily orders, representing roughly 200% growth. (Moneycontrol) In August 2025, Moneycontrol reported that Zepto accounted for approximately 23% of quick-commerce net merchandise value in the week of August 4-11, while Blinkit accounted for 52% and Swiggy Instamart 25%, based on the data it obtained. (Moneycontrol) The market continued to expand in 2026: August industry data reported by Moneycontrol estimated Zepto at 2.4-2.6 million daily orders. (Moneycontrol) These figures are platform-wide rather than category-specific, but they demonstrate why Zepto represents a meaningful observation point for brands building cross-platform price intelligence. From 2020 through 2026, the rise of large-scale quick commerce has made it increasingly useful to track not just whether a product is listed but how its price, discount, availability, and competitive position change over time. A historical Zepto dataset can reveal whether a price movement is temporary, promotional, seasonal, or part of a longer competitive trend.
Price gap detection: Identify SKUs consistently priced above or below a cross-platform benchmark.
Promotion persistence: Distinguish one-day discounts from recurring promotions.
Pack-size normalization: Prevent misleading comparisons between different quantities.
Assortment monitoring: Identify products appearing or disappearing from the platform.
Competitive response: Measure how quickly competing products change prices following a promotion.
Blinkit competitor product monitoring India helps brands observe competitor assortment, pricing, promotions, availability, and product positioning on one of India's largest quick-commerce platforms.
Competitor monitoring should not be restricted to direct substitutes. A packaged-snack brand, for example, may compete with several adjacent snack formats depending on consumer use case and price point.
Which competitor signals matter?
| Signal | Interpretation |
|---|---|
| New SKU | Competitor assortment expansion |
| Price reduction | Possible promotional activity |
| Discount increase | Stronger price incentive |
| Product disappearance | Potential delisting or stock issue |
| New pack size | Portfolio experimentation |
| Rating growth | Increasing consumer engagement |
| Availability increase | Wider distribution |
| Bundle | Alternative value proposition |
Blinkit's scale makes its marketplace activity particularly relevant for competitive monitoring. In March 2025, Moneycontrol reported an estimated 1.65-1.75 million daily orders for Blinkit, compared with 1.45-1.55 million for Zepto and 1.05-1.15 million for Swiggy Instamart. (Moneycontrol) In August 2026, the same publication reported approximately 3.4-3.6 million daily orders for Blinkit, based on Datum Intelligence and industry sources. (Moneycontrol) IBEF reported in September 2026 that Blinkit processed around 900 million orders in FY26 and held an estimated 44% quick-commerce market share, while noting that such market-share figures come from industry analysis rather than company-reported category data. (India Brand Equity Foundation) These figures demonstrate the growing scale of the platform, but brands should avoid interpreting platform order growth as proof of a particular SKU's performance. Instead, competitor monitoring should collect direct marketplace observations and combine them with validated sales or distribution data where available. From 2020 to 2026, the growth of quick commerce has also increased the number of competitive events brands must monitor: new products, discounts, bundles, assortment changes, regional launches, and changes in availability. A structured competitor dataset allows category teams to identify these events systematically rather than discovering them through occasional manual checks.
A practical hierarchy is:
Tier 1: Direct product substitutes.
Tier 2: Same category and price band.
Tier 3: Adjacent products competing for the same shopping mission.
Tier 4: Emerging products with rapid assortment or visibility growth.
This approach prevents category teams from collecting large volumes of irrelevant competitor data.
Swiggy Instamart basket price tracking India allows businesses to compare complete shopping missions rather than isolated product prices. This is especially valuable when platforms use different discount structures.
For example, Platform A may offer a lower SKU price, while Platform B may provide a larger basket discount. Comparing only one product would not reveal the difference in consumer economics.
Which basket components should be tracked?
| Component | Measurement |
|---|---|
| Product subtotal | Sum of item prices |
| Delivery charge | Observable delivery fee |
| Platform fee | Additional platform charges |
| Discount value | Product and basket discounts |
| Coupon value | Applicable coupon savings |
| Effective basket price | Final payable amount |
| Delivery estimate | Promised delivery time |
They can identify:
This can support more precise promotional planning.
BigBasket analytics adds operational context to price monitoring. Price is only one part of the quick-commerce proposition. Consumers also care about availability, delivery speed, assortment, and the final amount payable.
For brands, delivery-performance data can help explain why a product's price position may not translate directly into competitive performance.
Which metrics should be connected?
| Metric | Business Question |
|---|---|
| Displayed price | What does the product cost? |
| Discount | How much promotional support exists? |
| Availability | Can consumers actually purchase it? |
| Delivery estimate | How quickly can it arrive? |
| Basket value | What does the complete order cost? |
| Assortment | What alternatives are available? |
| Store coverage | How broadly is the product distributed? |
| Delivery reliability | Does the displayed promise remain consistent? |
BigBasket has been part of the broader transition toward rapid delivery and quick-commerce fulfillment. In March 2025, Moneycontrol reported approximately 0.4-0.5 million daily BigBasket orders, while noting that BigBasket had recently shifted toward quick commerce, making direct year-on-year comparisons less meaningful. (Moneycontrol) By August 2026, Moneycontrol reported BigBasket at approximately 500,000-600,000 daily orders based on Datum Intelligence and industry sources. (Moneycontrol) A separate August 2026 CLSA mapping reported that BigBasket had 497 dark stores across India's top 10 cities, compared with 969 for Blinkit and 828 for Zepto. (Moneycontrol) These figures show why operational comparison should be separated from simple market-size comparisons: a platform can have fewer stores but still have strong availability in selected locations. From 2020 through 2026, quick-commerce competition increasingly involved a combination of price, assortment, delivery coverage, and fulfillment capability. For brands, monitoring only selling price can therefore produce an incomplete picture. BigBasket analytics can help combine these variables and evaluate product pricing, availability, store coverage, and delivery performance by location and time. A product may have a lower price but limited availability, while another may cost slightly more but have broader store coverage and faster delivery.
It can help determine:
1. Where a product is competitively priced.
2. Where the same SKU is unavailable.
3. Which platforms provide broader assortment.
4. Where delivery promises differ.
5. Whether discounts coincide with availability changes.
6. Which markets require additional distribution attention.
This creates a more complete picture of marketplace performance.
For brands operating across multiple quick-commerce platforms, the main challenge is not collecting a single price. It is maintaining a consistent, historical, comparable dataset across thousands of SKUs, locations, and observation periods.
Actowiz Metrics can support this process through structured marketplace data collection, normalization, validation, and analytics-ready delivery.
Multi-platform monitoring: Collect comparable product and pricing observations across selected quick-commerce platforms.
SKU normalization: Standardize product names, pack sizes, variants, and identifiers to prevent inaccurate comparisons.
Historical price tracking: Preserve timestamped price observations to distinguish short-term promotions from sustained pricing changes.
Promotion intelligence: Track discounts, promotional periods, and changes in promotional intensity.
Assortment intelligence: Identify new listings, delistings, pack-size changes, and assortment expansion.
Location-level comparison: Compare pricing and availability across cities, pincodes, or selected market clusters.
Competitive benchmarking: Build category-specific competitor sets for more meaningful comparisons.
Dashboard-ready datasets: Deliver structured records for BI platforms, spreadsheets, databases, or internal analytics systems.
A multi-platform intelligence system can place Zepto observations beside comparable Blinkit, Instamart, and BigBasket records. This allows brands to analyze:
The result is a repeatable analytical framework rather than a one-time market snapshot.
| Dashboard | Core KPI |
|---|---|
| Price Intelligence | Median SKU price |
| Promotion | Average discount |
| Competitive Gap | Price difference |
| Assortment | Active SKU count |
| Availability | In-stock rate |
| Basket | Standardized basket cost |
| Geography | Location-level price variance |
| History | Week/month price movement |
| Competitor | Comparable SKU benchmark |
| Operations | Availability and delivery indicators |
This structure allows commercial, category, revenue, and marketplace teams to work from the same evidence base.
Swiggy Instamart analytics and cross-platform marketplace intelligence are becoming increasingly important as India's quick-commerce ecosystem expands in scale, geography, assortment, and competitive intensity.
The available industry evidence illustrates the pace of change. Quick-commerce GOV reached approximately ₹64,000 crore in FY2025, more than double FY2024, while dark-store numbers increased by more than 70% to 3,072. (India Brand Equity Foundation) By August 2026, six major platforms were reported to be processing approximately 9.5 million orders per day. (Moneycontrol) At the same time, Redseer estimated that India's quick-commerce packaged F&B channel could grow from approximately $4 billion to more than $25 billion in GMV by 2030. (Redseer Strategy Consultants)
These developments create a clear data requirement for brands: monitor price, promotion, assortment, availability, basket economics, and competitive movements continuously rather than relying on occasional manual checks.
A robust research framework should:
Want to turn quick-commerce price changes into actionable competitive intelligence? Contact Actowiz Metrics to build a scalable Blinkit, Zepto, Swiggy Instamart, and BigBasket data monitoring workflow tailored to your SKUs, categories, markets, and pricing objectives!
Expert blogs, research reports and infographics — practical, data-driven reading across e-commerce and quick-commerce.
Most fields are optional — the more you share, the better your sample.
.webp "infographics")
.webp "infographics")