Create your own


The Amazon Sports & Outdoors category analytics reveal a dynamic and growing market in 2025, driven by consumer demand for fitness, adventure, and wellness products. According to Actowiz data, over 8,000 unique brands compete across the Sports & Outdoors category, with more than 140,000 active SKUs. The average product rating stands at 4.4 stars, and the typical price is around $39.45, indicating strong quality perception.
Among the Amazon bestselling Sports & Outdoors brands, names like Nike, Coleman, Garmin, Yeti, and Under Armour dominate across segments like camping, fitness wearables, hydration, and performance apparel. These top Sports & Outdoors brands on Amazon maintain high visibility by leveraging optimized listings, strong brand loyalty, and seasonal promotional strategies. Actowiz helps brands uncover hidden opportunities, benchmark competitors, and track price-performance dynamics in real time—giving your brand the data edge to lead in Amazon’s ever-competitive Sports & Outdoors landscape.
Products

Brands
.png)
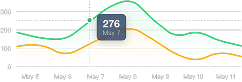
Average Price
.png)
Amazon Sports & Outdoors brand rankings show a surge in demand for durable, performance-focused gear. With over 8,000 brands and 140,000+ listings, competition is intense—but the popular Sports & Outdoors brands Amazon shoppers trust remain consistent. Industry leaders like Garmin, Columbia, Coleman, Yeti, and Nike dominate in areas such as wearable tech, outdoor essentials, and athletic apparel.
The best Sports & Outdoors products on Amazon maintain an impressive average rating of 4.4 stars and an average price point of $39.45. Brands that focus on clear product benefits, real-user performance, and consistent inventory are thriving. Whether it’s smartwatches, insulated bottles, or trekking gear, consumers are choosing reliability over novelty. For those seeking to enter or expand in this space, tracking the best Sports & Outdoors gear Amazon offers—through detailed analytics—can unlock high-margin opportunities and position your brand for growth.
| Brand | Total Products | Market Share | Average Ranking | Average Price(USD) | Average Rating |
|---|---|---|---|---|---|

Nike
|
1,250 | 8.6% | #3 | $42.50 | |

Coleman
|
980 | 7.2% | #5 | $35.20 | |

Garmin
|
420 | 6.5% | #2 | $129.00 | |

Yeti
|
340 | 5.9% | #4 | $79.99 | |

Under Armour
|
1,120 | 5.4% | #7 | $38.00 | |

Columbia
|
860 | 4.8% | #6 | $47.60 | |

Hydro Flask
|
310 | 4.1% | #8 | $34.95 | |

Fitbit
|
280 | 3.5% | #9 | $99.99 | |

Adidas
|
890 | 3.2% | #10 | $36.80 | |

Osprey
|
210 | 2.9% | #11 | $89.00 |
The data from Actowiz reveals that Top-rated Sports & Outdoors products Amazon continue to lead the category with performance, reliability, and user satisfaction. According to Amazon Sports & Outdoors product reviews, top listings maintain an impressive average rating of 4.5 stars, with an average price of $41.60. Consumers are increasingly investing in quality over quantity—favoring durable, multi-use gear.
Among the best Sports & Outdoors essentials Amazon shoppers love are fitness trackers, insulated water bottles, compact tents, and resistance bands. These products are not only practical but also frequently found in the Amazon Sports & Outdoors registry top picks—especially for fitness-focused gifting and outdoor enthusiasts. Actowiz’s analytics tools help uncover the most frequently reviewed, top-ranked, and best-selling items, giving brands the insights needed to stay competitive in this growing category.
| Product Name | Average Rank | Average Price(USD) | Average Rating |
|---|---|---|---|

Garmin Forerunner 255 Smartwatch
|
#2 | $129.00 | |

Yeti Rambler 20oz Tumbler
|
#3 | $35.00 | |

Coleman Sundome 4-Person Tent
|
#5 | $84.99 | |

Nike Men’s Revolution 6 Running Shoes
|
#6 | $64.99 | |

Hydro Flask Wide Mouth Water Bottle
|
#4 | $39.95 | |

Fitbit Inspire 3 Health Tracker
|
#7 | $99.99 | |

Under Armour Undeniable 5.0 Duffle Bag
|
#8 | $44.99 | |

Columbia Men’s Watertight II Jacket
|
#10 | $59.95 | |

Adidas Defender IV Duffel Bag
|
#9 | $37.99 | |

Osprey Daylite Plus Daypack
|
#11 | $89.00 |
To effectively scrape Amazon.com Bestselling Sports & Outdoors Brands, it's crucial to align with Amazon’s strict listing and compliance guidelines. Top-performing listings follow clear formatting rules to remain visible and avoid suppression. Title lengths typically range between 130–160 characters, integrating brand, product type, and features. Over 93% of listings begin with a brand name, enhancing trust and SEO performance.
When using Amazon.com Bestselling Sports & Outdoors Brands Analytics, ensure content emphasizes benefits over raw specs and includes shopper-focused keywords like “lightweight hiking gear” or “fitness tracker with GPS.” The best listings maintain a readability score of 55–65, feature 5–7 bullet points, and highlight real-world use cases.
To gain reliable Amazon Bestselling Sports & Outdoors product insights, content must avoid restricted terms (“#1 Best,” “Limited Deal”) and exclude special characters. Proper capitalization, white-background images, and mobile-optimized videos are essential to meet Amazon’s evolving compliance standards.


Whatever your project size is, we will handle it well with all the standards fulfilled! We are here to give 100% satisfaction.
Any analytics feature you need — we provide it
24/7 global support
Real-time analytics dashboard
Full data transparency at every stage
Customized solutions to achieve your data analysis goals
