BLOG


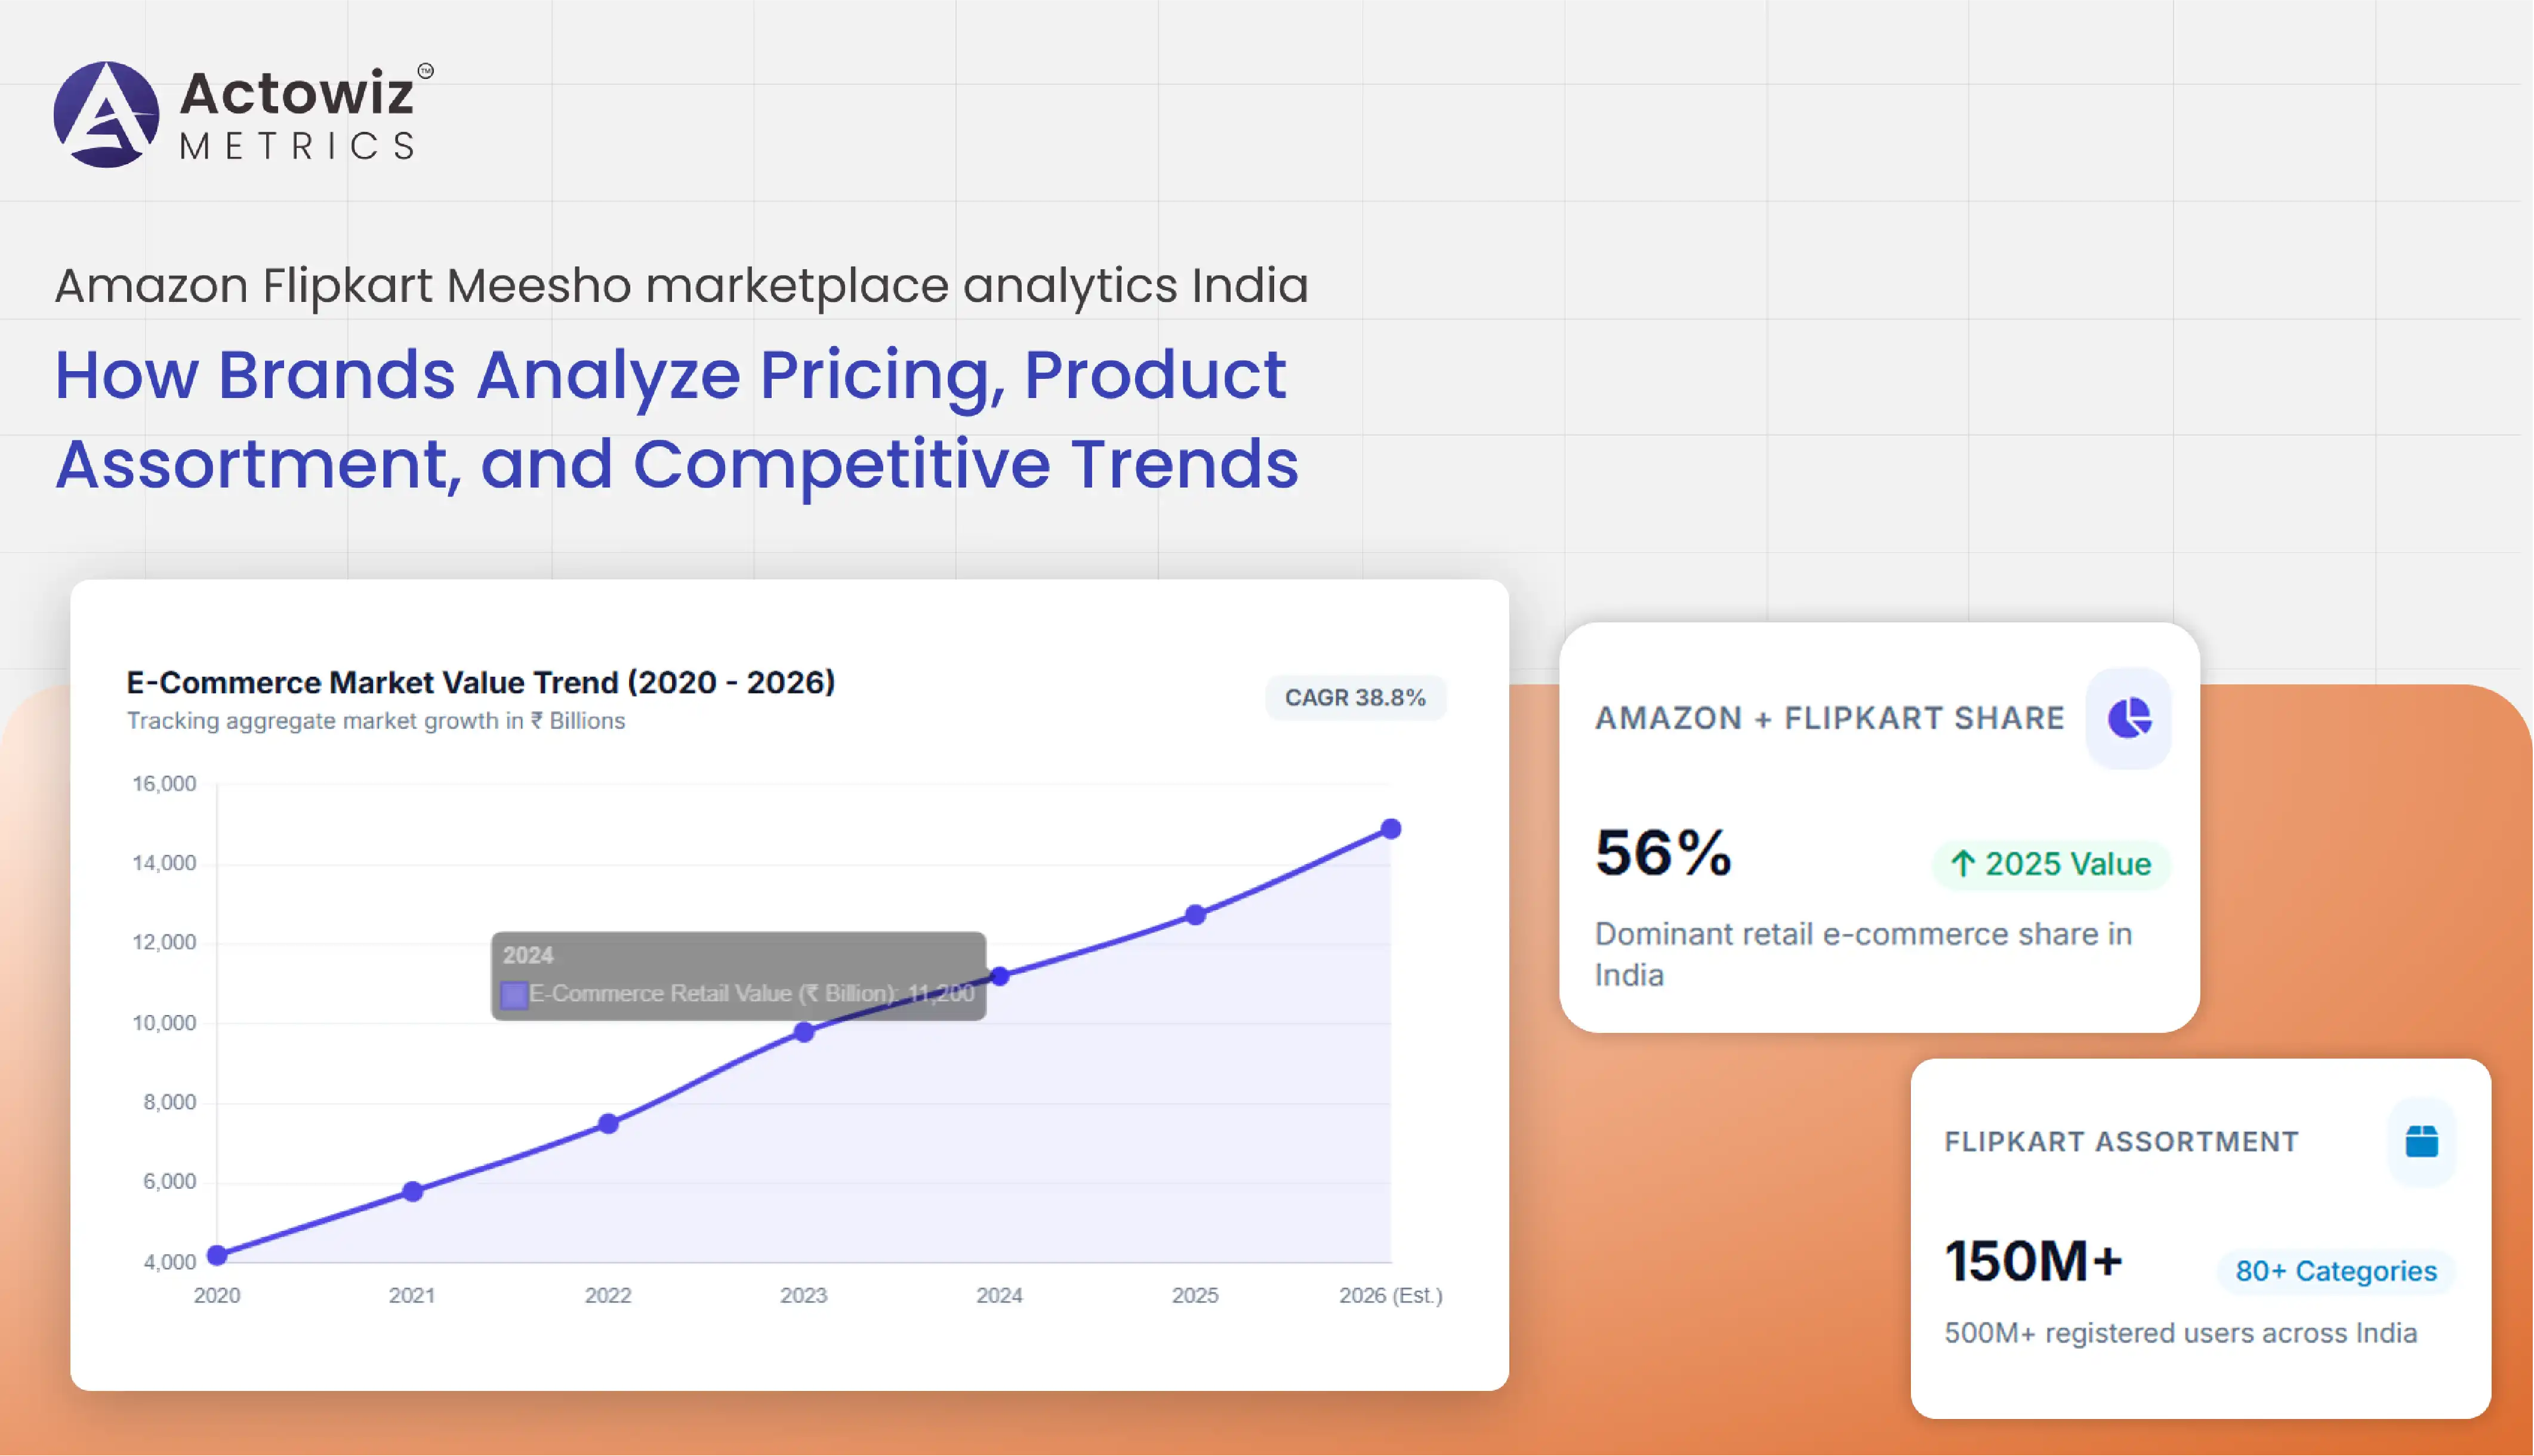
India's marketplace ecosystem is becoming increasingly competitive, making Amazon Flipkart Meesho marketplace analytics India important for brands that need to compare prices, product assortments, seller activity, availability, and promotional movements across major platforms. At the same time, E-commerce & D2C analytics enables brands to convert marketplace observations into measurable insights for pricing, assortment planning, competitor benchmarking, and digital shelf optimization.
The competitive landscape has expanded significantly between 2020 and 2026. Euromonitor reports that Amazon.in and Flipkart together accounted for 56% of India's retail e-commerce value share in 2025, while Meesho continued gaining relevance through affordability-led shopping. (Euromonitor) This creates a strong need for structured marketplace intelligence rather than relying on occasional manual checks.
For brands, the objective is no longer simply to know the selling price of a product. They need to understand how prices change across marketplaces, which sellers dominate specific categories, where discounts are deepest, how assortment differs, and how product visibility changes over time.
Amazon vs Flipkart vs Meesho e-commerce market intelligence India gives brands a framework for comparing three major marketplace environments through a common set of business metrics. Instead of analyzing each platform independently, businesses can monitor product counts, pricing, sellers, ratings, availability, promotions, and category movements within a unified dataset.
The importance of this approach increased as India's e-commerce market expanded. A 2025 industry estimate placed India's e-commerce market at ₹12,739.2 billion in FY2023, following a 38.8% CAGR during FY2018-FY2023. (Ken Research) Meanwhile, Walmart states that Flipkart has more than 500 million registered users and more than 150 million products across 80+ categories. (Walmart Corporate News)
| Indicator | Latest reported figure | Business implication |
|---|---|---|
| Amazon + Flipkart value share | 56% in 2025 | High concentration of marketplace demand |
| Flipkart registered users | 500M+ | Large potential customer base |
| Flipkart product assortment | 150M+ | Extensive SKU monitoring requirement |
| Amazon India sellers | 1.7M+ | High seller-level competition |
| Amazon customers | 100M+ | Large marketplace reach |
Amazon also reports more than 1.7 million sellers in India and more than 100 million customers. (About Amazon India)
From 2020 onward, marketplace competition accelerated as lockdown-driven online shopping brought more consumers and sellers into digital commerce. Amazon reported that more than 3 lakh new sellers had joined Amazon.in since 2020, while its Local Shops program expanded rapidly. (About Amazon India) By 2025, Flipkart reported a seller base of 1.4 million, demonstrating how marketplace participation had expanded. (Walmart Corporate News) By 2026, marketplace intelligence therefore requires cross-platform monitoring that can identify category-level movements instead of focusing on isolated product pages.
amazon flipkart meesho marketplace price monitoring in india helps brands understand how the same or comparable products are positioned across marketplaces. Price intelligence becomes more valuable when it captures list price, selling price, discount, coupon availability, seller, delivery information, and changes over time.
A single price snapshot can be misleading. A product may appear cheaper because of a temporary promotion, seller-funded discount, bank offer, coupon, or marketplace campaign. Continuous monitoring helps brands distinguish normal pricing from promotional pricing.
| Metric | What brands can monitor | Strategic use |
|---|---|---|
| List price | Original displayed price | MSRP comparison |
| Selling price | Current customer price | Competitive benchmarking |
| Discount | Percentage/value discount | Promotion analysis |
| Seller-specific pricing | Seller competition | Seller competition |
| Availability | In-stock/out-of-stock | Demand and supply signals |
| Price movement | Historical changes | Dynamic pricing analysis |
Amazon's 2025 Great Indian Festival illustrates the scale of promotional activity. Amazon reported 276 crore customer visits during the event and more than ₹1,000 crore in customer savings through bank offers, GST benefits, and cashback rewards. (About Amazon India)
Between 2020 and 2022, price competition increasingly became digital-first as consumers compared products across marketplaces before purchasing. During 2023-2024, brands increasingly had to account for seller-level price differences, marketplace campaigns, and category-specific discounting. By 2025-2026, large shopping events, faster delivery models, and wider seller participation made price monitoring a continuous requirement. Amazon's 2025 festive-event data also showed that nearly 25% of orders used UPI, while customers benefited from multiple promotional mechanisms. (About Amazon India) For brands, the implication is clear: pricing datasets should preserve historical observations instead of only reporting today's price.
Amazon analytics allows brands to monitor product-level pricing changes while simultaneously evaluating assortment depth, product variants, ratings, sellers, and availability. This is especially useful for categories where multiple SKUs compete within similar price bands.
For example, a brand may discover that its flagship product remains competitively priced but loses visibility because competing products offer additional pack sizes, stronger ratings, more sellers, or deeper promotional discounts.
| Product metric | Example analytical question |
|---|---|
| Product price | Is the product priced above key competitors? |
| Product assortment | Are competitors offering more variants? |
| Ratings | Which products have stronger customer trust? |
| Reviews | Which SKUs are generating greater engagement? |
| Availability | Are competitors frequently going out of stock? |
| Seller count | Is the product becoming more competitive? |
Amazon's current India marketplace scale illustrates why product-level monitoring is important. Amazon says its marketplace offers millions of products and serves customers across every serviceable pincode in India. (About Amazon India) Its 2025 festive event also recorded participation from sellers across numerous Indian cities and regions. (About Amazon India)
In 2020, many brands primarily focused on maintaining basic online availability as e-commerce adoption surged. From 2021 to 2023, product assortment, reviews, seller competition, and discount visibility became more important. During 2024-2025, marketplace complexity increased further as consumers gained access to wider selections and faster fulfillment options. Amazon reported that more than 4 crore products were delivered the same or next day during its 2025 Great Indian Festival, demonstrating the growing importance of fulfillment alongside product and price data. (About Amazon India) In 2026, product intelligence increasingly needs historical data so brands can distinguish temporary promotions from long-term assortment and pricing changes.
Flipkart analytics enables brands to identify competitor products, new launches, assortment expansion, price changes, seller activity, and availability patterns on one of India's largest marketplaces.
Flipkart's scale makes manual competitive research difficult. Walmart reports that the Flipkart Group has more than 500 million registered users and more than 150 million products across more than 80 categories. (Walmart Corporate News) Its seller ecosystem is also substantial, with Walmart reporting 1.4 million sellers in 2025. (Walmart Corporate News)
| Area | Monitoring objective |
|---|---|
| New products | Identify competitor launches |
| Product variants | Track assortment expansion |
| Price | Compare competitive positioning |
| Discounts | Identify promotional intensity |
| Seller activity | Measure marketplace competition |
The 2020-2021 period pushed brands to establish basic marketplace visibility. From 2022 onward, monitoring shifted toward competitive assortment and pricing because more sellers and products were available online. By 2024-2025, marketplace competition increasingly included faster fulfillment and broader category participation. Flipkart's expansion into services such as Flipkart Minutes also demonstrates how the competitive environment has expanded beyond traditional marketplace shopping. Walmart states that Flipkart Minutes launched in August 2024 and was expanding its product mix. (Walmart Corporate News) In 2026, competitor monitoring therefore needs to connect product, price, seller, availability, and fulfillment signals to provide a complete digital shelf view.
Meesho analytics helps brands understand a marketplace where affordability, broad seller participation, and category-specific demand can create different competitive dynamics from traditional marketplace models. Monitoring Meesho can reveal pricing clusters, assortment patterns, seller activity, product popularity, and category opportunities.
Meesho's market position has become particularly important in fashion and home-related categories. According to Meesho's industry report, for the twelve months ended June 30, 2025, it ranked first by placed orders in fashion and home, kitchen and furnishing, while ranking among the top three in beauty and personal care. (Meesho Investor Relations)
The same report estimated Meesho's category GMV share at 21-23% in fashion, 23-25% in home, kitchen and furnishing, and 8-10% in beauty and personal care. (Meesho Investor Relations)
| Category | Reported position/share |
|---|---|
| Fashion | #1 by placed orders |
| Home, kitchen & furnishing | #1 by placed orders |
| Beauty & personal care | Top 3 |
| Fashion GMV share | 21–23% |
| Home, kitchen & furnishing GMV share | 23–25% |
| Beauty & personal care GMV share | 8–10% |
From 2020 onward, Meesho benefited from the rapid digitization of smaller sellers and value-conscious shoppers. Between 2021 and 2024, its relevance expanded beyond a narrow social-commerce perception as it developed a broader marketplace proposition. Meesho's 2025 category data showed particularly strong positioning in fashion and home, kitchen and furnishing. (Meesho Investor Relations) This means brands should not evaluate Meesho only through headline price comparisons. Meesho analytics can instead connect product assortment, price bands, category share, seller presence, and customer engagement to reveal where brands can compete more effectively.
Amazon Flipkart Meesho marketplace performance analysis India brings product, pricing, seller, availability, and category data together to measure marketplace performance consistently.
A useful performance framework should move beyond revenue or sales estimates. Brands can create a marketplace scorecard that measures assortment breadth, competitive price position, promotional intensity, availability, review performance, and seller competition.
| KPI | Measurement | Business value |
|---|---|---|
| Price index | Brand price vs. competitors | Pricing decisions |
| Assortment index | Brand SKUs vs. competitors | Range planning |
| Availability rate | In-stock observations | Supply monitoring |
| Discount index | Average discount vs. category | Promotion planning |
| Rating index | Average rating vs. competitors | Product positioning |
| Seller density | Sellers per product/category | Competition assessment |
Between 2020 and 2022, marketplace measurement largely focused on availability and basic pricing. During 2023-2024, brands increasingly incorporated seller, ratings, reviews, assortment, and promotional data. By 2025, marketplace ecosystems had become substantially larger: Amazon reported more than 1.7 million sellers in India, while Flipkart reported 1.4 million sellers. (About Amazon India) The growth of Meesho's category presence further increased the importance of cross-platform benchmarking. In 2026, brands can benefit from historical KPI tracking that shows not only where a product stands today but also whether its competitive position is improving, weakening, or remaining stable.
Actowiz Metrics can help brands transform large volumes of marketplace observations into structured business intelligence. Instead of manually checking individual listings, organizations can create datasets covering product names, SKUs, prices, discounts, sellers, ratings, reviews, availability, categories, and other relevant marketplace attributes.
Actowiz Metrics can support recurring data collection and normalization so marketplace information is easier to compare across platforms and time periods. This can help brands build pricing dashboards, competitor monitoring systems, assortment reports, and historical trend analyses.
The scale of India's marketplace ecosystem makes structured data particularly valuable. Amazon currently reports more than 1.7 million sellers, while Flipkart has reported 1.4 million sellers, creating a large competitive environment for brands to monitor. (About Amazon India)
A standardized data pipeline can also help organizations compare products with different naming conventions, pack sizes, seller structures, and promotional formats. The result is a more consistent foundation for category intelligence, pricing strategy, and marketplace decision-making.
India's marketplace environment has evolved from basic online retail into a complex competitive ecosystem where price, assortment, sellers, availability, promotions, ratings, and fulfillment all influence product performance. Amazon, Flipkart, and Meesho each bring different customer segments, category strengths, seller ecosystems, and competitive dynamics.
Flipkart analytics can provide an important component of this broader marketplace intelligence strategy by helping brands understand assortment movements, competitor pricing, seller activity, and product availability.
For brands operating across multiple marketplaces, the biggest opportunity is to move from periodic manual checks to structured, historical, and comparable data. With consistent monitoring, businesses can identify pricing gaps, detect competitor launches, evaluate assortment changes, benchmark promotions, and make faster marketplace decisions.
Build a smarter marketplace intelligence strategy with structured, recurring e-commerce data from Actowiz Metrics and turn marketplace signals into actionable pricing, assortment, and competitive insights!
Expert blogs, research reports and infographics — practical, data-driven reading across e-commerce and quick-commerce.
Most fields are optional — the more you share, the better your sample.
.webp "infographics")
.webp "infographics")