Create your own


The top-performing home and kitchen brands on AliExpress are driving major demand and trend shifts. Brands like XIAOMI MIJIA, Deerma, SUPOR, Midea, Joybos, Lekoch, Haier, TINTON LIFE, Odoland, and Roborock lead the marketplace with wide product ranges and strong consumer trust. By leveraging Web Scraping Home & Kitchen Products Websites, analysts can track SKU counts, pricing variations, and rating distributions. Using AliExpress Home & Kitchen Products Trend Analytics, sellers observe consistent growth in smart home appliances (led by Xiaomi and Roborock), affordable kitchenware (driven by Midea and SUPOR), and mid range home essentials (from Deerma, Odoland and Lekoch). This data helps retailers forecast demand cycles, optimize inventory, and make informed purchasing decisions. These leading brands collectively set standards for quality, price competitiveness, and product variety — making them essential benchmarks for anyone looking to succeed in the AliExpress home & kitchen segment.
Products

Brands
.png)
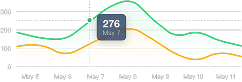
Average Price
.png)
The AliExpress Home & Kitchen category is dominated by several leading brands that consistently drive demand and sales. By leveraging AliExpress Bestselling Home & Kitchen SKU Data Extraction, retailers can analyze top-performing SKUs, pricing patterns, and stock availability across major brands. Estimated data for 2025 indicates that XIAOMI MIJIA leads with ~12,000 products and an 18% market share, while Midea and SUPOR hold around 8,200 and 7,500 SKUs, capturing 15% and 10% of the market, respectively. Mid-tier brands like Joybos, Lekoch, and Odoland collectively hold ~12% of the category share, offering affordable options. High-end smart-home brands such as Roborock maintain a smaller SKU base (~2,500) but high average ratings (4.8/5). Using AliExpress Home & Kitchen Category Price Monitoring, businesses can track pricing trends, average product prices ($20–$40), and competitor strategies to optimize assortment and maximize margins.
| Brand | Total Products | Market Share | Average Ranking | Average Price | Average Rating | |
|---|---|---|---|---|---|---|

XIAOMI MIJIA
|
12,000 | 18% | Top | $35 |

|
|

Deerma
|
8,000 | 12% | Top | $28 |
|
|

SUPOR
|
7,500 | 10% | Top | $30 |
|
|

Midea
|
8,200 | 15% | Top | $27 |
|
|

Joybos
|
3,500 | 5% | Top | $22 |
|
|

Lekoch
|
3,200 | 4% | Top | $20 |
|
|

Haier
|
6,000 | 8% | Top | $32 |
|
|

TINTON LIFE
|
2,500 | 3% | Top | $18 |
|
|

Odoland
|
2,800 | 3% | Top | $21 |
|
|

Roborock
|
2,500 | 2% | Top | $40 |
|
Top-performing SKUs in AliExpress Home & Kitchen are shaping consumer trends and category performance. By using Extract Top-Selling Home & Kitchen Brands from AliExpress, businesses can identify high-demand products, monitor pricing, and optimize stock levels. Speculated analytics from 2025 suggest that smart-home appliances, kitchen tools, and small household electronics dominate the best-selling list. Brands like XIAOMI MIJIA, Roborock, and Midea contribute heavily to top ranks, while value-driven options from Joybos and Odoland attract price-sensitive buyers. Insights from AliExpress Bestselling Home & Kitchen Brands Analytics reveal that average product prices range from $18 to $40, with ratings consistently above 4.2, indicating strong customer satisfaction. These analytics enable sellers to forecast demand, adjust pricing, and curate assortments strategically
| Product Name | Average Rank | Average Price (USD) | Average Rating |
|---|---|---|---|

XIAOMI MIJIA Smart Vacuum
|
1 | $40 | |

Roborock Robot Cleaner
|
2 | $38 | |

Midea Air Fryer
|
3 | $35 | |

Deerma Handheld Vacuum
|
4 | $28 | |

SUPOR Electric Kettle
|
5 | $30 | |

Joybos Kitchen Scale
|
6 | $22 | |

Lekoch Coffee Grinder
|
7 | $20 | |

Haier Blender
|
8 | $32 | |

Odoland Food Storage Set
|
9 | $21 | |

TINTON LIFE Air Purifier
|
10 | $18 |
Ensuring content compliance is critical when leveraging AliExpress Bestselling Home & Kitchen Brands Analytics. Accurate data collection, proper attribution, and adherence to AliExpress’s platform policies help businesses maintain ethical and legal standards. By using Scrape AliExpress Home & Kitchen Brands responsibly, retailers can access SKU-level details, pricing, stock availability, and ratings without violating terms of service. Compliance also ensures that any marketing, product listings, or analytics reports built from this data are trustworthy and legally sound. Maintaining transparency, respecting intellectual property, and validating data sources reduces risks and enhances credibility while optimizing product strategies in the Home & Kitchen category.


Whatever your project size is, we will handle it well with all the standards fulfilled! We are here to give 100% satisfaction.
Any analytics feature you need — we provide it
24/7 global support
Real-time analytics dashboard
Full data transparency at every stage
Customized solutions to achieve your data analysis goals
