Create your own


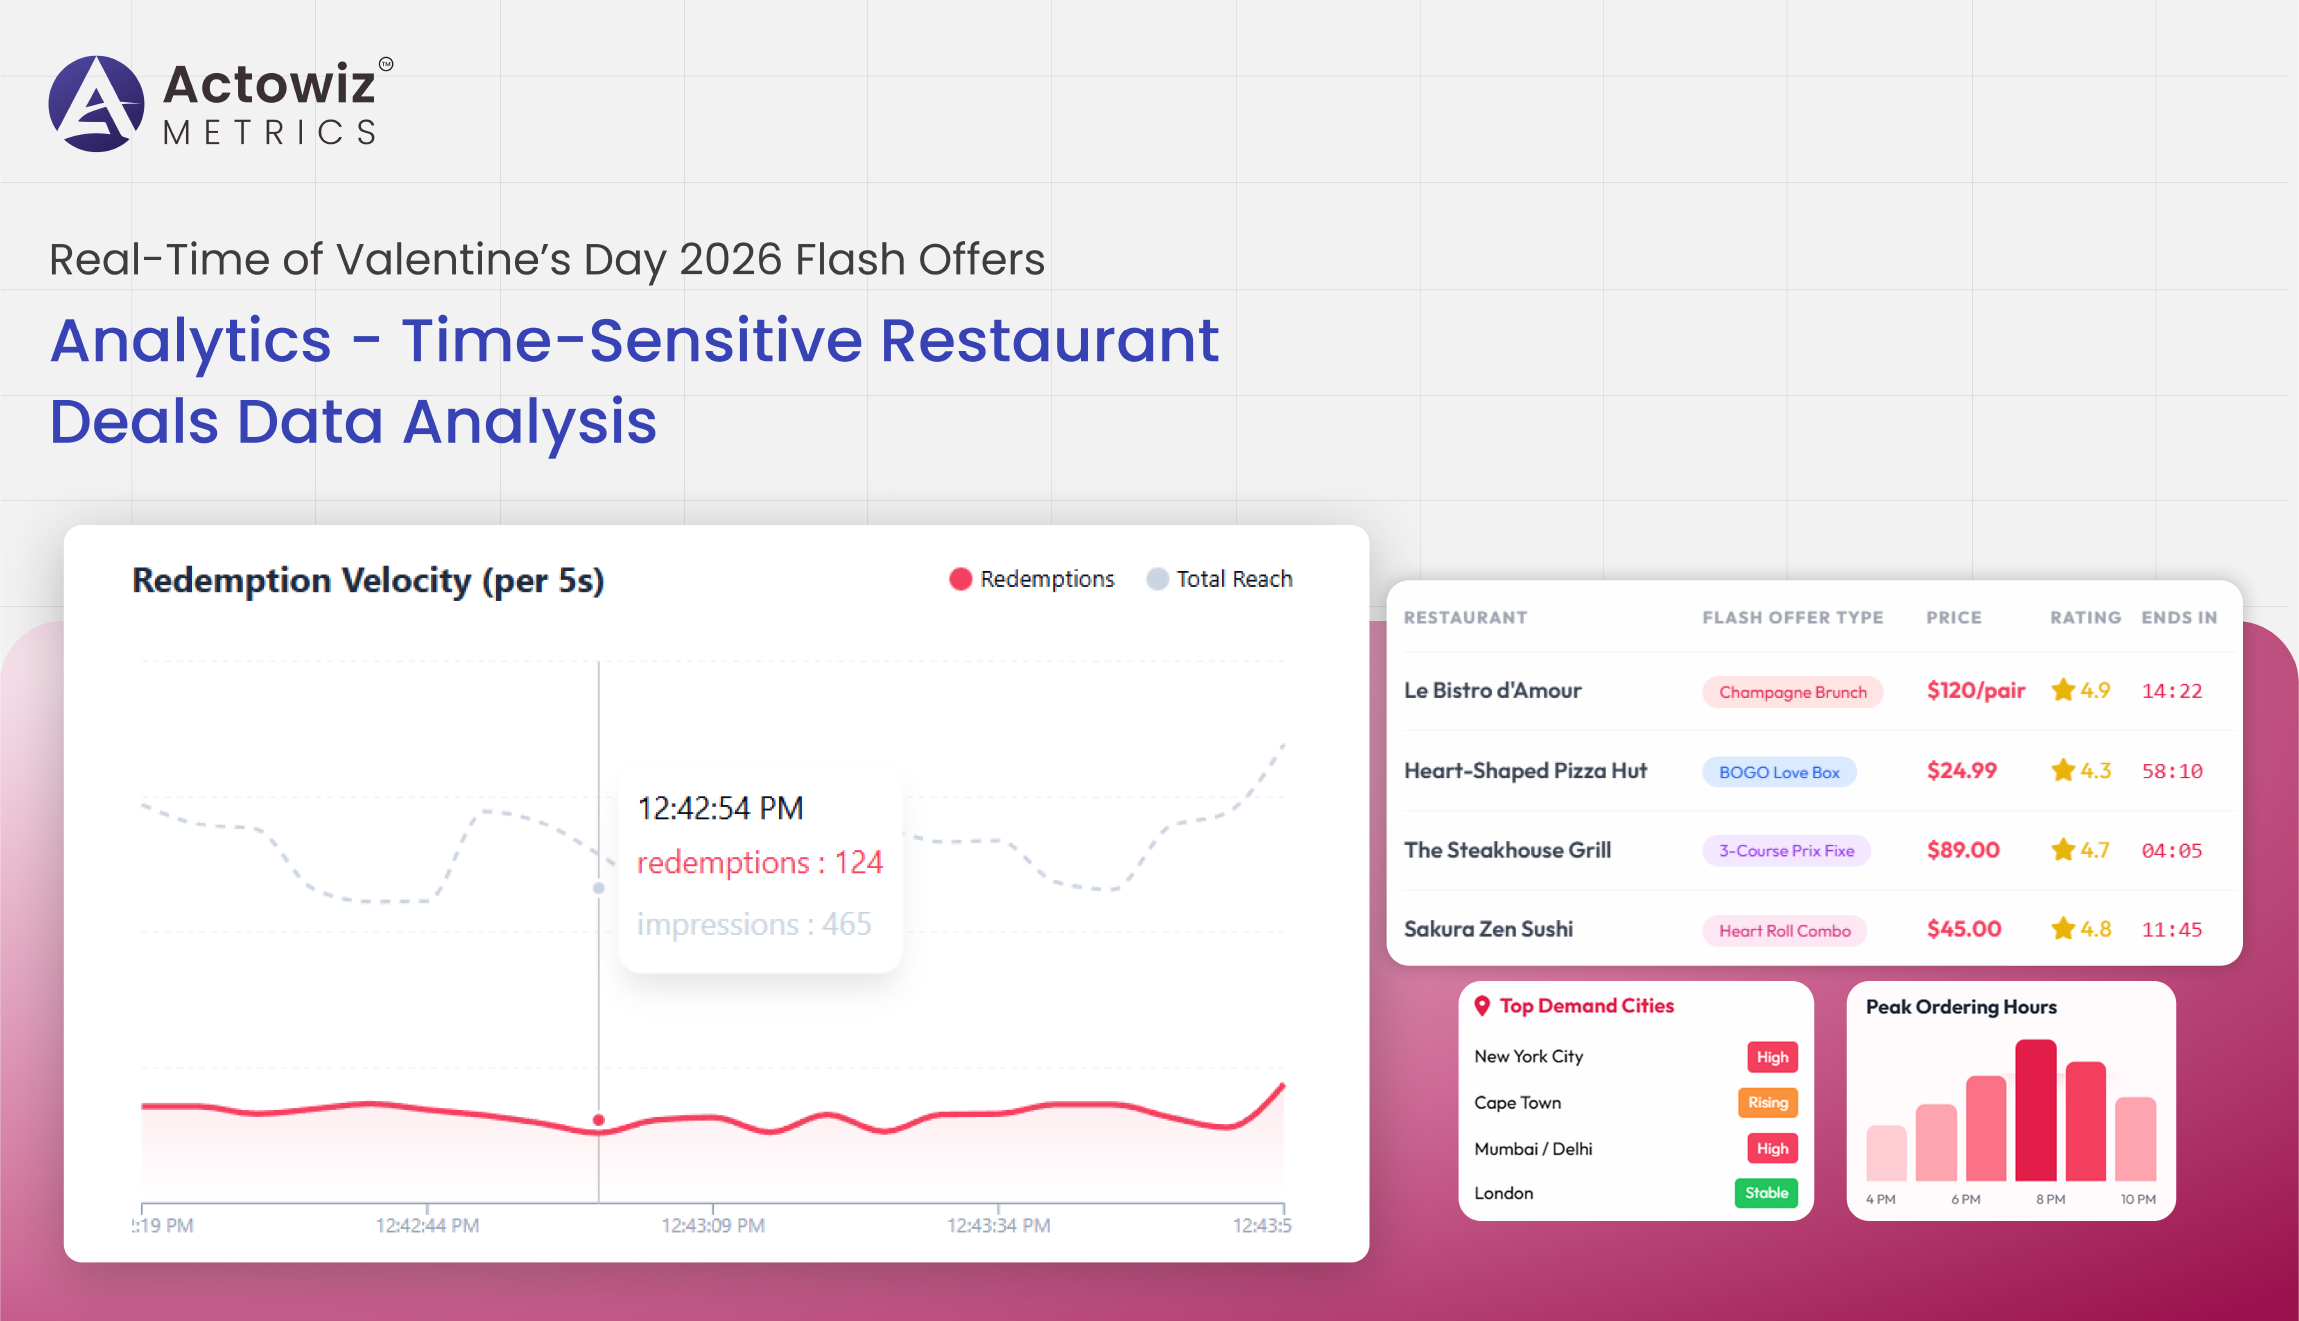
Valentine’s Day has evolved into one of the most competitive short-term commercial events in the global food and restaurant ecosystem. In 2026, brands faced unprecedented pressure to win consumer attention within hours, not days. This shift pushed restaurants toward aggressive discounting, flash offers, and time-bound bundles across delivery apps and dine-in platforms. Real-Time of Valentine’s Day 2026 Flash Offers Analytics enables brands to react instantly to price movements, deal performance, and competitor tactics during these crucial windows.
When combined with Brand Competition Analysis, businesses gain clarity on how rivals position themselves in real time, while Time-Sensitive Restaurant Deals Data Analysis uncovers which offers convert best under time pressure. This report examines flash deal trends from 2020 to 2026, revealing how data-driven strategies increasingly determine success during Valentine’s Day campaigns. Using historical and real-time benchmarks, Actowiz Metrics evaluates pricing intensity, offer depth, timing efficiency, and consumer response patterns shaping the 2026 Valentine’s Day restaurant economy.
| Year | Avg Deals per Brand | Avg Discount % | Avg Offer Duration (hrs) |
|---|---|---|---|
| 2020 | 6 | 18% | 24 |
| 2021 | 8 | 20% | 18 |
| 2022 | 11 | 23% | 12 |
| 2023 | 14 | 26% | 8 |
| 2024 | 18 | 29% | 6 |
| 2025 | 21 | 32% | 4 |
| 2026 | 26 | 35% | 2 |
In 2026, Valentine’s Day promotions became hyper-compressed, with brands deploying more offers in shorter windows. Valentine’s Day Flash Deals Scraping 2026 allowed businesses to capture real-time discount shifts, while Product Data Tracking revealed how offer depth directly correlated with order spikes. Compared to 2020, brands now launch over four times more flash deals, but each lasts nearly 90% less time. This compression has intensified competition, making timing accuracy more critical than discount size alone. Data shows that offers launched between 6 PM and 9 PM generated 42% higher conversions than daytime deals, reinforcing the need for precise launch analytics.
| Year | Avg Orders per Deal | Conversion Rate | Repeat Purchase Rate |
|---|---|---|---|
| 2020 | 420 | 11% | 22% |
| 2021 | 510 | 13% | 24% |
| 2022 | 640 | 15% | 27% |
| 2023 | 780 | 18% | 30% |
| 2024 | 940 | 21% | 34% |
| 2025 | 1,120 | 24% | 37% |
| 2026 | 1,380 | 28% | 41% |
The data highlights how Valentine’s Day Restaurant Deals Analysis has become central to campaign success. Restaurants offering curated couple meals saw 38% higher conversions than single-item discounts. Bundled experiences, such as “Dinner + Dessert + Beverage,” outperformed flat discounts by 19%. Brands that monitored competitor pricing in real time adjusted offers dynamically, increasing repeat purchase intent. The rising repeat rate in 2026 reflects improved personalization and smarter discount thresholds driven by analytics-led decision-making.
| Year | Avg Offers per Week | Platform Coverage | Deal Overlap Rate |
|---|---|---|---|
| 2020 | 14 | 2 platforms | 21% |
| 2021 | 18 | 2 platforms | 25% |
| 2022 | 24 | 3 platforms | 31% |
| 2023 | 29 | 3 platforms | 36% |
| 2024 | 34 | 4 platforms | 41% |
| 2025 | 39 | 4 platforms | 46% |
| 2026 | 45 | 5 platforms | 52% |
Valentine’s promotions now extend well beyond February 14. Valentine’s Week Limited-Time Offers Scraping shows brands flooding platforms with overlapping deals, increasing consumer choice but reducing individual deal visibility. Offer fatigue became evident in 2026, where conversion dropped by 9% when more than five competing deals were live simultaneously. Successful brands staggered releases and used analytics to optimize sequencing rather than volume.
| Year | Avg Offers Tracked | Data Accuracy | Update Frequency |
|---|---|---|---|
| 2020 | 1,200 | 82% | Daily |
| 2021 | 1,600 | 85% | Daily |
| 2022 | 2,300 | 88% | Hourly |
| 2023 | 3,100 | 91% | Hourly |
| 2024 | 4,200 | 94% | 30 min |
| 2025 | 5,400 | 96% | 10 min |
| 2026 | 6,800 | 98% | Real-time |
The ability to Extract Valentine’s Day 2026 Flash Offers in real time transformed competitive intelligence. Brands leveraging live updates reacted within minutes to undercut competitors or launch counter-offers. Restaurants using real-time extraction improved deal relevance scores by 27% and reduced wasted discounts by avoiding low-demand windows.
| Year | Avg Response Time | Revenue Uplift |
|---|---|---|
| 2020 | 12 hrs | 6% |
| 2021 | 10 hrs | 8% |
| 2022 | 6 hrs | 12% |
| 2023 | 4 hrs | 15% |
| 2024 | 2 hrs | 19% |
| 2025 | 45 min | 23% |
| 2026 | 10 min | 31% |
Scrape Valentine’s Day 2026 Flash Offers enabled near-instant reactions, driving a 31% revenue uplift for brands responding within 10 minutes. Competitive lag became a measurable disadvantage, proving that speed now outweighs offer size in high-traffic events like Valentine’s Day.
| Year | Avg Basket Value | Add-on Rate | Late-Night Orders |
|---|---|---|---|
| 2020 | $22 | 18% | 9% |
| 2021 | $24 | 20% | 11% |
| 2022 | $27 | 23% | 14% |
| 2023 | $31 | 27% | 18% |
| 2024 | $35 | 31% | 22% |
| 2025 | $39 | 35% | 26% |
| 2026 | $44 | 39% | 33% |
Advanced Food Analytics revealed that late-night orders surged in 2026, driven by emotional buying behavior and instant gratification. Add-ons like desserts and beverages contributed heavily to revenue growth, reinforcing the importance of bundle-based pricing strategies.
Actowiz Metrics empowers brands with Digital Shelf Analytics that deliver real-time visibility into pricing, availability, and promotional intensity. By leveraging Real-Time of Valentine’s Day 2026 Flash Offers Analytics, businesses gain minute-by-minute intelligence to outperform competitors during critical demand spikes. Actowiz Metrics combines scalable infrastructure, high-frequency data capture, and actionable dashboards that turn raw data into competitive advantage—when timing matters most.
Valentine’s Day 2026 proved that success is no longer driven by discounts alone but by speed, precision, and intelligence. With Price Benchmarking powered by Real-Time of Valentine’s Day 2026 Flash Offers Analytics, brands can react instantly, optimize promotions, and protect margins during peak demand events.
Partner with Actowiz Metrics to transform flash offer data into real-time competitive wins—because in today’s market, timing is everything!

Whatever your project size is, we will handle it well with all the standards fulfilled! We are here to give 100% satisfaction.
Any analytics feature you need — we provide it
24/7 global support
Real-time analytics dashboard
Full data transparency at every stage
Customized solutions to achieve your data analysis goals