Create your own


The US pharmacy industry has undergone a major transformation between 2020 and 2026, driven by digital adoption, retail consolidation, and increasing demand for healthcare accessibility. With the rise of omnichannel pharmacy models, organizations are now relying heavily on data-driven intelligence to remain competitive.
In this evolving ecosystem, US Pharmacy Market Data Analytics plays a critical role in helping stakeholders understand pricing trends, store performance, and regional healthcare demand patterns. At the same time, E-commerce Analytics is reshaping how pharmacy chains and healthcare retailers optimize their online and offline operations, ensuring better patient engagement and operational efficiency.
The market is also influenced by large pharmacy giants expanding their footprint across urban and rural regions, making competitive intelligence essential. This is where Giants, Growth & Geography analysis becomes crucial, enabling businesses to track expansion strategies, market penetration, and regional performance disparities.
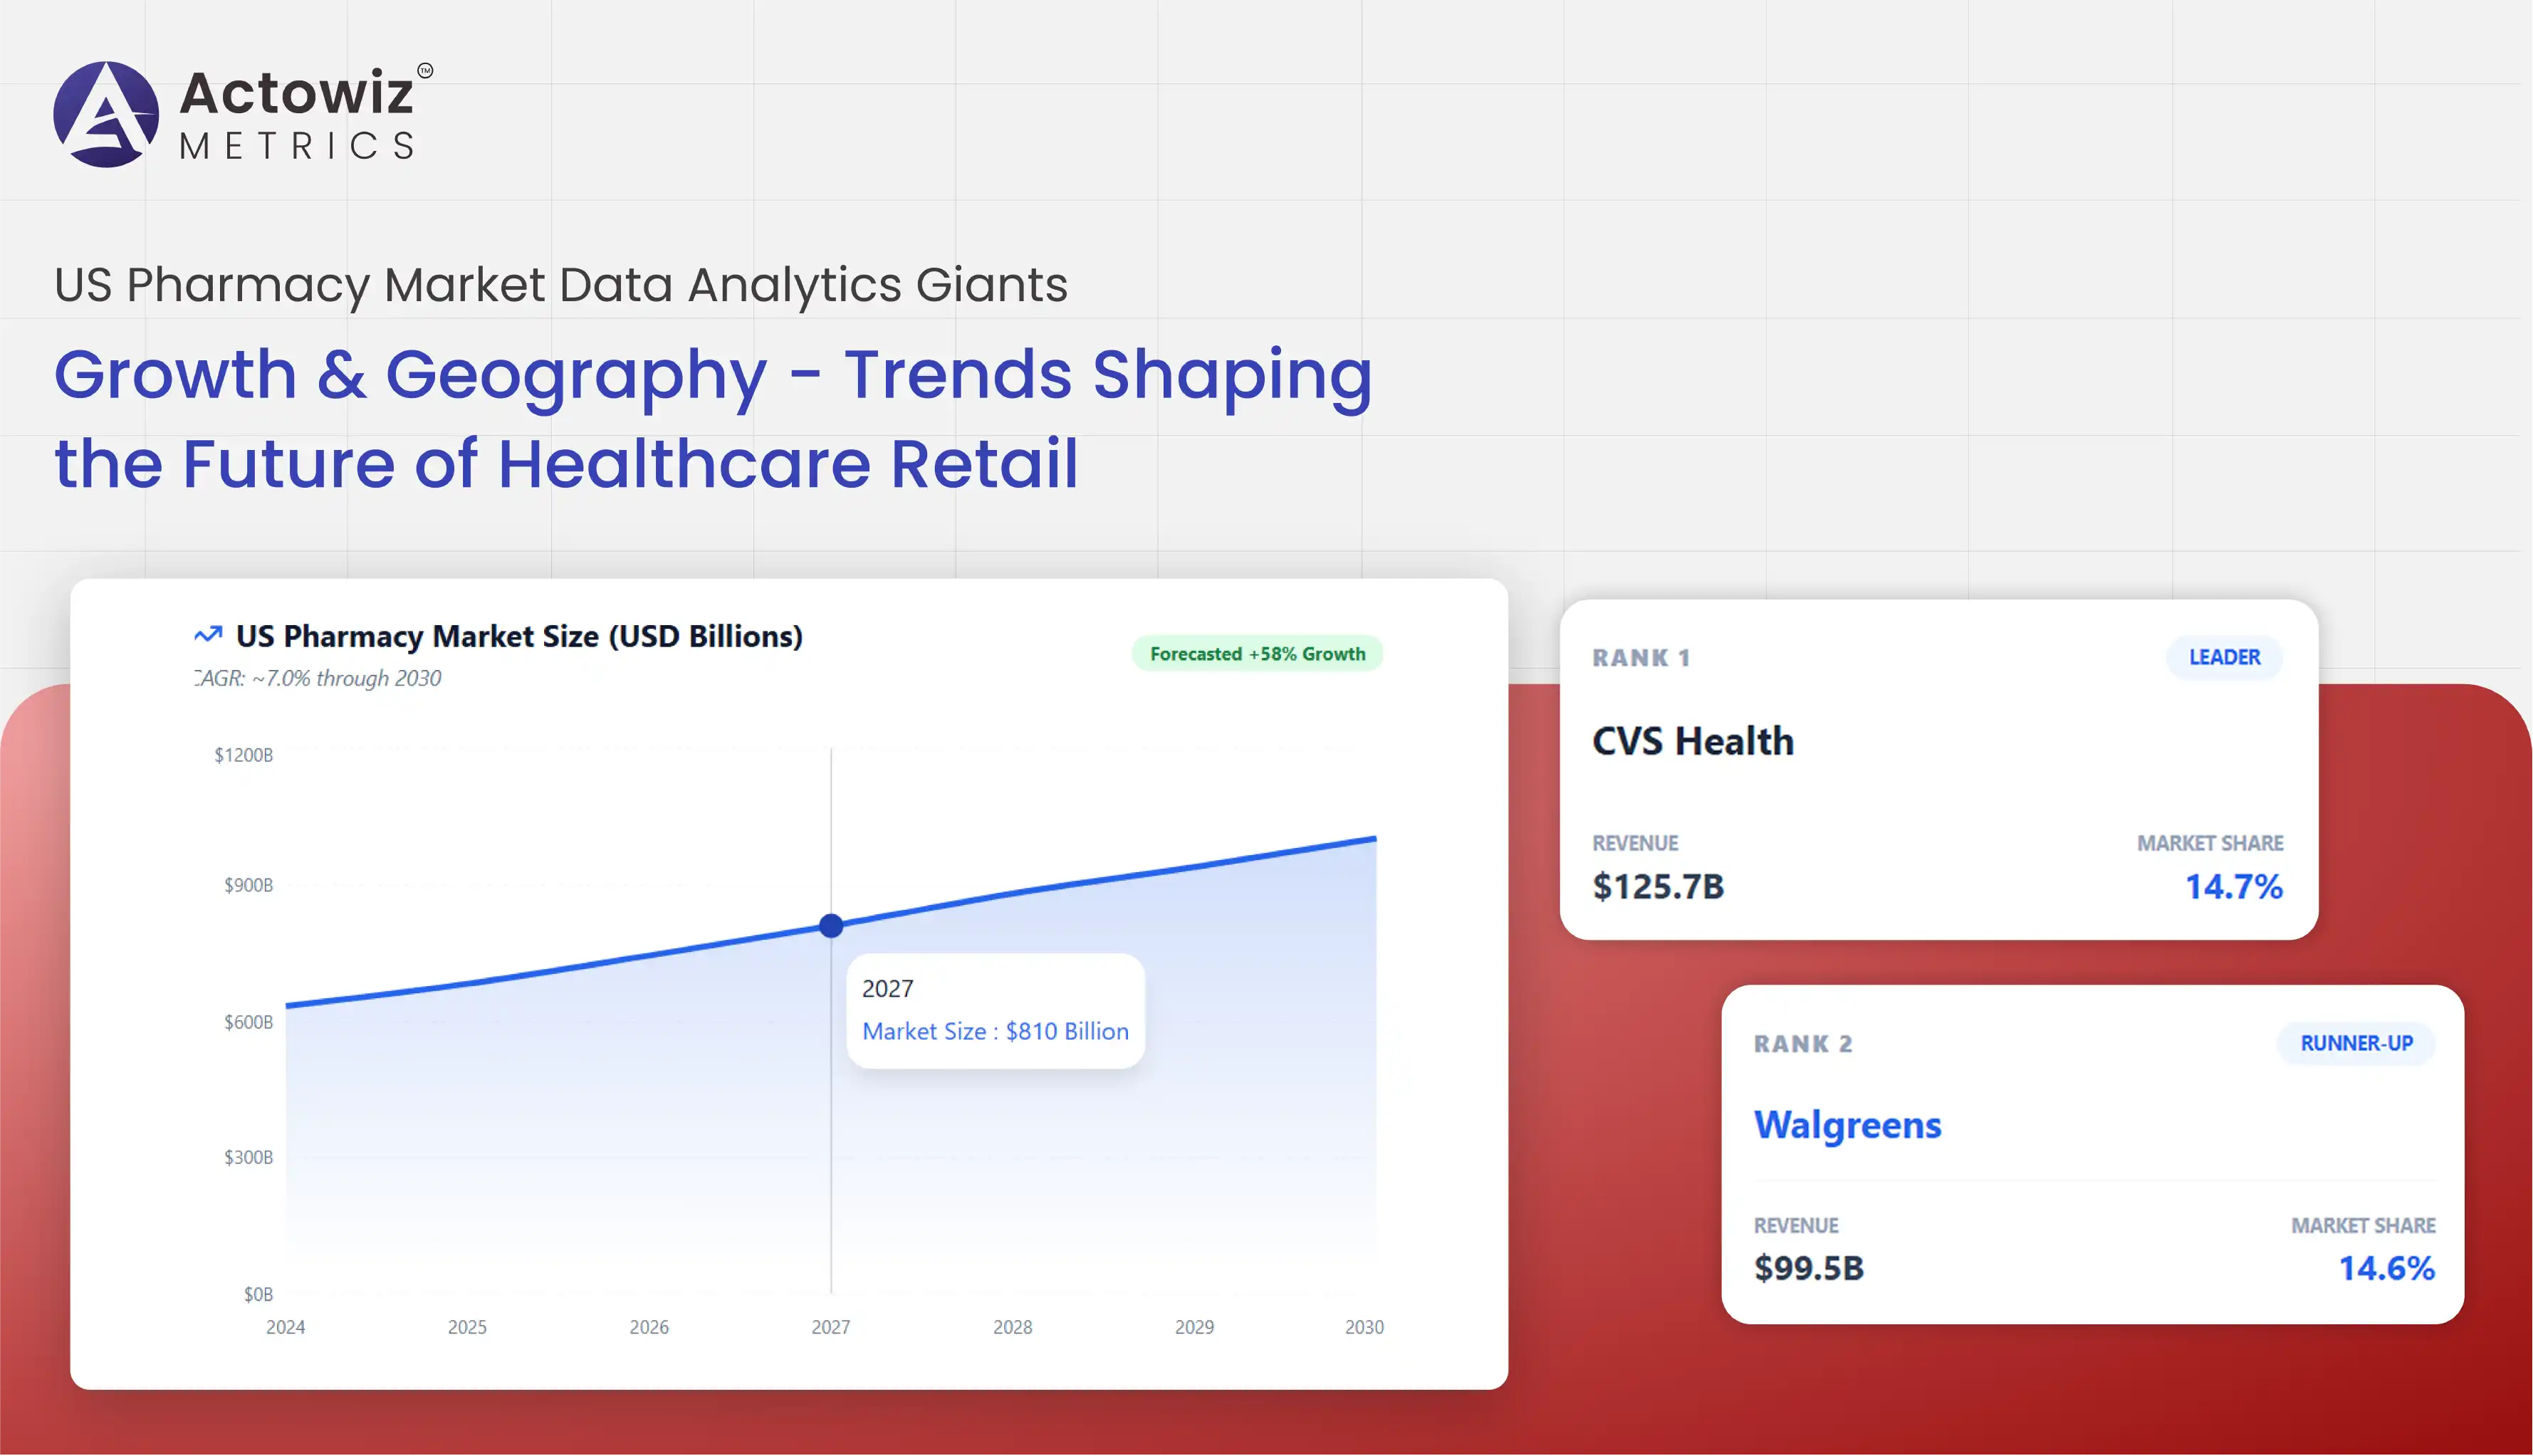
From 2020 to 2026, the US pharmacy market has grown from approximately $550 billion to over $780 billion, driven by prescription demand, telehealth adoption, and retail pharmacy expansion. Companies using structured data analytics have reported up to 40% improvement in demand forecasting accuracy and 30% better inventory optimization. This report explores how advanced data intelligence is reshaping pharmacy market dynamics.
The US pharmacy market is dominated by a few large players controlling a significant share of prescription fulfillment and retail distribution. Consolidation trends have increased sharply over the past decade, with major chains acquiring smaller regional pharmacies to strengthen their market position.
| Year | Top 5 Pharmacy Chains Market Share | Independent Pharmacies Share |
|---|---|---|
| 2020 | 62% | 38% |
| 2022 | 68% | 32% |
| 2024 | 73% | 27% |
| 2026 | 78% | 22% |
Through US Pharmacy Market Data Scraping, organizations can track competitor pricing, prescription availability, and store performance in real time. This enables stronger Brand Competition Analysis, helping businesses identify gaps in service delivery and regional dominance.
Between 2020 and 2026, pharmacy chains increased automation investments by over 55%, focusing on digital prescription management and AI-driven supply chain systems. Competitive intelligence has become essential for survival in this highly regulated and fast-evolving industry.
Modern pharmacies depend on structured data systems to monitor product availability, prescription fulfillment rates, and customer behavior. Pharmacy Market Data Extraction USA enables organizations to collect structured datasets across thousands of pharmacy locations nationwide.
| Metric | 2020 | 2023 | 2026 |
|---|---|---|---|
| Prescription Fill Rate | 85% | 90% | 94% |
| Inventory Accuracy | 70% | 82% | 93% |
| Digital Adoption Rate | 45% | 68% | 88% |
Product Data Tracking has become essential for monitoring drug availability and ensuring compliance with healthcare regulations.
Between 2020 and 2026, pharmacies using advanced tracking systems reduced stockouts by 35% and improved prescription turnaround time by 28%.
The integration of automated extraction tools has also enabled better forecasting of seasonal demand spikes, especially for flu medications and chronic disease prescriptions.
Location-based intelligence plays a crucial role in optimizing pharmacy operations across the United States. USA Healthcare Data Scraper For Pharmacies enables organizations to analyze store density, prescription demand, and regional healthcare accessibility patterns.
| Region | Pharmacy Density Growth (2020–2026) | Prescription Demand Growth |
|---|---|---|
| Northeast | 12% | 18% |
| Midwest | 9% | 22% |
| South | 15% | 28% |
| West | 18% | 30% |
With Map Monitoring, pharmacy chains can visualize coverage gaps, identify underserved regions, and optimize store expansion strategies. Between 2020 and 2026, rural pharmacy expansion increased by 25% due to telehealth integration and government healthcare initiatives.
Geographic analytics ensures better distribution planning, reducing delivery delays and improving patient access to essential medications.
Understanding store-level performance is critical for evaluating operational efficiency and customer satisfaction. Extract Pharmacy Store Data For Market Research USA enables businesses to gather insights on store traffic, prescription fulfillment, and service performance.
Between 2020 and 2026, digital transformation in pharmacies led to:
Pharmacy chains are increasingly investing in AI-based analytics tools to optimize workforce allocation and reduce operational costs. Market research powered by structured data extraction allows organizations to identify high-performing locations and replicate successful strategies across regions.
The US pharmacy sector has experienced steady expansion driven by aging populations, chronic disease prevalence, and increasing healthcare accessibility. Pharmacy Market Growth Analysis USA highlights the structural shifts shaping industry performance.
| Year | Total Pharmacy Market Size | Growth Rate |
|---|---|---|
| 2020 | $550B | 6.5% |
| 2022 | $620B | 7.2% |
| 2024 | $700B | 7.8% |
| 2026 | $780B | 8.1% |
Growth is heavily influenced by prescription drug demand, specialty pharmacy expansion, and retail consolidation. Between 2020 and 2026, specialty drug spending increased by over 60%, becoming one of the fastest-growing segments in healthcare retail.
Data analytics helps stakeholders identify emerging opportunities in chronic care management and personalized medicine distribution.
Healthcare retail is increasingly dependent on advanced analytics systems to drive operational efficiency and strategic decision-making. Healthcare Data Intelligence Solutions USA enable organizations to integrate structured datasets from multiple pharmacy networks into unified dashboards.
Between 2020 and 2026, adoption of healthcare intelligence platforms increased by 70%, enabling:
Pharmacy chains leveraging data intelligence report up to 38% improvement in operational efficiency and 27% reduction in supply chain costs. These systems also enhance patient experience by ensuring medication availability and faster service delivery.
Modern pharmacy analytics requires scalable, accurate, and real-time intelligence systems. Digital Shelf Analytics ensures visibility into product availability, pricing, and competitive positioning across pharmacy networks.
US Pharmacy Market Data Analytics powered solutions from Actowiz Metrics help organizations transform raw healthcare data into actionable insights for better decision-making.
Actowiz Metrics delivers:
These capabilities empower healthcare organizations to stay ahead in a rapidly evolving retail pharmacy ecosystem.
The US pharmacy industry is undergoing a major data-driven transformation, with analytics becoming central to competitive advantage. Companies that adopt advanced intelligence systems can better understand market dynamics, optimize operations, and improve patient outcomes.
Price Benchmarking plays a crucial role in ensuring competitive pricing strategies across pharmacy networks while maintaining profitability and compliance.
US Pharmacy Market Data Analytics enables organizations to navigate complex healthcare retail environments with precision and confidence.
With Actowiz Metrics, businesses can unlock deep insights into pharmacy operations, competitive landscapes, and regional growth opportunities, ensuring long-term success in the evolving healthcare ecosystem.
Partner with Actowiz Metrics today and transform your pharmacy market intelligence into measurable growth and strategic advantage!

Whatever your project size is, we will handle it well with all the standards fulfilled! We are here to give 100% satisfaction.
Any analytics feature you need — we provide it
24/7 global support
Real-time analytics dashboard
Full data transparency at every stage
Customized solutions to achieve your data analysis goals