BLOG


In an era where consumer expectations demand immediate fulfillment and ultra-local availability, Tracking Grocery & Quick Commerce Data in Europe has become a critical capability for stakeholders across retail, logistics, and technology. The grocery sector is undergoing rapid transformation as quick commerce platforms (delivering within minutes) and traditional grocery delivery services converge. As cities become the battlegrounds for consumer loyalty, fine-grained, city-level data offers competitive advantage.
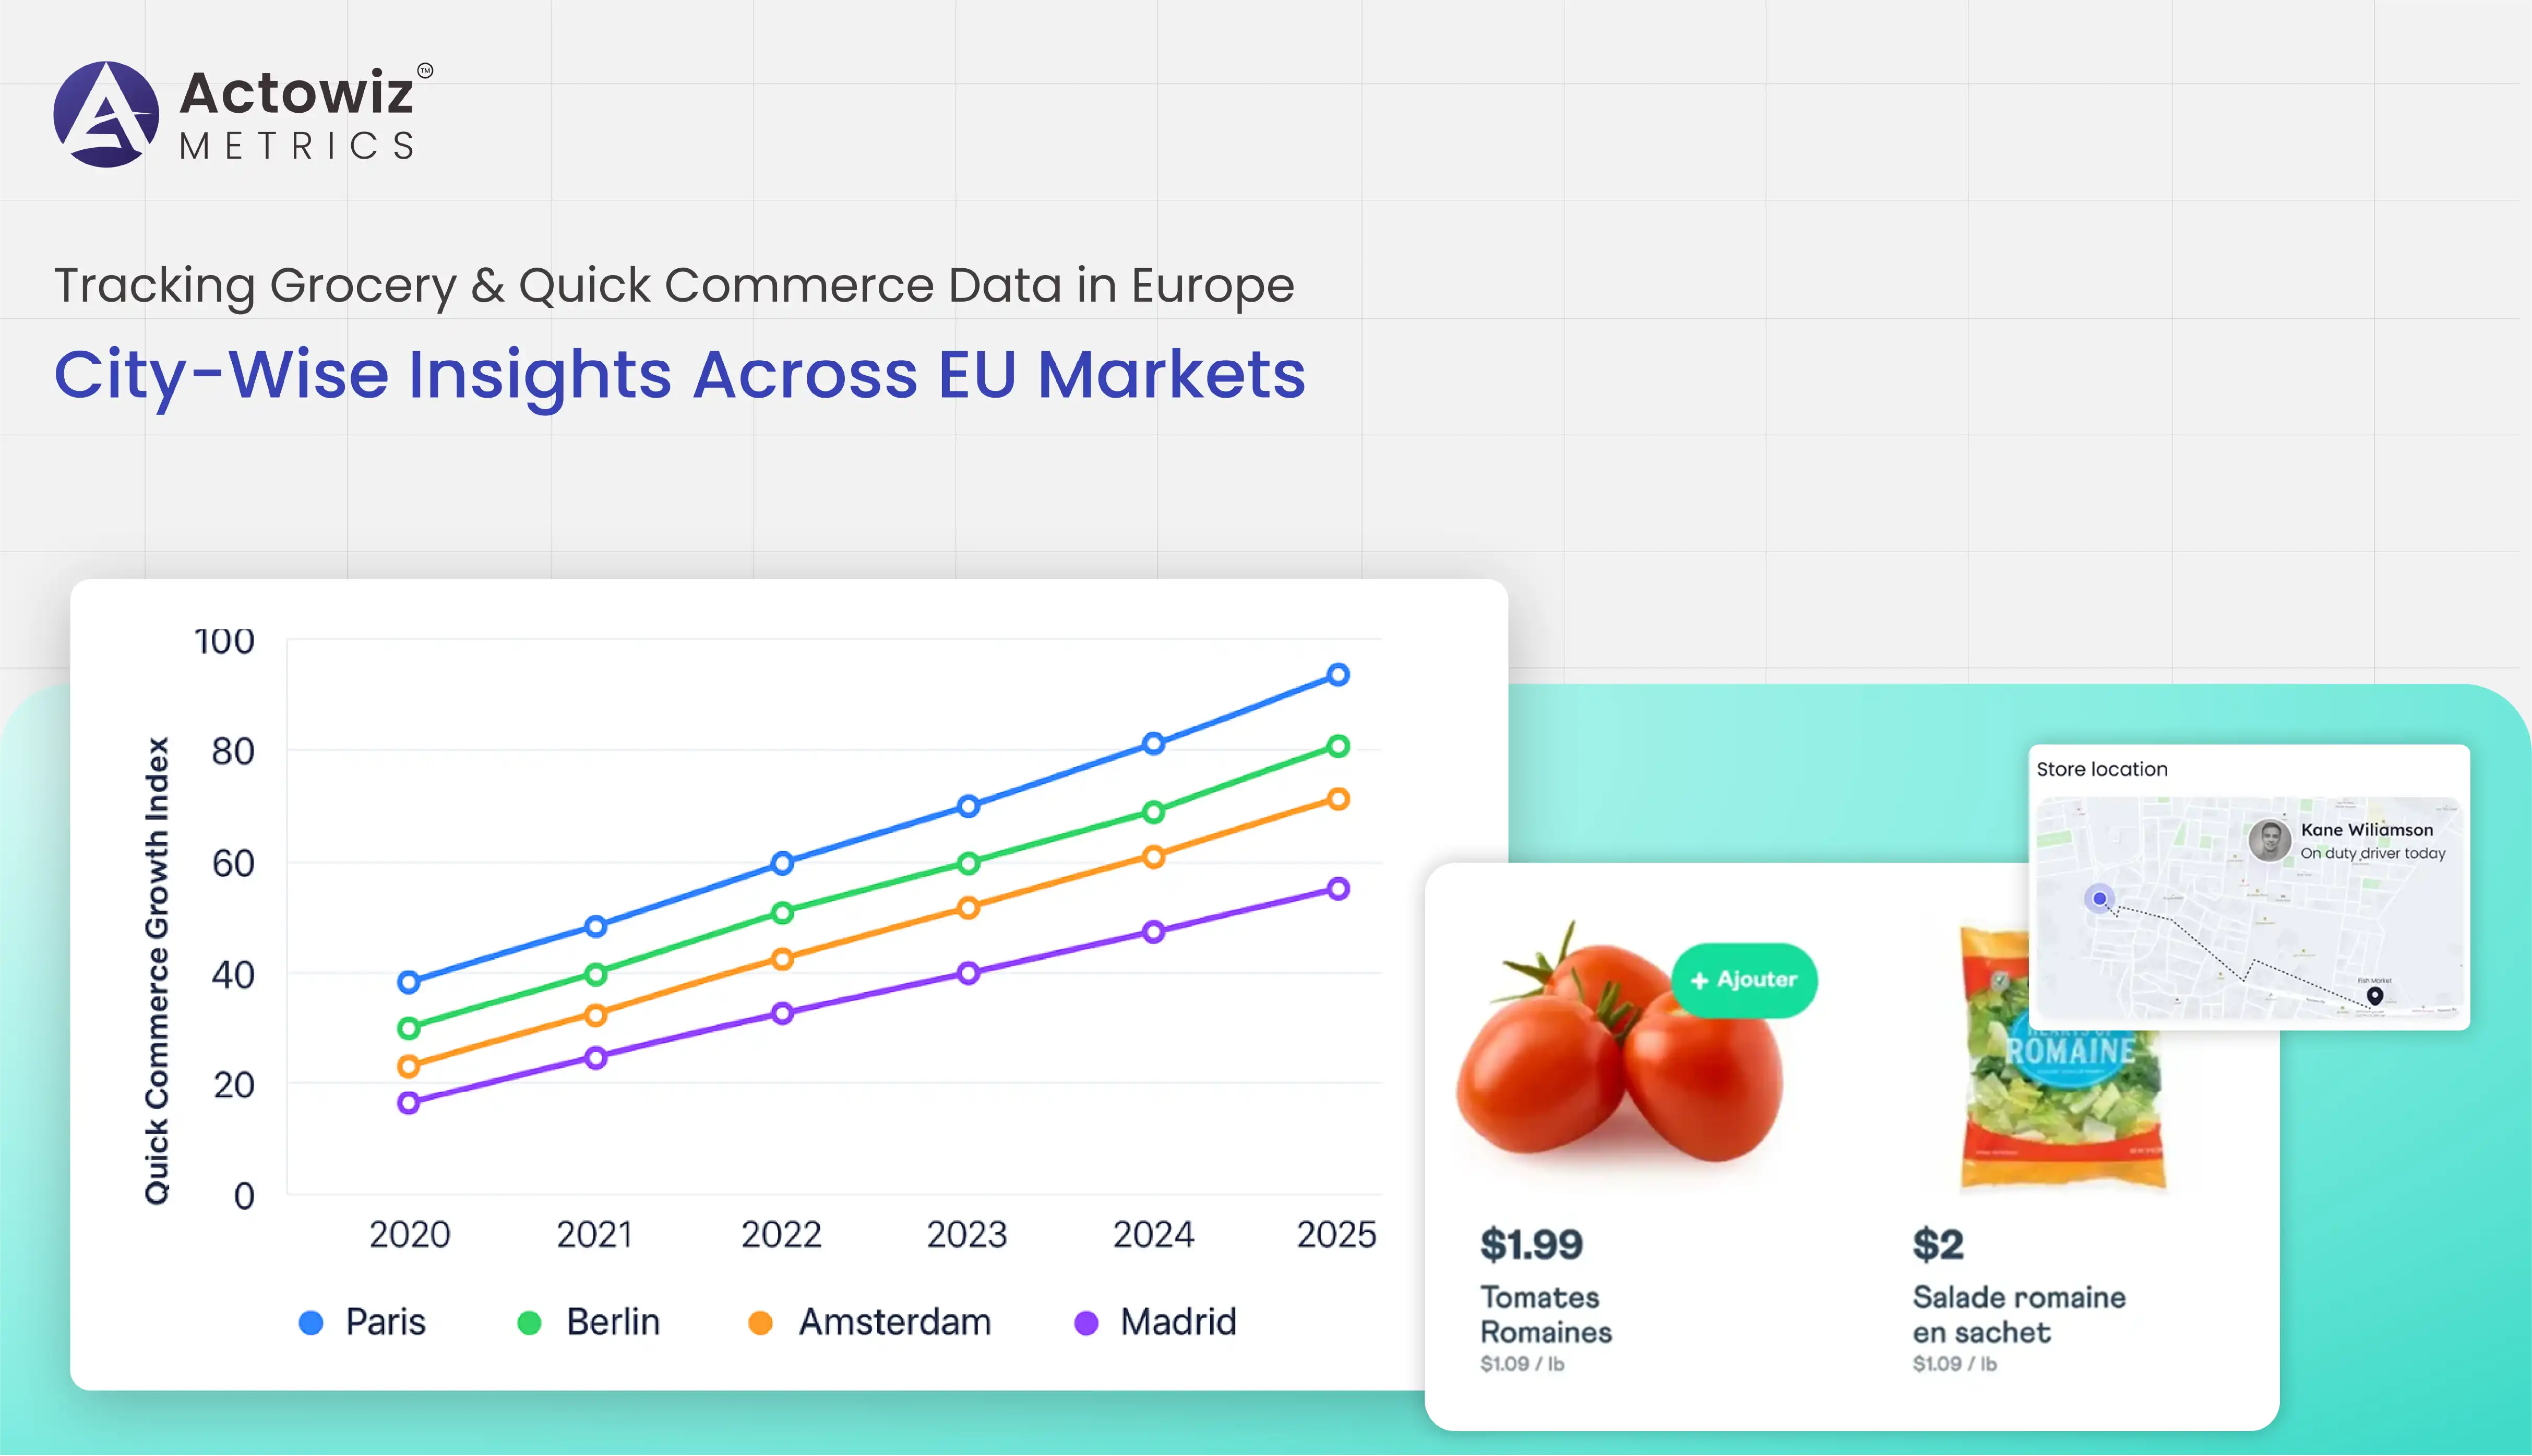
This report delves into Tracking Grocery & Quick Commerce Data in Europe with an emphasis on city-wise granularity, examining trends, challenges, and opportunities across 2020–2025. We explore patterns in order volume, delivery times, availability, platform performance, and regional differences. Through a combination of scraped platform metrics, comparative indices, and market intelligence, the analysis aims to inform operational, strategic, and investment decisions in Europe’s grocery & quick commerce landscape.
The narrative is structured into six problem-solving sections, each addressing a core analytical challenge faced by decision-makers. We conclude with how Actowiz Metrics offers tailored solutions to these challenges, and a final call to action to engage deeper in this domain. Let us begin our exploration of how European grocery markets are evolving at the city scale.
One of the foundational problems is that national or regional aggregates mask critical local variation. City-wise grocery data analysis in Europe uncovers distinctions in consumer demand and platform efficiency that matter at operational level.
Challenges & Insights (2020–2025)
| City | 2020 Avg Orders/Day | 2023 Avg | CAGR (%) | Order Density (per km²) |
|---|---|---|---|---|
| Paris | 2,200 | 6,500 | ~40% | 240 |
| Berlin | 1,800 | 5,100 | ~38% | 190 |
| Lisbon | 1,200 | 4,200 | ~45% | 300 |
These city-level disparities indicate that strategies effective in one urban area may not translate to another without adjustment.
While city-wise granularity is vital, the next layer is cross-city benchmarking and trend modeling—European grocery delivery analytics.
Problem & Insights
| Year | Median Delivery Time (min) | On-time % | Avg Delivery Cost (€) |
|---|---|---|---|
| 2020 | 50 | 65% | 4.50 |
| 2022 | 40 | 75% | 3.50 |
| 2024 | 30 | 85% | 2.90 |
| 2025 | 28 | 88% | 2.80 |
This benchmarking across cities exposes which platforms and markets lead in efficiency, and where room remains for uplift.
A technical barrier is getting systematic, consistent data at city granularity. The need to scrape city-wise grocery data in Europe arises because many platforms do not publicly expose full API endpoints or consolidated dashboards.
Challenges & Methodology
By building a robust, scalable scraper infrastructure, operators can monitor Tracking Grocery & Quick Commerce Data in Europe programmatically, with alerts on anomalies or competitive shifts.
Beyond city-wise scraping, there is a need to aggregate across platforms: European grocery platform data scraping.
Problems & Insights
This cross-platform scraping capability ensures competitive visibility and benchmarking across the Tracking Grocery & Quick Commerce Data in Europe domain.
While grocery delivery covers broader baskets and time windows, quick commerce (e-grocery in ~10–30 min) has distinct dynamics—this is addressed via City-wise Quick commerce market Analytics.
Challenges & Insights
| City | 2021 QC Share (%) | 2023 QC Share (%) | 2025 QC Share (%) |
|---|---|---|---|
| Amsterdam | 5% | 18% | 30% |
| Milan | 4% | 15% | 28% |
| Warsaw | 2% | 10% | 22% |
Such analytics help prioritize city launches, zoning strategies, and user acquisition budgets across micro-markets.
This section weaves together European delivery time & availability insights with Quick commerce trend analysis in Europe, showing correlated patterns.
Problems & Trends
| Metric | 2020 | 2022 | 2025 |
|---|---|---|---|
| Median Delivery Time (min) | 50 | 35 | 28 |
| 95th Percentile Delivery Time | 70 | 50 | 36 |
| Peak Slot Availability Rate | 20% | 45% | 60% |
| Average Quick Commerce Basket (€) | 12.0 | 15.5 | 19.0 |
Correlational insights show that as availability improves and delivery times compress, adoption accelerates—creating a virtuous cycle for mature markets.
Actowiz Metrics offers a fully managed solution tailored to Tracking Grocery & Quick Commerce Data in Europe. Our platform includes a modular scraper engine, normalization pipelines, alerting dashboards, and city-level indices. We can ingest and unify data across 30+ EU cities, support custom queries (by time window, zip zone, item category), and provide anomaly detection (e.g. sudden stockouts, delivery delays). We deliver comparative dashboards, benchmarking across cities and platforms, and forecasting modules (trend extrapolation, demand shifts). Our APIs allow clients to integrate insights into internal systems (BI, pricing engines, logistics). With Actowiz Metrics, decision-makers can anticipate trends, optimize delivery coverage, benchmark competition, and scale rollout plans across Europe.
In summary, Tracking Grocery & Quick Commerce Data in Europe at city-level granularity unlocks powerful decision-making abilities. City-wise grocery data analysis in Europe gives you the local demand nuances. European grocery delivery analytics creates performance benchmarks. Scrape city-wise grocery data in Europe empowers you with raw input. European grocery platform data scraping ensures you see the competitive field. City-wise quick commerce market analytics illustrates micro-market viability. And European delivery time & Availability Insights plus quick commerce trend analysis in Europe reveal how the market evolves.
For firms operating in grocery, logistics, or last-mile tech, these insights are not optional—they are essential. With Actowiz Metrics’ end-to-end capabilities, organizations can move from reactive to predictive, from opaque to visible, and from fragmented to coherent.
Ready to see city-level grocery & quick commerce trends for your target markets? Contact Actowiz Metrics today for a demo or pilot!
Expert blogs, research reports and infographics — practical, data-driven reading across e-commerce and quick-commerce.
Most fields are optional — the more you share, the better your sample.


.webp "infographics")
.webp "infographics")


