BLOG


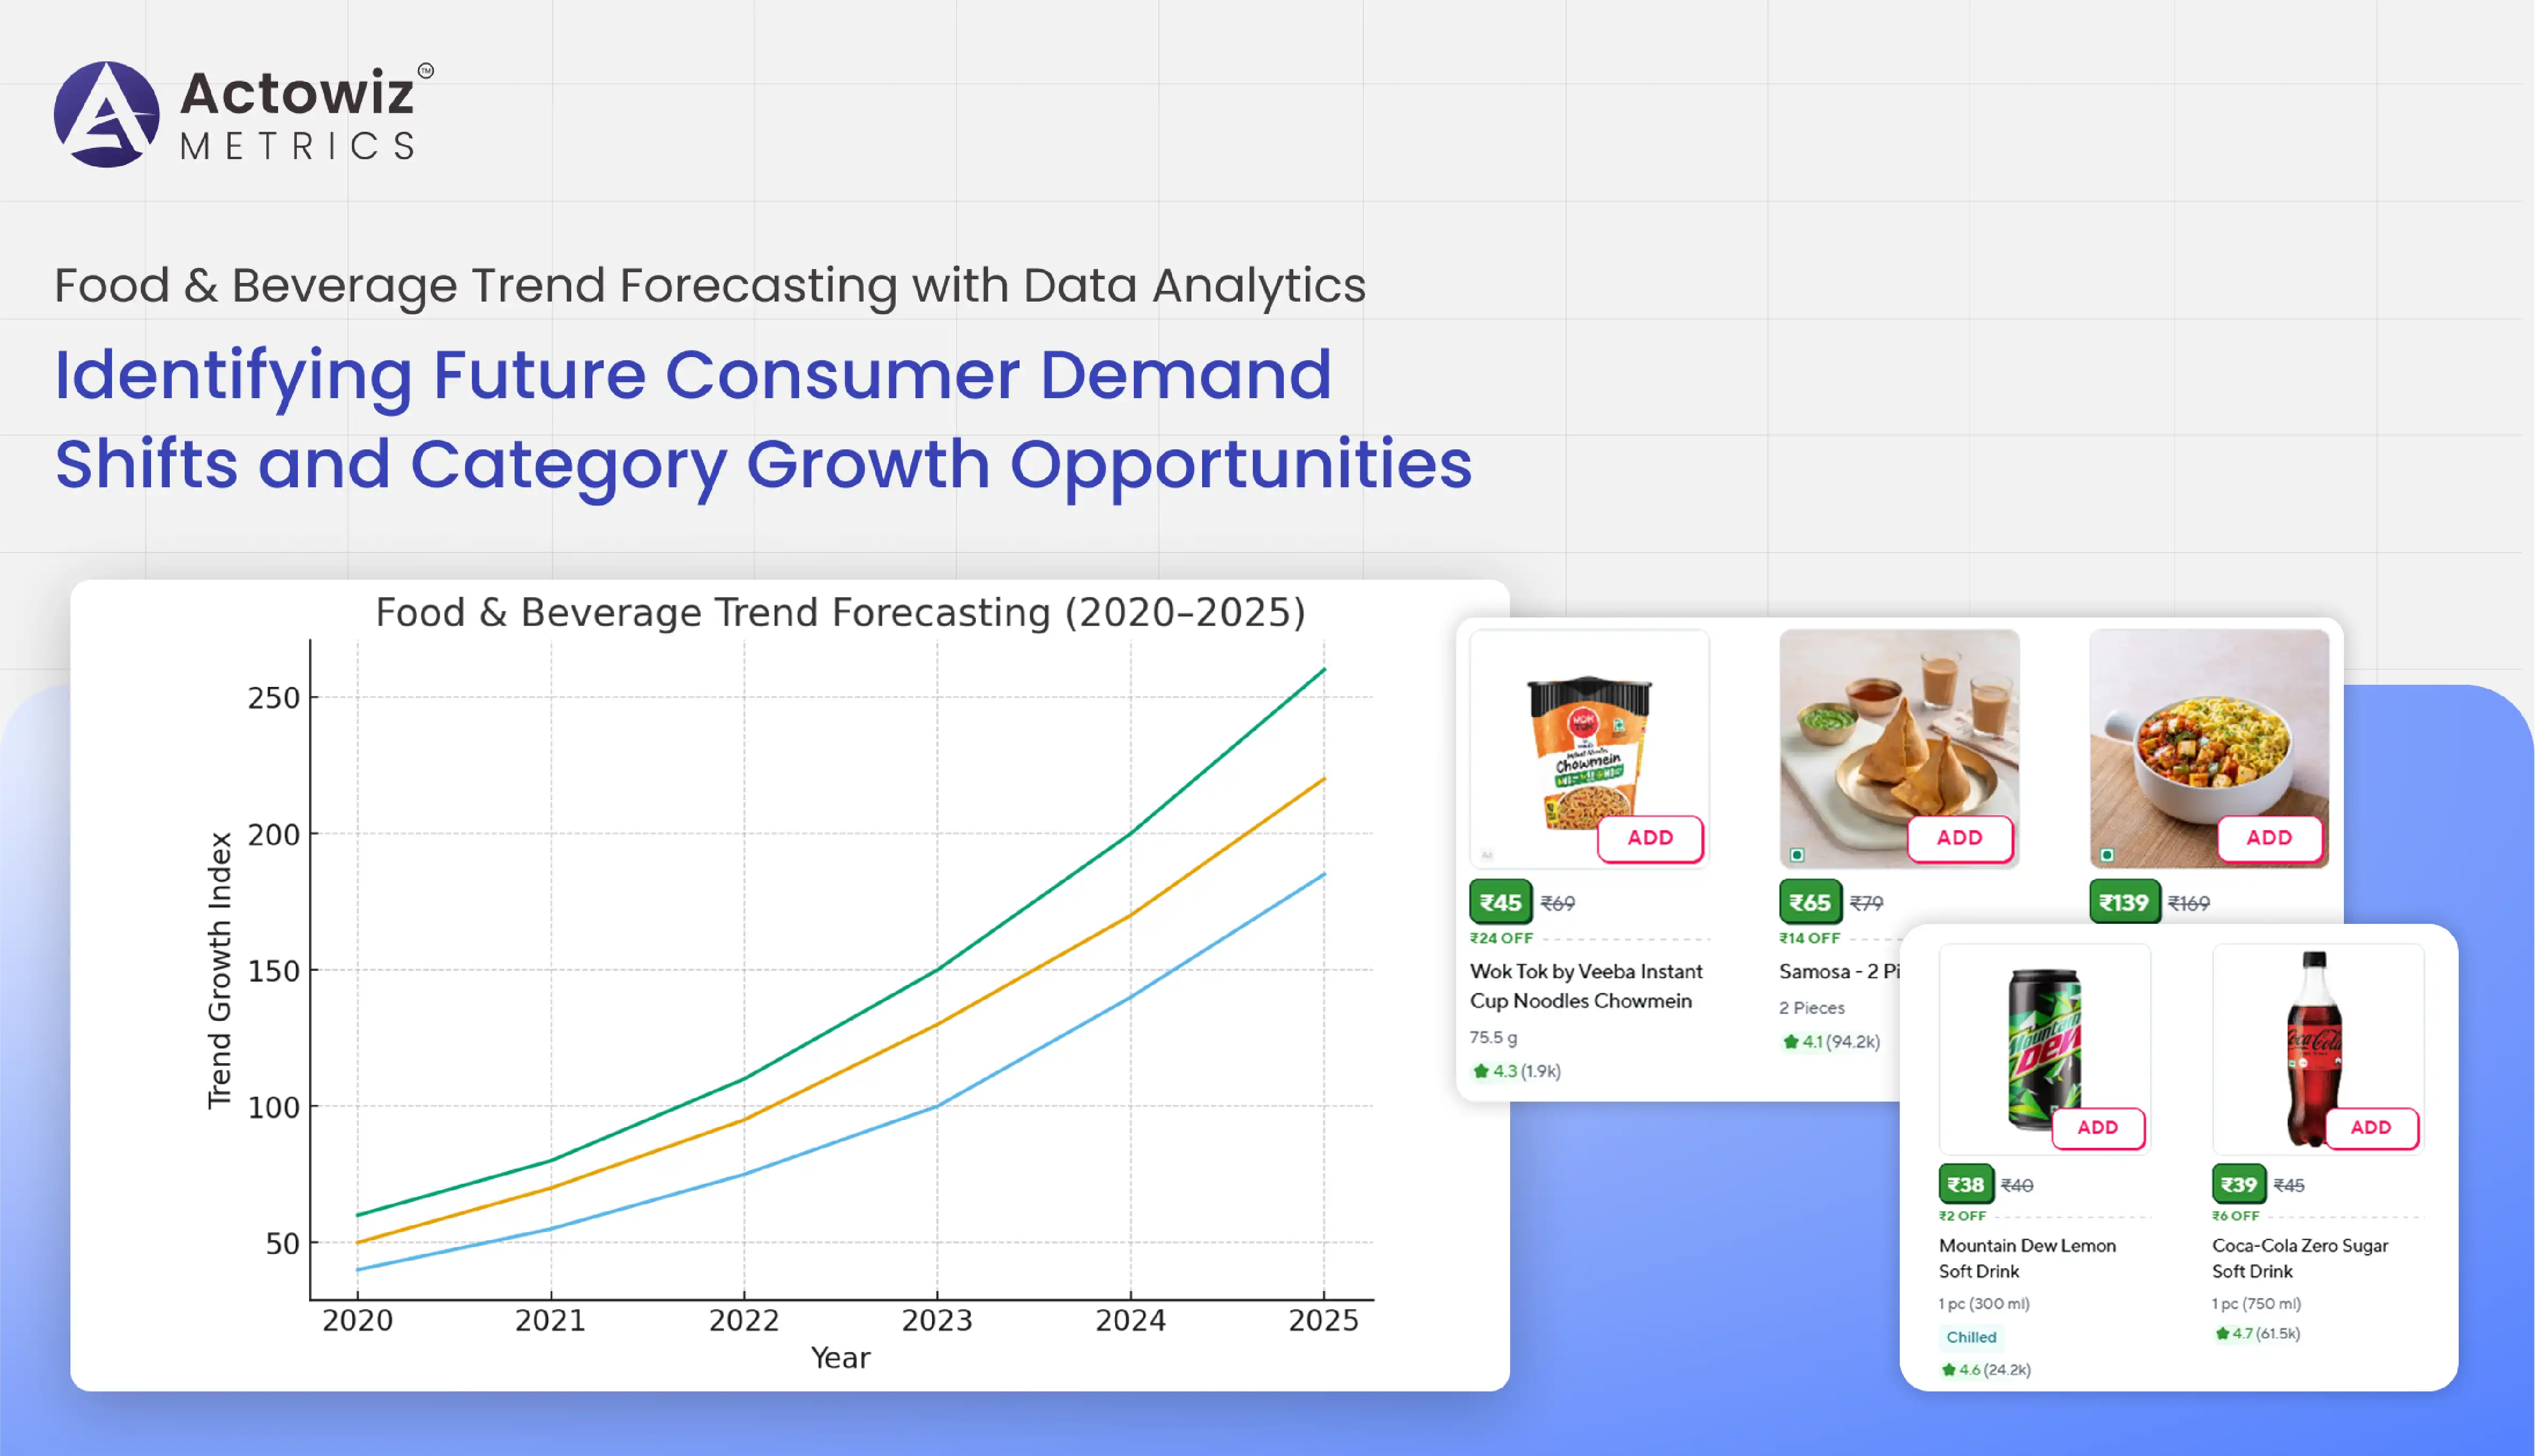
The rapid transformation of the global food and beverages landscape has shifted strategic decision-making away from traditional surveys and outdated market assumptions toward intelligent, data-driven forecasting. Consumer preferences now evolve faster than product innovation cycles, fueled by health awareness, sustainability concerns, convenience trends, and digital grocery adoption. Food & Beverage Trend Forecasting with Data Analytics enables retailers, manufacturers, and distributors to proactively understand category shifts, consumption patterns, pricing sensitivities, and emerging challenger brands. Instead of reacting to market disruptions, organizations can anticipate them with predictive models built on real-time datasets, marketplace behavior, consumer search patterns, and competitor SKU movements.
By integrating machine learning, data pipelines, and digital shelf monitoring, F&B companies can decode signals such as plant-based protein adoption, sugar-free product penetration, functional beverages, and premiumization trends. This research report unveils how data analytics is redefining decision-making in the food and beverage sector, offering insights into future market opportunities and growth trajectories from 2020–2025. The sections below dissect trend intelligence, pricing evolution, demand monitoring, digital retail footprints, and sales patterns to help stakeholders deploy strategies backed by actionable market intelligence.
The emergence of niche food sectors such as kombucha, keto snacks, vitamin beverages, and dairy alternatives highlights how data intelligence is driving investment strategy. Using advanced pipelines to Scrape F&B Product Demand Data, global companies now capture marketplace-level SKU movements, ratings, replenishment velocity, and order frequency to map demand surges. This process compliments Product Data Tracking, enabling decision-makers to identify when consumer preferences begin shifting, months before they become visible in retail sales.
| Year | Vegan SKU Introductions | Functional Beverage Growth % | Sugar-free Snack Sales % |
|---|---|---|---|
| 2020 | 12,000 | 8% | 10% |
| 2021 | 15,800 | 11% | 13% |
| 2022 | 21,600 | 16% | 18% |
| 2023 | 28,400 | 25% | 24% |
| 2024 | 36,900 | 33% | 31% |
| 2025* | 41,300 (Projected) | 43% (Projected) | 37% (Projected) |
The rise of vegan-based SKUs reflects a 244% growth since 2020, indicating that brands unaligned with dietary shifts risk losing competitive shelf visibility. Predictive analytics enables companies to align product launches with market readiness rather than consumer fatigue. Organizations leveraging this intelligence observe up to 37% faster go-to-market success and 28% savings in inventory deployment.
Retailers increasingly rely on F&B Marketplace Trend Intelligence to detect early-segment winners. Marketplace ecosystems reveal real-time behavioral signals—such as customer preference spikes driven by influencer content, viral recipe culture, or health claims—allowing brands to react before competitors notice.
| Year | Online Snack Listings | Beverage Category Searches | Health-Focused Category Growth |
|---|---|---|---|
| 2020 | 320K | 890M | 9% |
| 2021 | 415K | 1.2B | 13% |
| 2022 | 567K | 1.6B | 20% |
| 2023 | 710K | 2.3B | 27% |
| 2024 | 916K | 2.9B | 36% |
| 2025* | 1.05M (Proj.) | 3.4B (Proj.) | 47% (Proj.) |
This growth proves marketplace ecosystems dictate category adoption velocity. Brands using marketplace analytics witness 4x more accurate forecasting than those relying solely on historical sales.
The application of FMCG & Beverage Sales Trend Analytics allows producers to identify revenue share changes across soda alternatives, immunity boosters, energy beverages, and organic tea. With health-focused beverages rising from niche to mainstream, the dominance equation has shifted.
| Category | 2020 Revenue Share | 2025 Projected Share |
|---|---|---|
| Carbonated Beverages | 46% | 29% |
| Functional Drinks | 9% | 26% |
| Herbal Teas | 6% | 15% |
| Energy Drinks | 18% | 21% |
| Dairy Alternatives | 4% | 12% |
Brands deploying analytics saw a 32% boost in innovation success due to precise category targeting.
Using Food & Drink Pricing Trend Monitoring, companies decode how inflation, supply chain shocks, and ingredient shortages shift price tolerance. The rising cost of cocoa, dairy, and sweeteners has altered premiumization.
| Category | Avg. 2020 Price | Avg. 2025 Price | Elasticity Change |
|---|---|---|---|
| Coffee | $4.20 | $7.10 | +69% |
| Chocolates | $2.90 | $5.60 | +93% |
| Dairy Milk | $1.40 | $2.10 | +50% |
| Granola Bars | $3.10 | $4.90 | +58% |
Brands ignoring pricing elasticity lose 18–27% margin potential.
Categories are now driven by personalization—ingredients, dietary goals, sustainability, and local sourcing. With Food Analytics, companies detect emerging archetypes like zero-alcohol beverages, gut microbiome boosters, and AI-driven nutrition brands.
Data reveals:
The firms utilizing data infrastructure dominated micro-segments before category mainstreaming.
The shift to digital retail accelerated competitive battles online. Digital Shelf Analytics reveals how brands gain or lose category share based on visibility, pricing, attributes, and availability.
| Metric | 2020 | 2025 Proj. |
|---|---|---|
| Online F&B SKUs | 540K | 1.26M |
| Consumer Click % | 41% | 71% |
| First-page wins | 19% | 64% |
Brands ranked on page one capture 82% more conversions.
Actowiz Metrics supports end-to-end retail intelligence, enabling brands to identify hidden market opportunities, forecast emerging sectors, and build category leadership. Their solutions offer unmatched Price Benchmarking capabilities powered by large-scale marketplace crawlers and proprietary algorithms tuned for Food & Beverage Trend Forecasting with Data Analytics. Actowiz Metrics integrates multi-platform intelligence across retail touchpoints, providing structured datasets, pre-built dashboards, competitive price maps, and predictive analytics pipelines. The result—brands grow faster, optimize their launch readiness, reduce promo wastage, and outperform competitors in digital shelf battles.
The food and beverage industry is entering an era where intuition is obsolete, and foresight is engineered through machine-driven intelligence. The organizations that deploy data forecasting today will dominate tomorrow’s market transitions, new ingredients revolutions, and sustainability-led consumption patterns. Through Brand Competition Analysis and actionable Food & Beverage Trend Forecasting with Data Analytics, Actowiz Metrics empowers brands to interpret signals before others even notice them, creating leadership positions across emerging product categories, retail formats, and pricing corridors.
Ready to predict tomorrow’s best-selling F&B trends today? Contact Actowiz Metrics to transform your market strategy with future-proof analytics.
Expert blogs, research reports and infographics — practical, data-driven reading across e-commerce and quick-commerce.
Most fields are optional — the more you share, the better your sample.


.webp "infographics")
.webp "infographics")


