BLOG


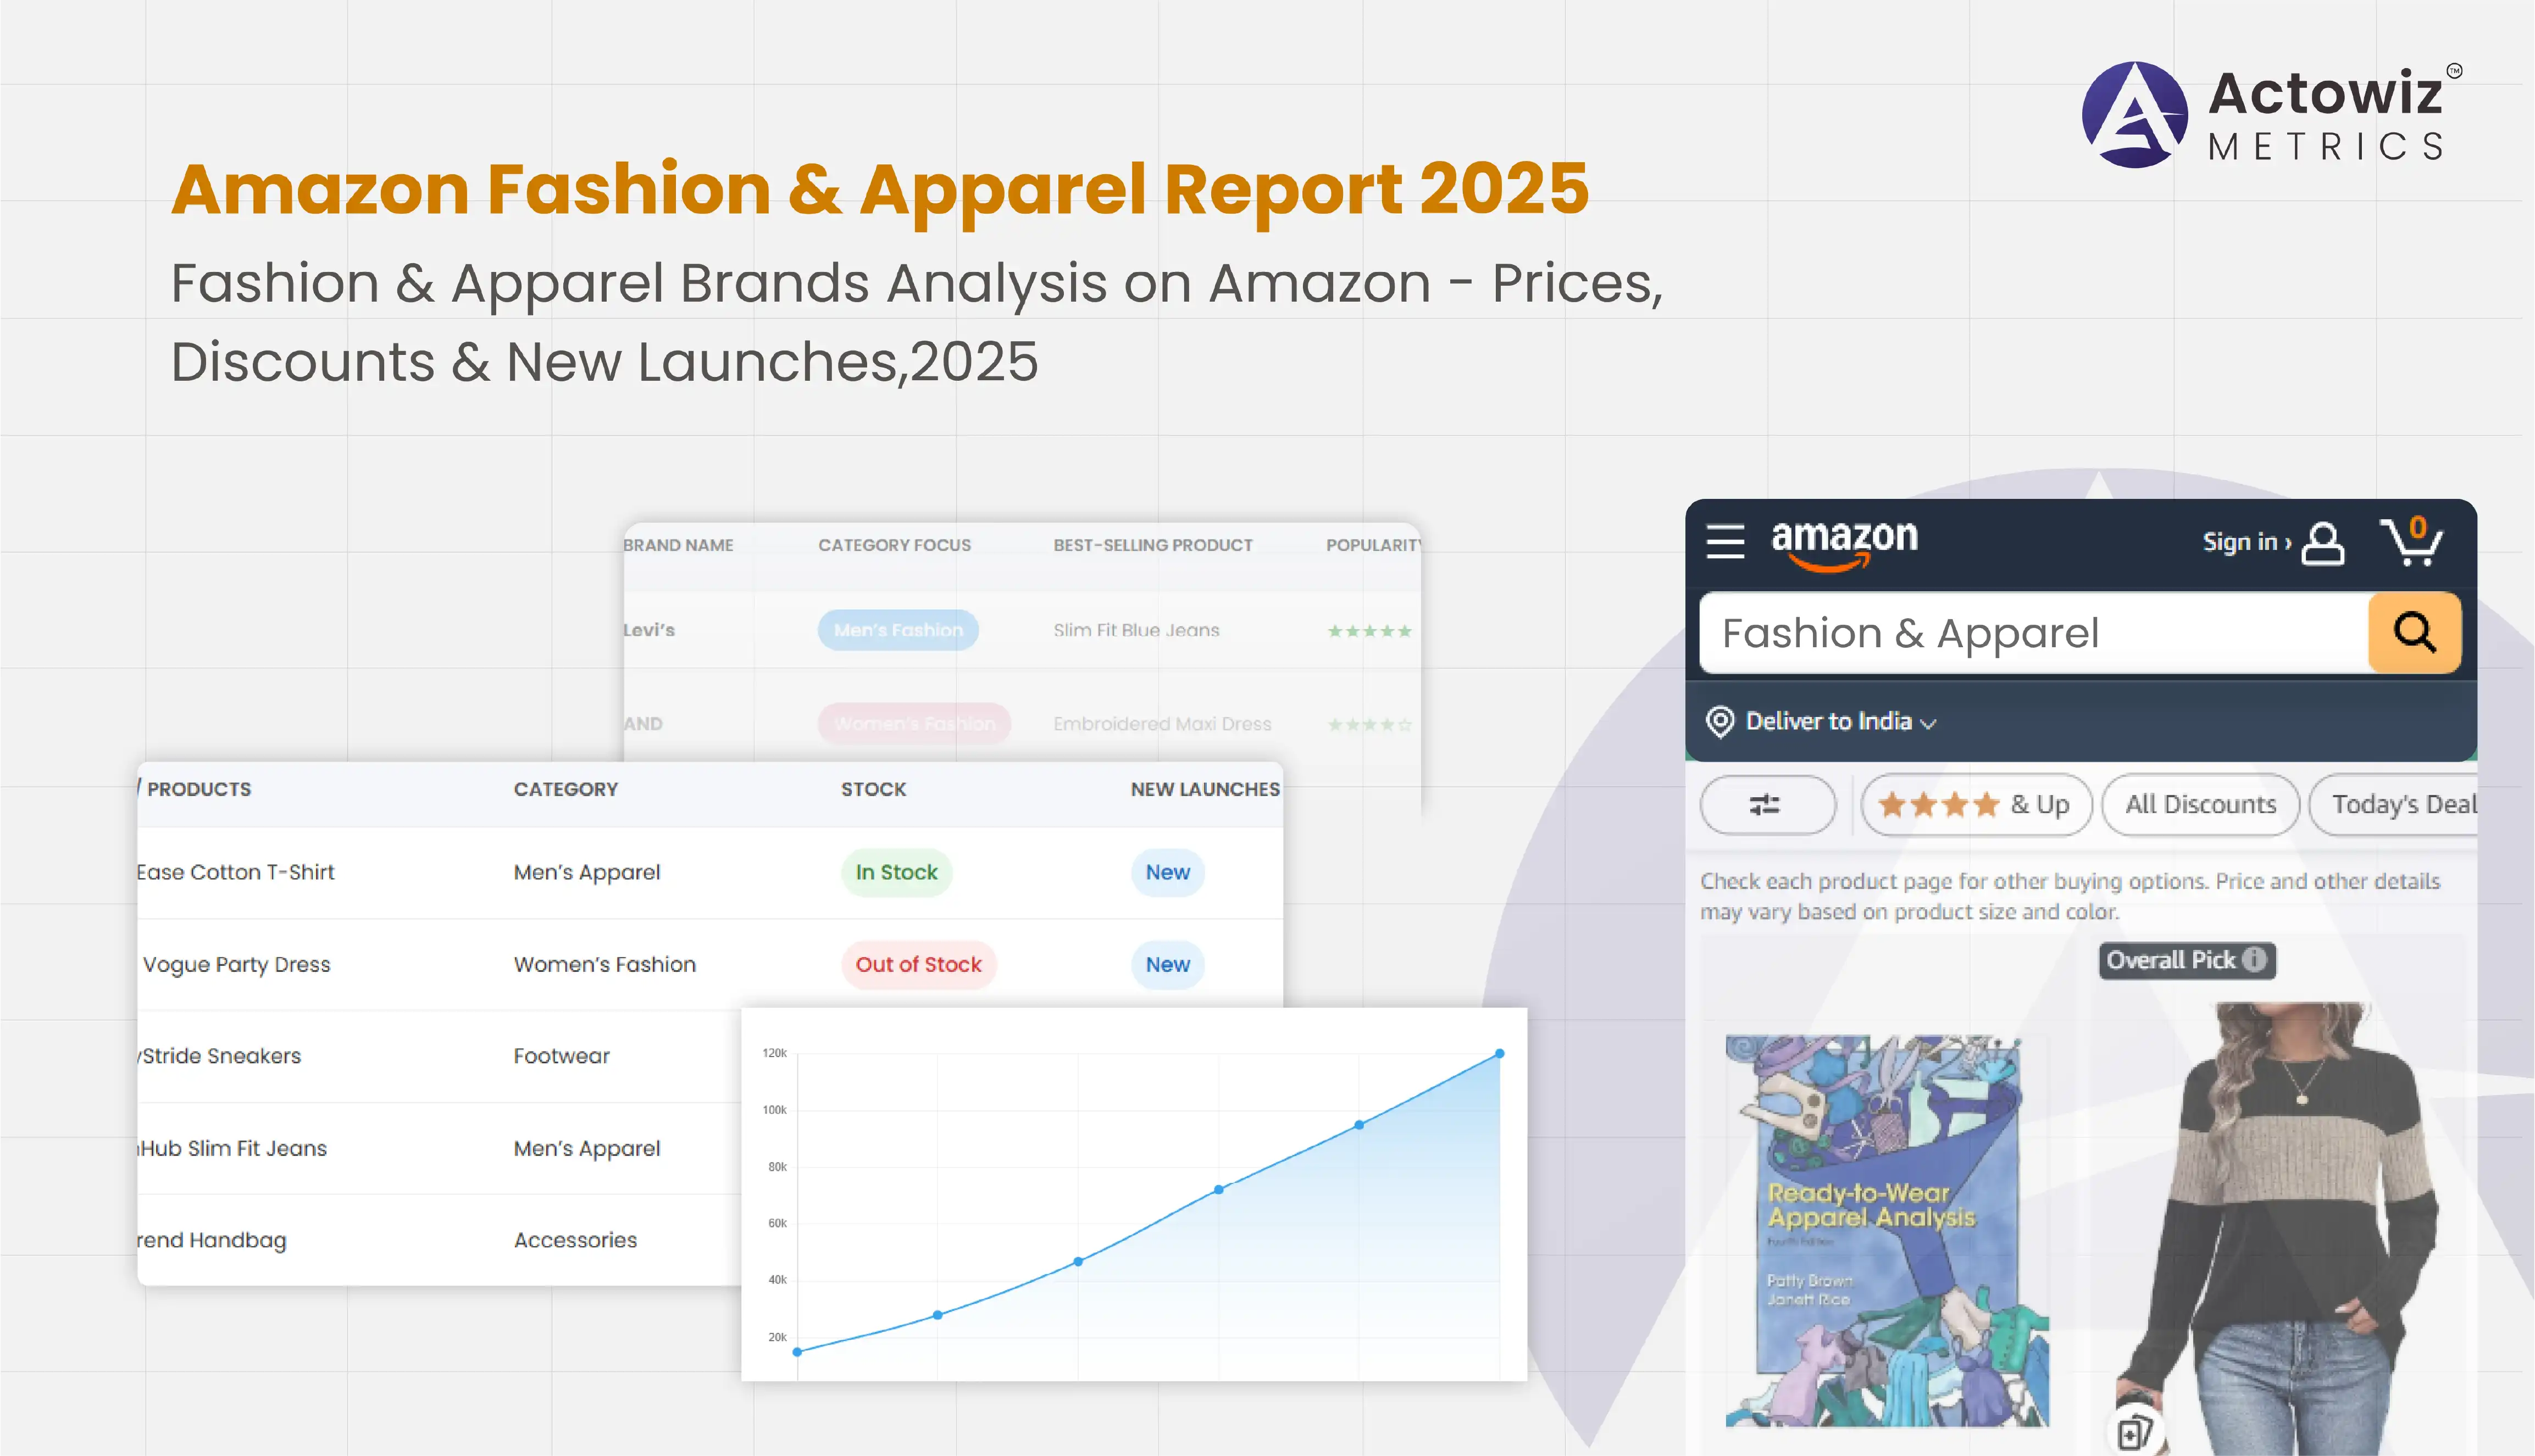
The online fashion and apparel segment has grown exponentially over the last five years. With the rise of digital marketplaces, Fashion & Apparel Brands Analysis on Amazon is essential for retailers, brands, and market analysts to understand how pricing, promotions, inventory, and emerging trends influence consumer behavior.
Amazon has become a primary platform for fashion shoppers, offering thousands of brands across categories like men’s, women’s, kids, and premium apparel. Tracking product launches, discounts, and stock fluctuations provides actionable intelligence for inventory planning, marketing, and competitive positioning.
This report leverages historical data from 2020–2025, real-time e-commerce analytics, and Apparel promotions & offers Insights on Amazon to provide a comprehensive view of the fashion landscape. By integrating automated scraping, predictive analytics, and trend monitoring, businesses can optimize sales and enhance operational efficiency.
Monitoring stock levels and pricing trends is crucial for strategic decision-making. Apparel stock status & pricing Analysis on Amazon examines SKU availability, price fluctuations, and discount strategies to help brands maintain a competitive edge.
| Year | Avg. SKUs Available (K) | Avg. Discount (%) | Stock-Out Frequency (%) | Avg. Price Change (%) |
|---|---|---|---|---|
| 2020 | 120 | 5 | 8 | 3 |
| 2021 | 150 | 6 | 7 | 3.5 |
| 2022 | 180 | 6.5 | 6 | 3.8 |
| 2023 | 210 | 7 | 5 | 4 |
| 2024 | 240 | 7.5 | 4.5 | 4.2 |
| 2025 | 270 | 8 | 4 | 4.5 |
Insights:
Strategic monitoring of these metrics allows brands to optimize stock allocation, prevent lost sales, and respond swiftly to market shifts.
Automation is key to handling Amazon’s vast catalog. Scrape Amazon clothing product listings enables businesses to extract data on prices, stock, promotions, and product attributes across thousands of SKUs efficiently.
| Category | 2020 Listings | 2021 Listings | 2022 Listings | 2023 Listings | 2024 Listings | 2025 Listings |
|---|---|---|---|---|---|---|
| Men’s Apparel | 40K | 50K | 60K | 75K | 85K | 100K |
| Women’s Apparel | 50K | 60K | 70K | 85K | 95K | 110K |
| Kids Apparel | 30K | 35K | 40K | 50K | 55K | 65K |
Analysis:
By integrating Amazon Bestselling Fashion Brands Analytics, businesses can identify high-performing SKUs and prioritize stock allocation for maximum returns.
Emerging brands influence diversity and consumer engagement. New fashion Brands analysis on Amazon highlights launches, initial performance, and adoption rates.
| Year | New Brands Launched | Avg. Initial Discount (%) | Avg. 1-Month Sales (Units) | Avg. Rating |
|---|---|---|---|---|
| 2020 | 120 | 5 | 1,500 | 4.2 |
| 2021 | 150 | 6 | 2,000 | 4.3 |
| 2022 | 180 | 6.5 | 2,500 | 4.4 |
| 2023 | 200 | 7 | 3,000 | 4.5 |
| 2024 | 220 | 7.5 | 3,500 | 4.6 |
| 2025 | 250 | 8 | 4,000 | 4.7 |
Key Takeaways:
Data-driven insights allow retailers to identify high-potential brands, forecast demand, and design targeted marketing campaigns.
Promotions drive consumer engagement and sales volumes. Apparel promotions & offers Insights on Amazon analyzes the effectiveness of discount campaigns, flash sales, and seasonal offers.
| Year | Avg. Promotions per Month | Avg. Discount (%) | Conversion Rate (%) | Avg. Promo Duration (Days) |
|---|---|---|---|---|
| 2020 | 8 | 5 | 3.5 | 3 |
| 2021 | 10 | 6 | 4 | 3.5 |
| 2022 | 12 | 6.5 | 4.2 | 4 |
| 2023 | 14 | 7 | 4.5 | 4 |
| 2024 | 16 | 7.5 | 4.8 | 4.5 |
| 2025 | 18 | 8 | 5 | 5 |
Observations:
Businesses leveraging E-commerce Analytics can track promotion effectiveness and adjust campaigns dynamically to optimize revenue.
Understanding top brands’ performance helps retailers align inventory and marketing strategies. Trending fashion brands analytics on Amazon focuses on high-demand brands, customer engagement, and pricing trends.
| Brand Category | Avg. Customer Ratings | Avg. Monthly Sales (Units) | Avg. Discount (%) | Market Share (%) |
|---|---|---|---|---|
| Premium Apparel | 4.6 | 3,500 | 7 | 25 |
| Mid-range | 4.4 | 4,000 | 6.5 | 35 |
| Budget Apparel | 4.2 | 5,500 | 5.5 | 40 |
Insights:
Integrating Amazon Fashion Brands reviews & sentiment analytics enhances understanding of customer perception, enabling brands to improve products and engagement.
Monitoring stock is critical for avoiding lost sales and maintaining customer satisfaction. Extract Amazon clothing availability data captures SKU availability, low-stock alerts, and replenishment patterns.
| Year | Avg. Available SKUs (K) | Avg. Out-of-Stock (%) | Avg. Restock Time (Days) | Avg. Backorder Requests |
|---|---|---|---|---|
| 2020 | 100 | 8 | 7 | 120 |
| 2021 | 120 | 7 | 6.5 | 100 |
| 2022 | 140 | 6 | 6 | 80 |
| 2023 | 160 | 5.5 | 5.5 | 70 |
| 2024 | 180 | 5 | 5 | 60 |
| 2025 | 200 | 4.5 | 4.5 | 50 |
Benefits:
Actowiz Metrics combines Scraping Amazon clothing product listings, and Amazon Bestselling Brands Analytics with advanced analytics. This provides real-time insights on pricing, stock, promotions, and brand trends. By leveraging these tools, businesses can forecast demand, track competition, optimize inventory, and maximize revenue in the highly competitive online fashion market.
Fashion & Apparel Brands Analysis on Amazon is critical for retailers and brands navigating India’s fast-evolving e-commerce fashion space. Using Actowiz Metrics’ data-driven solutions, businesses can track stock status, pricing trends, promotions, top-selling and trending brands, and customer sentiment. Historical and real-time insights from 2020–2025 help optimize inventory, improve marketing strategies, and maximize profitability.
Leverage Fashion & Apparel Brands Analysis on Amazon with Actowiz Metrics to stay ahead of trends, enhance operational efficiency, and drive growth in the dynamic online fashion marketplace.
Expert blogs, research reports and infographics — practical, data-driven reading across e-commerce and quick-commerce.
Most fields are optional — the more you share, the better your sample.


.webp "infographics")
.webp "infographics")


